| Param | Original file | Final file |
|---|---|---|
| Filename | modeM0/AS1A14_022T05_9000006504_53700cztM0_level2.fits | modeM0/AS1A14_022T05_9000006504_53700cztM0_level2_quad_clean.evt |
| Size (bytes) | 643,023,360 | 53,622,720 |
| Size | 613.2 MB | 51.1 MB |
| Events in quadrant A | 10,410,068 | 143,634 |
| Events in quadrant B | 3,350,898 | 437,128 |
| Events in quadrant C | 6,513,996 | 325,145 |
| Events in quadrant D | 3,163,043 | 387,006 |
| Mode SS | |||
|---|---|---|---|
| Quadrant | BADHDUFLAG | Total packets | Discarded packets |
| A | 0 | 96 | 0 |
| B | 0 | 96 | 0 |
| C | 0 | 96 | 0 |
| D | 0 | 96 | 0 |
| Mode M9 | |||
|---|---|---|---|
| Quadrant | BADHDUFLAG | Total packets | Discarded packets |
| A | 0 | 9 | 0 |
| B | 0 | 9 | 0 |
| C | 0 | 9 | 0 |
| D | 0 | 9 | 0 |
| Mode M0 | |||
|---|---|---|---|
| Quadrant | BADHDUFLAG | Total packets | Discarded packets |
| A | 0 | 34168 | 0 |
| B | 0 | 13284 | 0 |
| C | 0 | 22605 | 0 |
| D | 0 | 12730 | 0 |
| Quadrant | Total seconds | Saturated seconds | Saturation percentage |
|---|---|---|---|
| A | 4700 | 3401 | 72.361702% |
| B | 4701 | 417 | 8.870453% |
| C | 4701 | 1313 | 27.930228% |
| D | 4701 | 201 | 4.275686% |
Noise dominated data is calculated using 1-second bins in cleaned event files. If a bin has >2000 counts, and if more than 50% of those come from <1% of pixels, then it is considered to be noise-dominated and hence unusable.
| Quadrant | # 1 sec bins | Bins with >0 counts | Bins with >2000 counts | High rate bins dominated by noise | Noise dominated (total time) | Noise dominated (detector-on time) | Marked lightcurve |
|---|---|---|---|---|---|---|---|
| A | 4699 | 4699 | 3443 | 3443 | 73.27% | 73.27% | 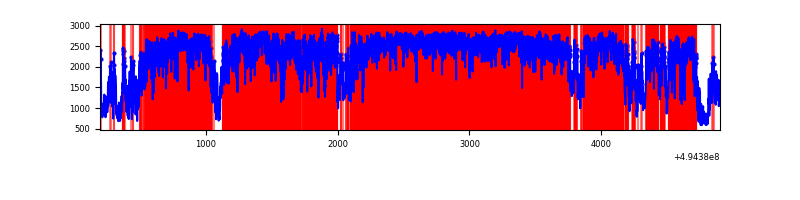 |
| B | 4700 | 4700 | 339 | 339 | 7.21% | 7.21% | 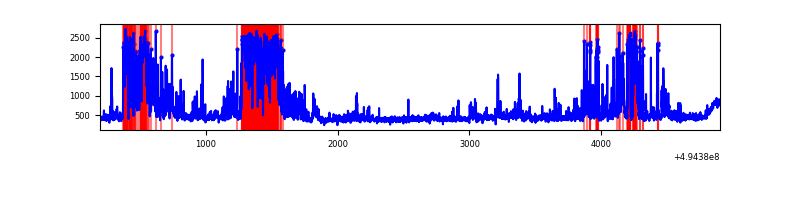 |
| C | 4700 | 4700 | 1325 | 1325 | 28.19% | 28.19% |  |
| D | 4700 | 4700 | 192 | 192 | 4.09% | 4.09% | 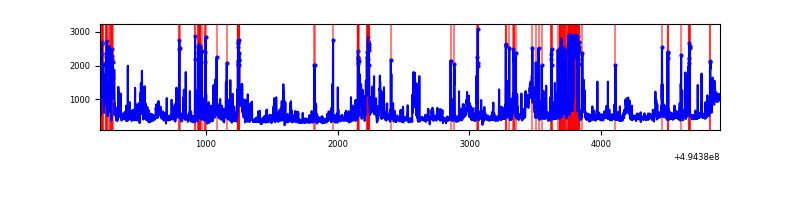 |
Top three noisy pixels from each quadrant. If the there are fewer than three noisy pixels in the level2.evt file, extra rows are filled as -1
| Pixel properties | Quadrant properties | ||||||
|---|---|---|---|---|---|---|---|
| Quadrant | DetID | PixID | Counts | Sigma | Mean | Median | Sigma |
| A | 3 | 63 | 6717544 | 77609.11 | 344 | 336 | 86.6 |
| A | 3 | 78 | 1859867 | 21484.6 | 344 | 336 | 86.6 |
| A | 14 | 254 | 214784 | 2477.68 | 344 | 336 | 86.6 |
| B | 5 | 185 | 1266027 | 12219.89 | 473 | 457 | 103.6 |
| B | 4 | 81 | 83455 | 801.4 | 473 | 457 | 103.6 |
| B | 0 | 197 | 18470 | 173.93 | 473 | 457 | 103.6 |
| C | 15 | 224 | 2509680 | 21752.83 | 414 | 410 | 115.4 |
| C | 1 | 241 | 1414563 | 12259.28 | 414 | 410 | 115.4 |
| C | 15 | 158 | 305498 | 2644.8 | 414 | 410 | 115.4 |
| D | 2 | 37 | 395483 | 2894.12 | 474 | 451 | 136.5 |
| D | 1 | 241 | 346360 | 2534.23 | 474 | 451 | 136.5 |
| D | 7 | 70 | 179874 | 1314.5 | 474 | 451 | 136.5 |
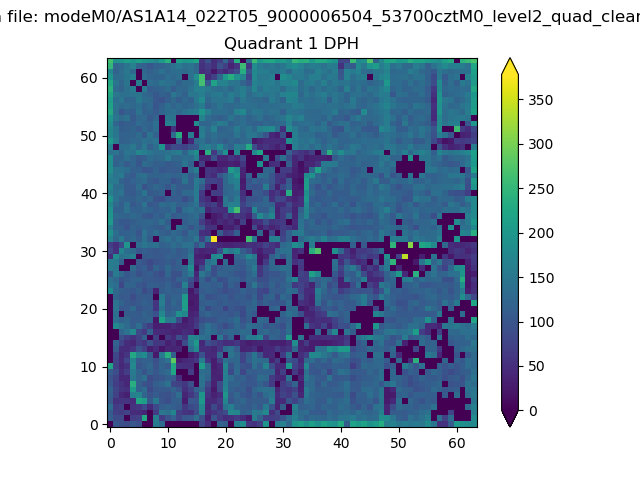
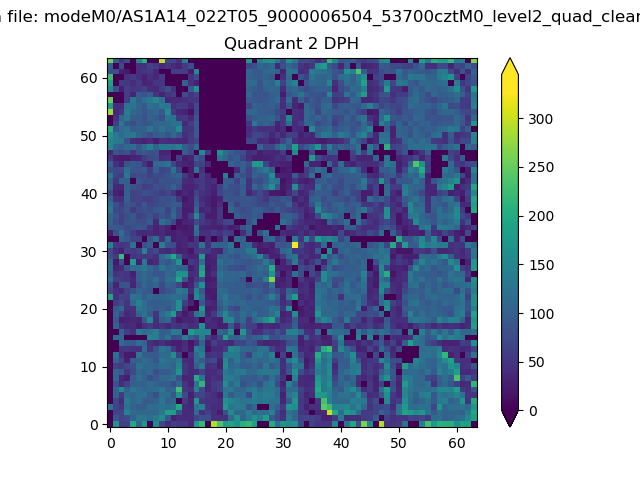
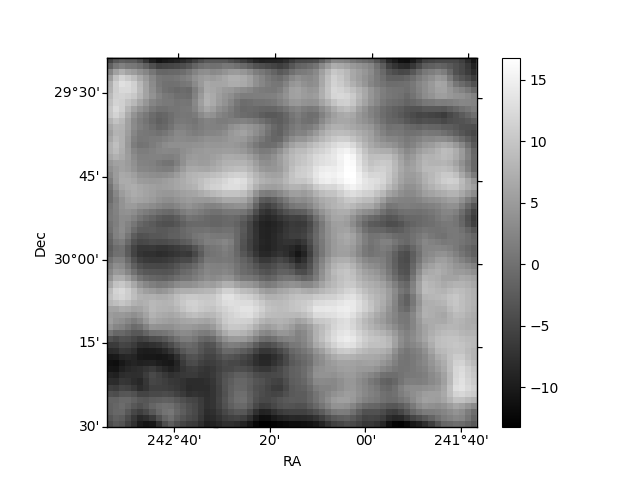
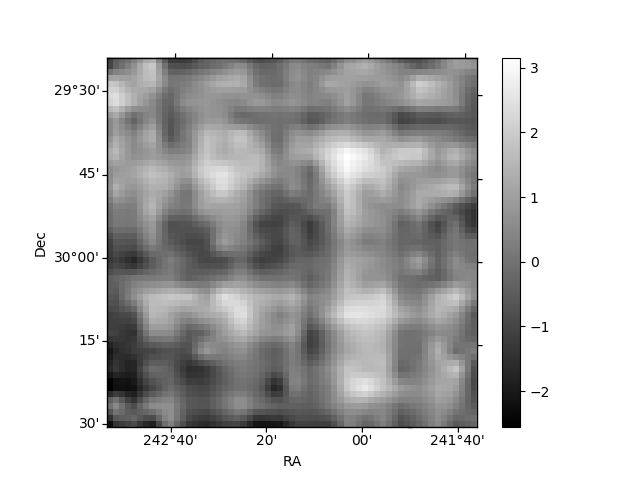
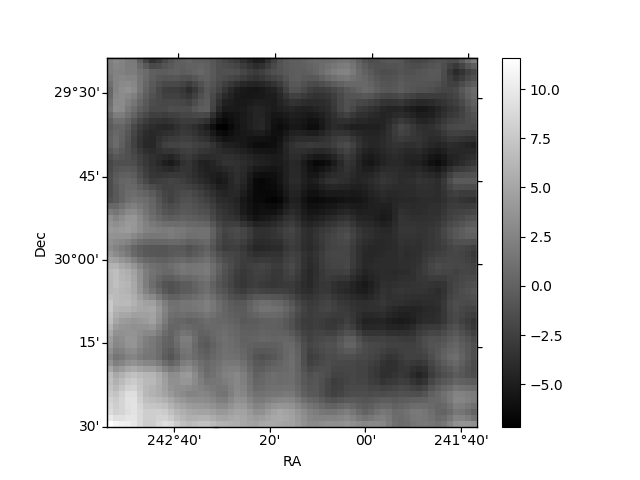
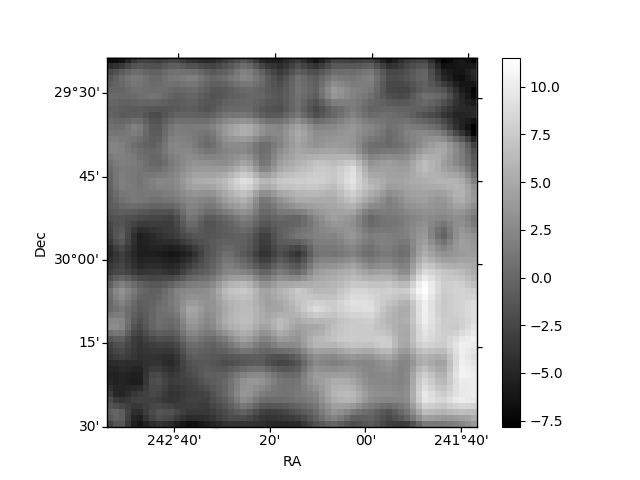
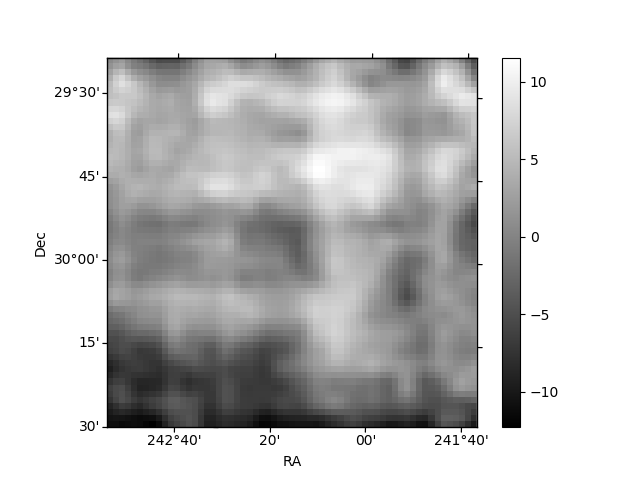
Histogram calculated using DETX and DETY for each event in the final _common_clean file
| Quadrant A | 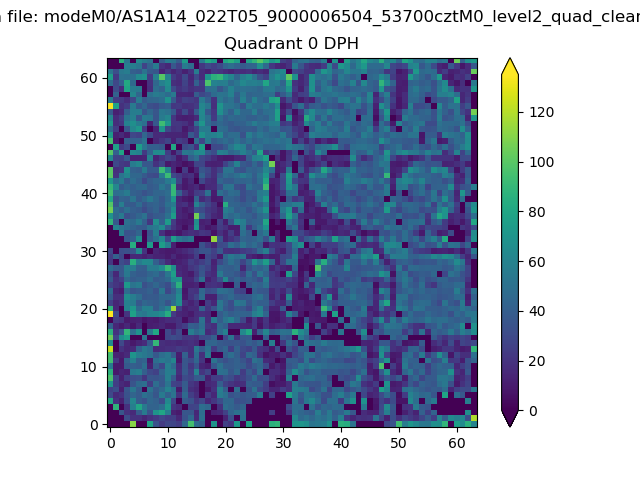 |
 |
Quadrant B |
|---|---|---|---|
| Quadrant D | 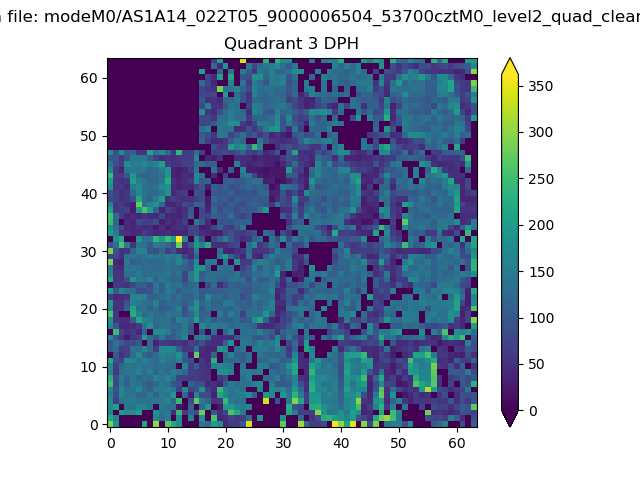 |
 |
Quadrant C |
| Plot type | Count rate plots | Images |
|---|---|---|
| Comparison with Poisson distribution Blue bars denote a histogram of data divided into 1 sec bins. Red curve is a Poisson curve with rate = median count rate of data. |
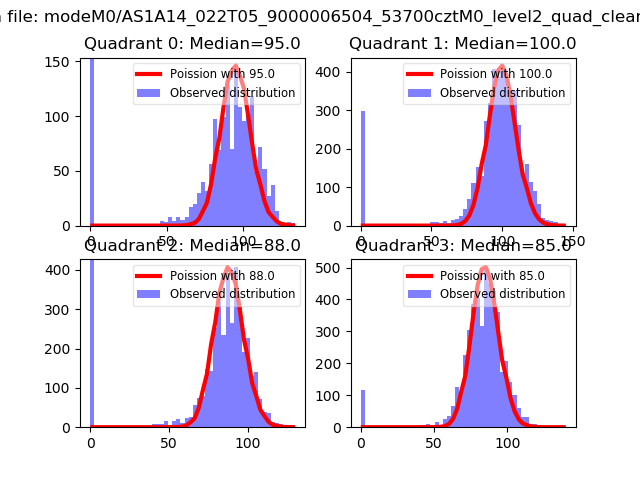 |
 |
| Quadrant-wise count rates Data is divided into 100 sec bins |
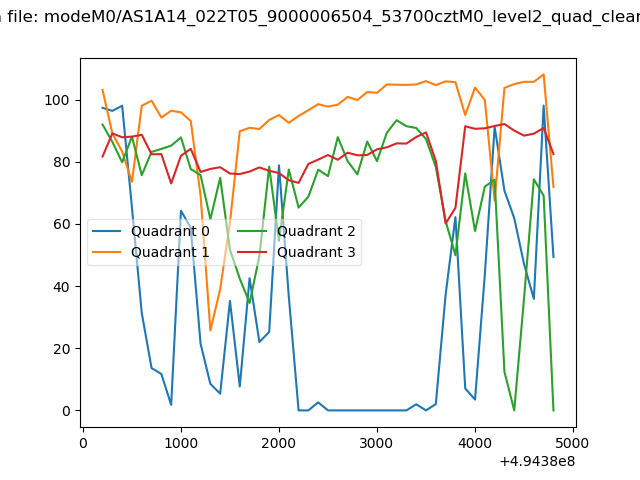 |
|
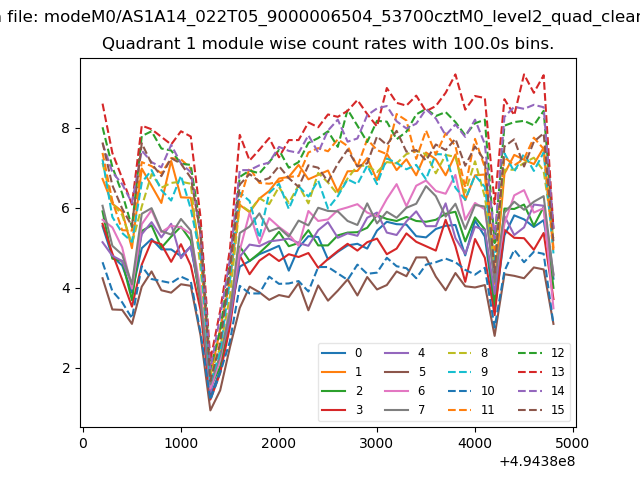
| Module-wise count rates for Quadrant A Data is divided into 100 sec bins |
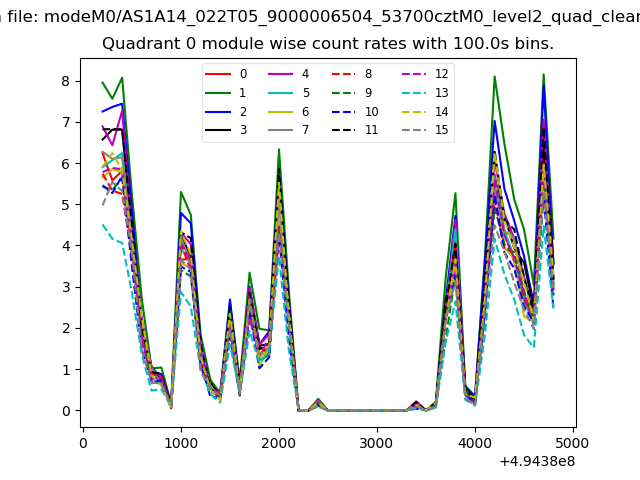 |
 |
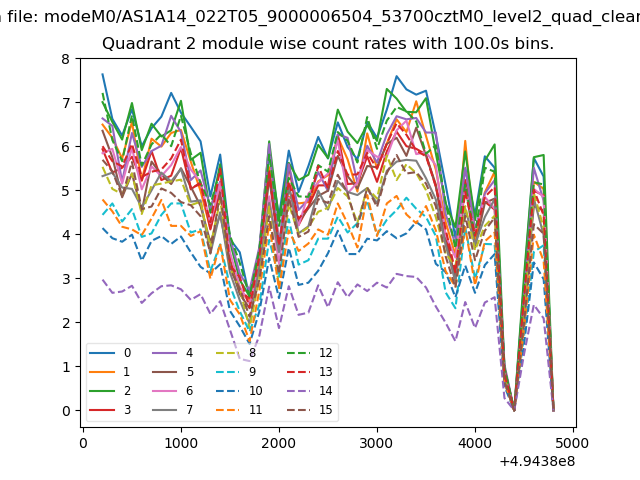
| Module-wise count rates for Quadrant B Data is divided into 100 sec bins |
 |
 |
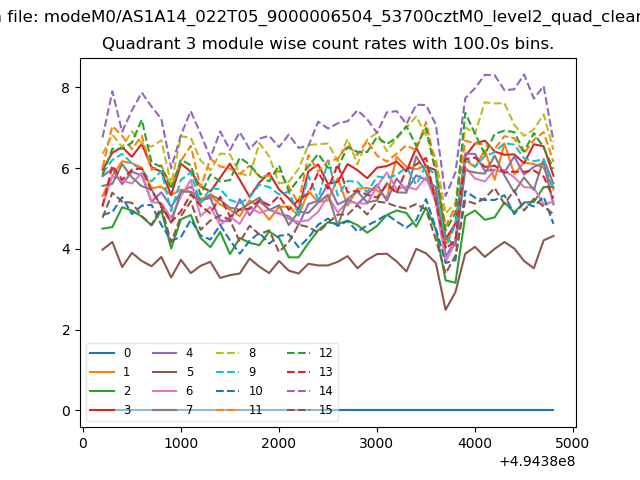
| Module-wise count rates for Quadrant C Data is divided into 100 sec bins |
 |
 |
| Module-wise count rates for Quadrant D Data is divided into 100 sec bins |
 |
 |
| Parameter | Plot |
|---|---|
| CZT HV Monitor | 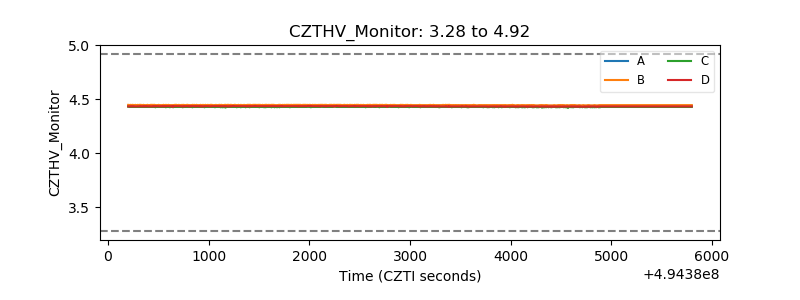 |
| D_VDD | 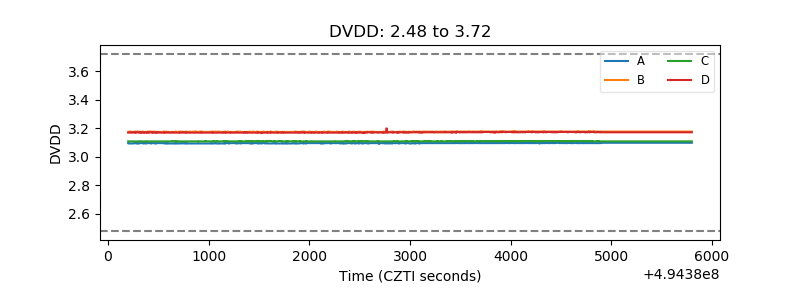 |
| Temperature 1 | 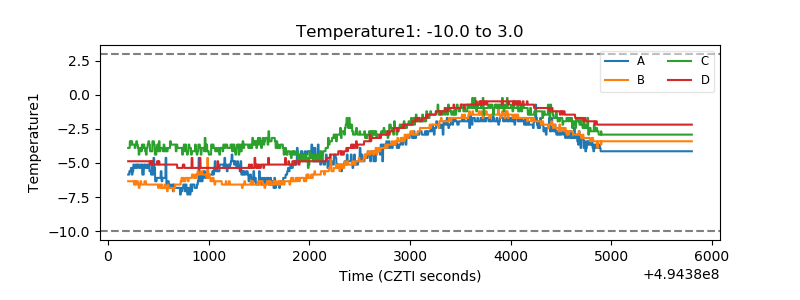 |
| Veto HV Monitor | 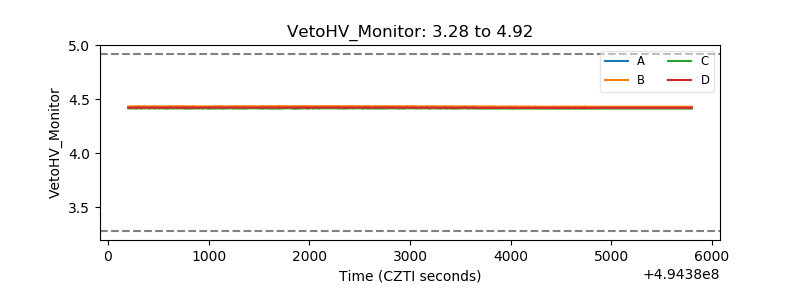 |
| Veto LLD | 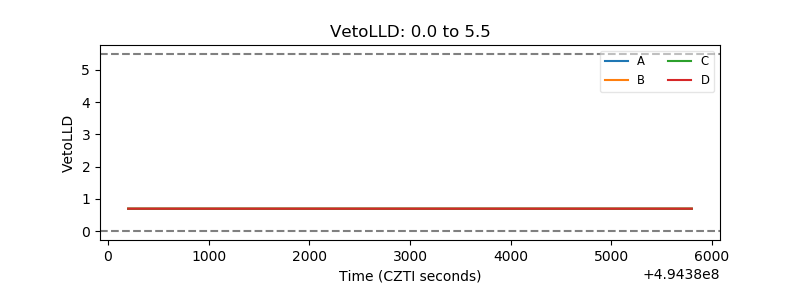 |
| Alpha Counter | 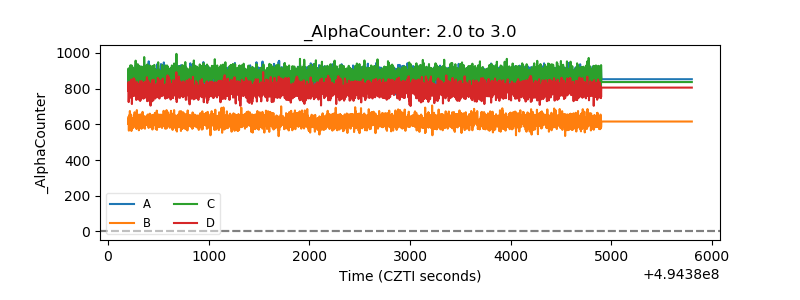 |
| _CPM_Rate | 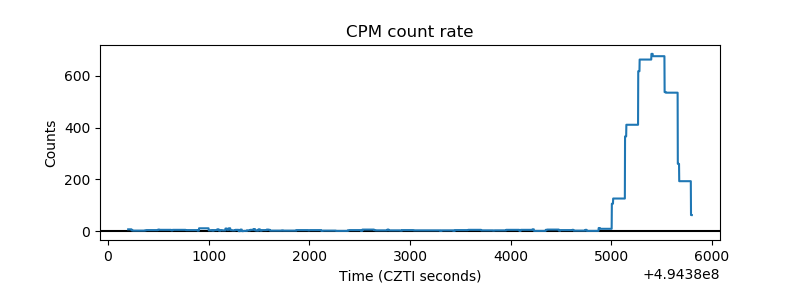 |
| CZT Counter | 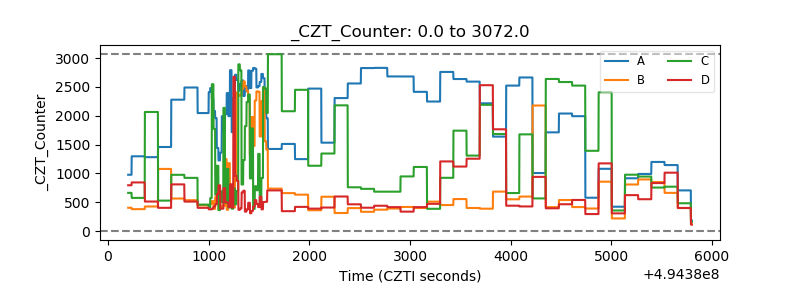 |
| +2.5 Volts monitor | 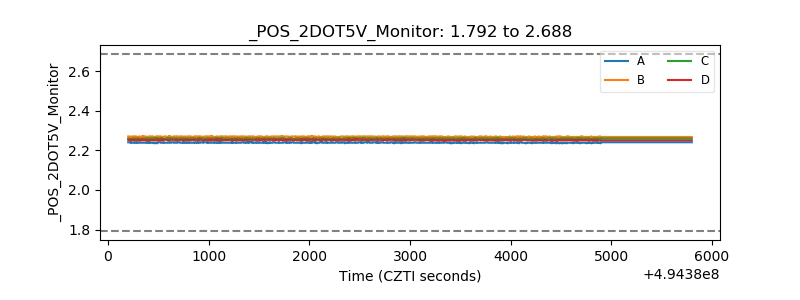 |
| +5 Volts monitor | 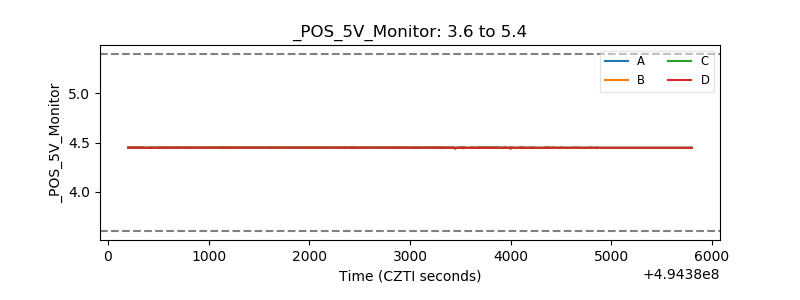 |
| _ROLL_ROT | 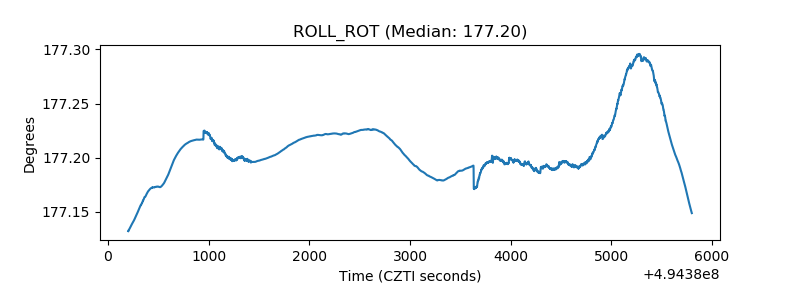 |
| _Roll_DEC | 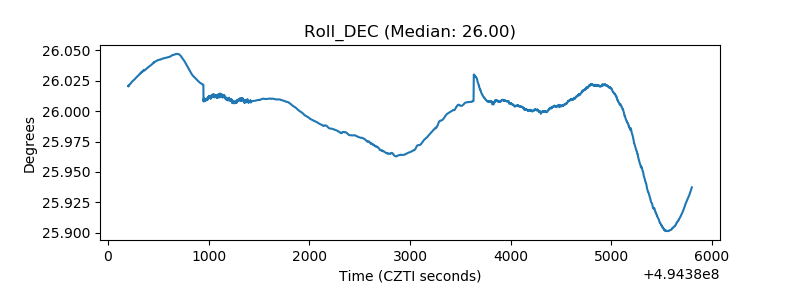 |
| _Roll_RA | 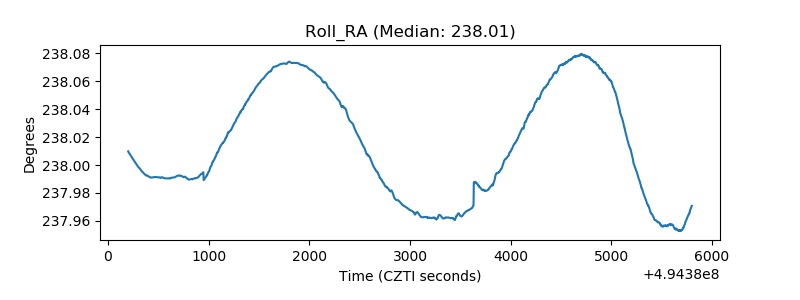 |
| Veto Counter | 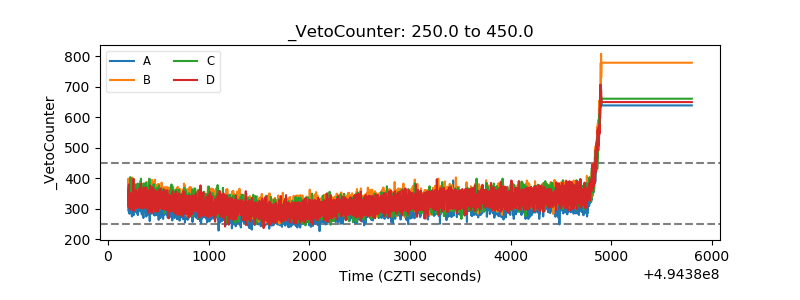 |