| Param | Original file | Final file |
|---|---|---|
| Filename | modeM0/AS1A14_022T05_9000006504_53702cztM0_level2.fits | modeM0/AS1A14_022T05_9000006504_53702cztM0_level2_quad_clean.evt |
| Size (bytes) | 313,954,560 | 29,609,280 |
| Size | 299.4 MB | 28.2 MB |
| Events in quadrant A | 4,906,440 | 62,109 |
| Events in quadrant B | 1,360,986 | 277,400 |
| Events in quadrant C | 3,411,865 | 169,549 |
| Events in quadrant D | 1,751,762 | 209,555 |
| Mode SS | |||
|---|---|---|---|
| Quadrant | BADHDUFLAG | Total packets | Discarded packets |
| A | 0 | 98 | 40 |
| B | 0 | 102 | 40 |
| C | 0 | 99 | 33 |
| D | 0 | 97 | 33 |
| Mode M9 | |||
|---|---|---|---|
| Quadrant | BADHDUFLAG | Total packets | Discarded packets |
| A | 0 | 8 | 6 |
| B | 0 | 8 | 6 |
| C | 0 | 9 | 5 |
| D | 0 | 8 | 6 |
| Mode M0 | |||
|---|---|---|---|
| Quadrant | BADHDUFLAG | Total packets | Discarded packets |
| A | 0 | 33457 | 17381 |
| B | 0 | 10110 | 4300 |
| C | 0 | 24339 | 12555 |
| D | 0 | 12776 | 5883 |
| Quadrant | Total seconds | Saturated seconds | Saturation percentage |
|---|---|---|---|
| A | 2201 | 1639 | 74.466152% |
| B | 2630 | 16 | 0.608365% |
| C | 2375 | 649 | 27.326316% |
| D | 2507 | 132 | 5.265257% |
Noise dominated data is calculated using 1-second bins in cleaned event files. If a bin has >2000 counts, and if more than 50% of those come from <1% of pixels, then it is considered to be noise-dominated and hence unusable.
| Quadrant | # 1 sec bins | Bins with >0 counts | Bins with >2000 counts | High rate bins dominated by noise | Noise dominated (total time) | Noise dominated (detector-on time) | Marked lightcurve |
|---|---|---|---|---|---|---|---|
| A | 7238 | 2483 | 1637 | 1637 | 22.62% | 65.93% | 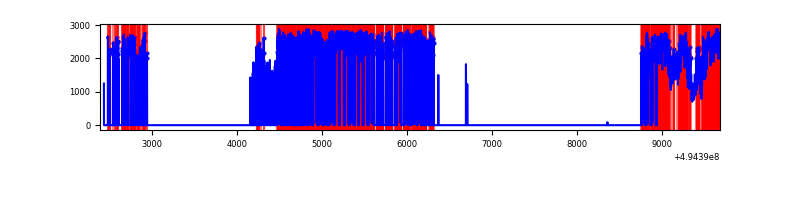 |
| B | 7231 | 2823 | 17 | 17 | 0.24% | 0.60% | 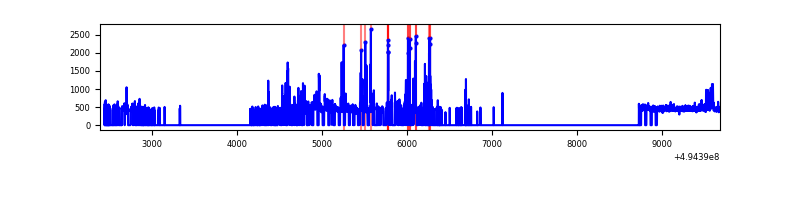 |
| C | 7224 | 2623 | 654 | 654 | 9.05% | 24.93% | 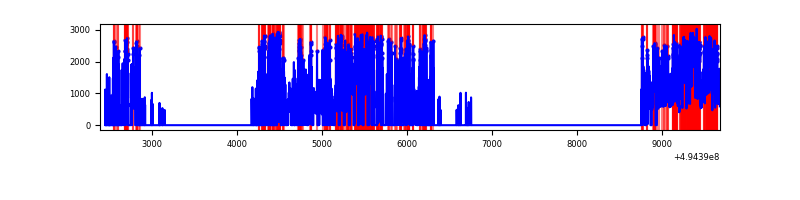 |
| D | 7284 | 2727 | 139 | 139 | 1.91% | 5.10% | 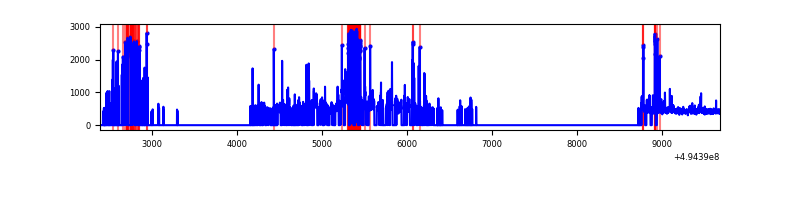 |
Top three noisy pixels from each quadrant. If the there are fewer than three noisy pixels in the level2.evt file, extra rows are filled as -1
| Pixel properties | Quadrant properties | ||||||
|---|---|---|---|---|---|---|---|
| Quadrant | DetID | PixID | Counts | Sigma | Mean | Median | Sigma |
| A | 3 | 63 | 4017956 | 94774.74 | 165 | 161 | 42.4 |
| A | 14 | 254 | 85434 | 2011.48 | 165 | 161 | 42.4 |
| A | 3 | 78 | 54550 | 1282.97 | 165 | 161 | 42.4 |
| B | 5 | 185 | 78691 | 1265.76 | 284 | 275 | 62.0 |
| B | 10 | 254 | 72555 | 1166.72 | 284 | 275 | 62.0 |
| B | 4 | 216 | 29015 | 463.91 | 284 | 275 | 62.0 |
| C | 15 | 224 | 1383536 | 22297.49 | 218 | 216 | 62.0 |
| C | 13 | 3 | 416190 | 6705.01 | 218 | 216 | 62.0 |
| C | 1 | 241 | 205905 | 3315.46 | 218 | 216 | 62.0 |
| D | 14 | 50 | 210696 | 2777.25 | 258 | 246 | 75.8 |
| D | 1 | 241 | 170956 | 2252.81 | 258 | 246 | 75.8 |
| D | 10 | 172 | 112026 | 1475.13 | 258 | 246 | 75.8 |
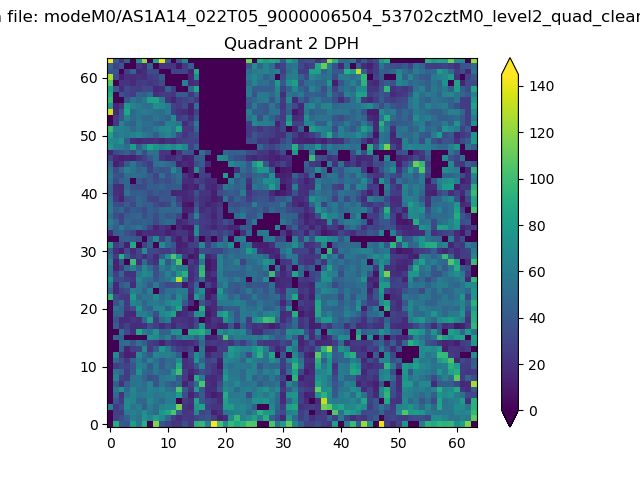
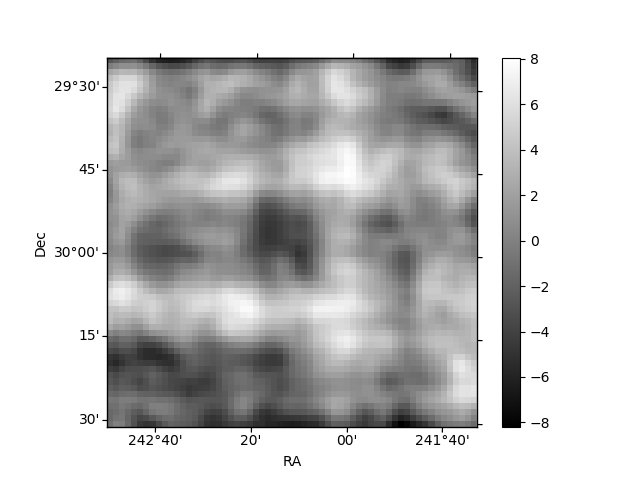
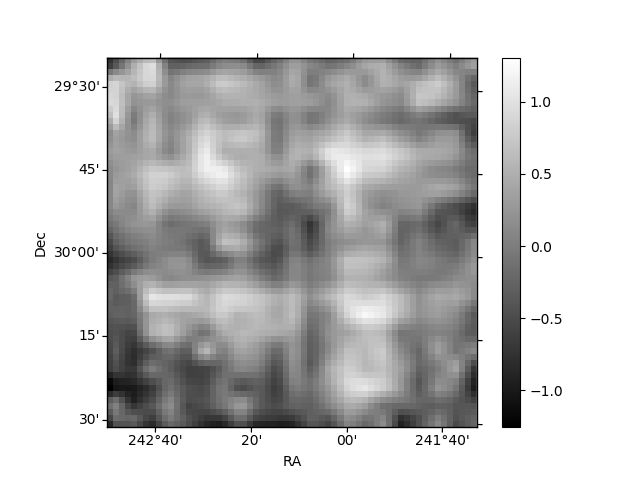
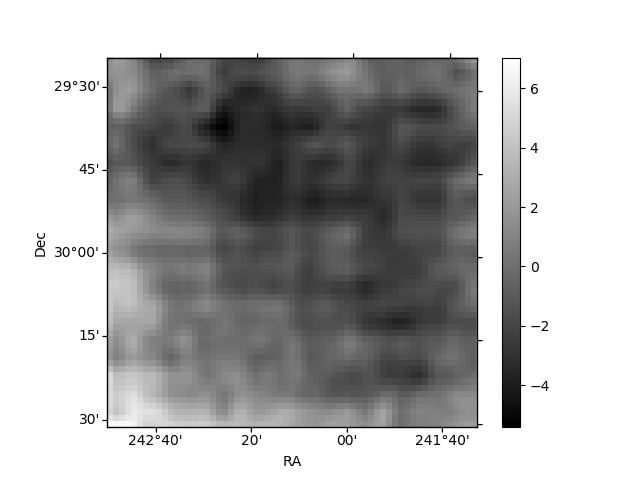
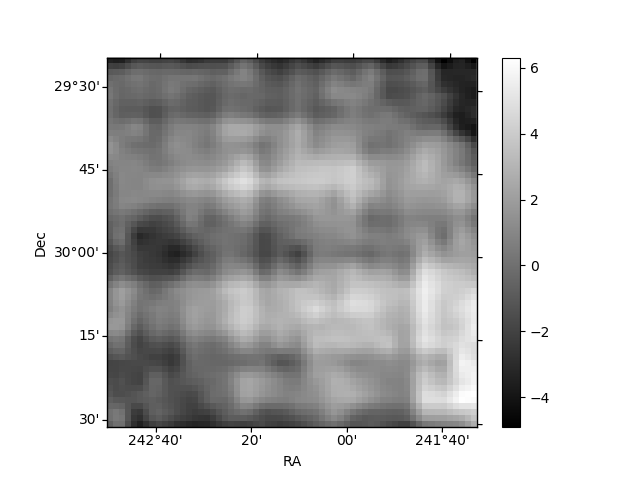
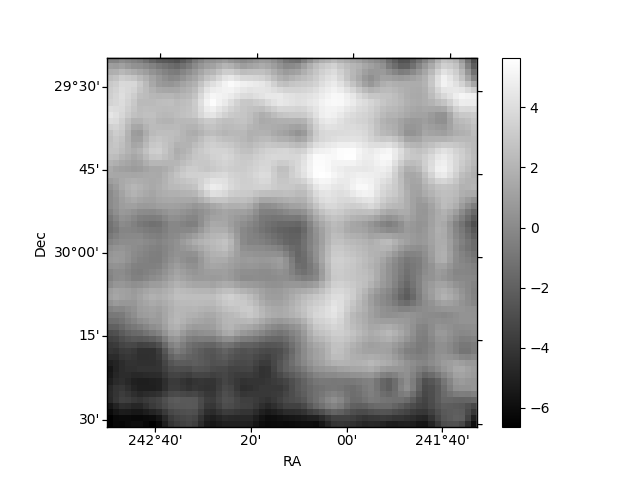
Histogram calculated using DETX and DETY for each event in the final _common_clean file
| Quadrant A | 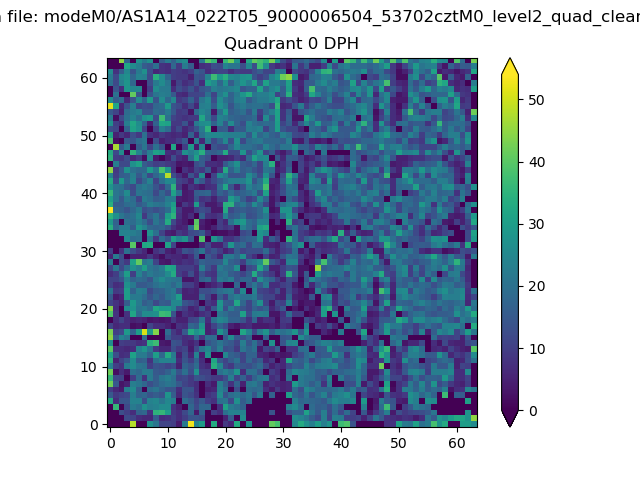 |
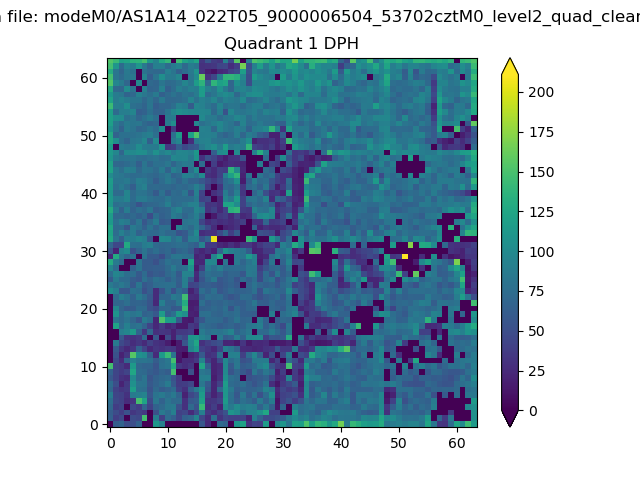 |
Quadrant B |
|---|---|---|---|
| Quadrant D | 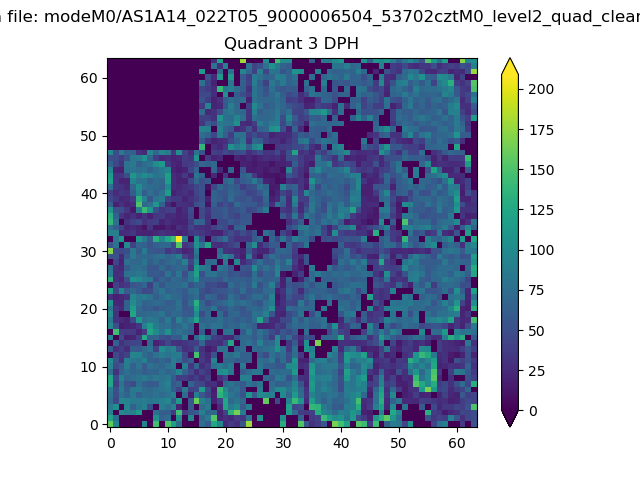 |
 |
Quadrant C |
| Plot type | Count rate plots | Images |
|---|---|---|
| Comparison with Poisson distribution Blue bars denote a histogram of data divided into 1 sec bins. Red curve is a Poisson curve with rate = median count rate of data. |
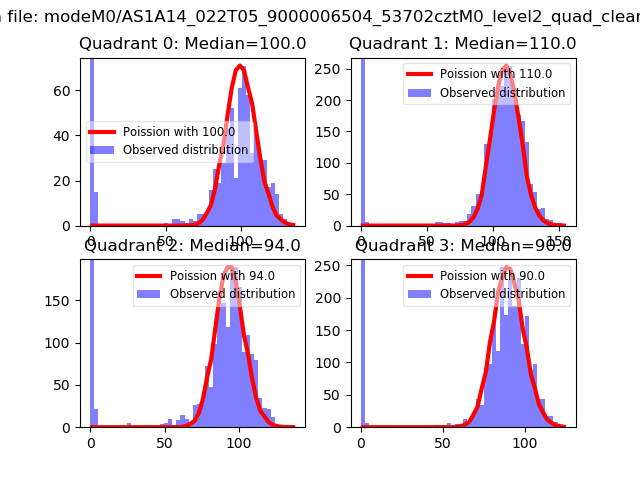 |
 |
| Quadrant-wise count rates Data is divided into 100 sec bins |
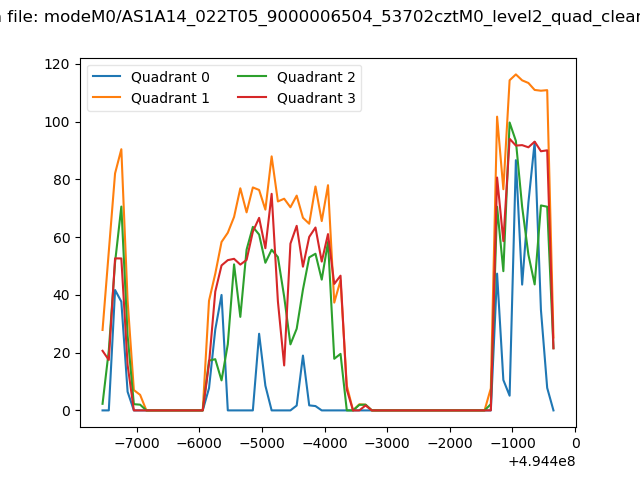 |
|
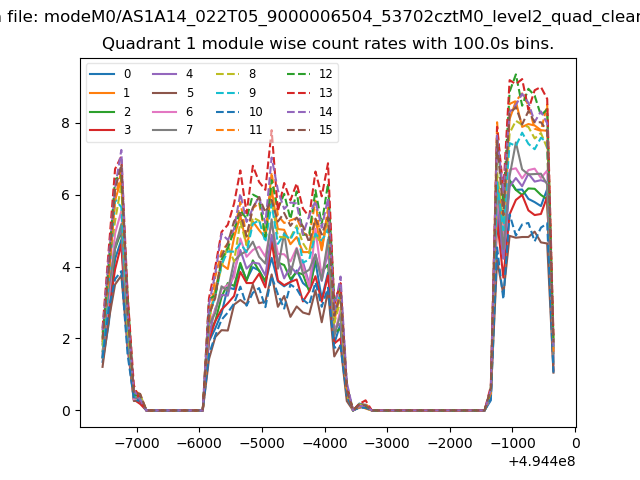
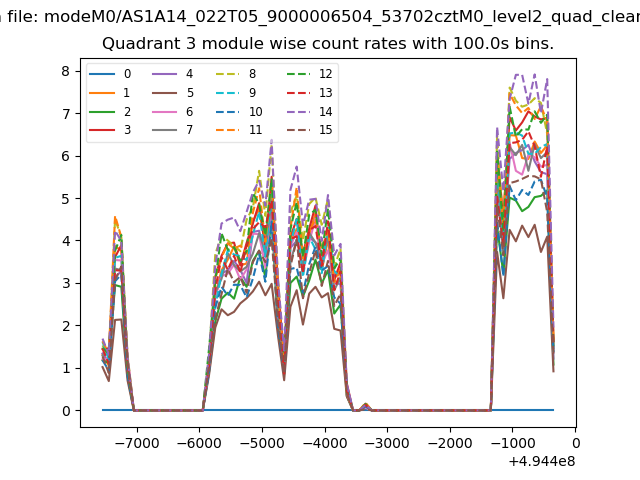
| Module-wise count rates for Quadrant A Data is divided into 100 sec bins |
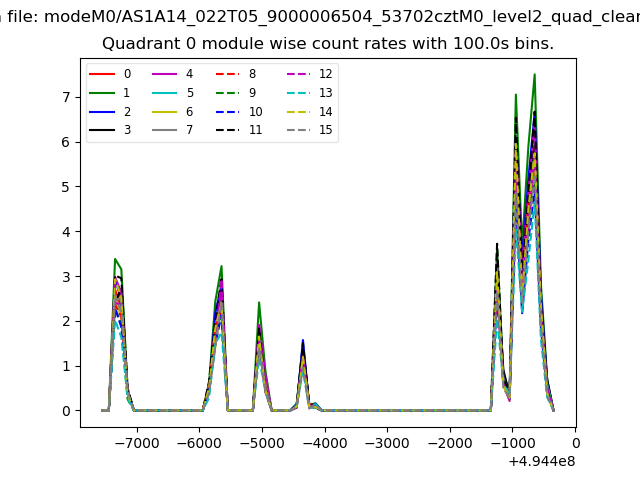 |
 |
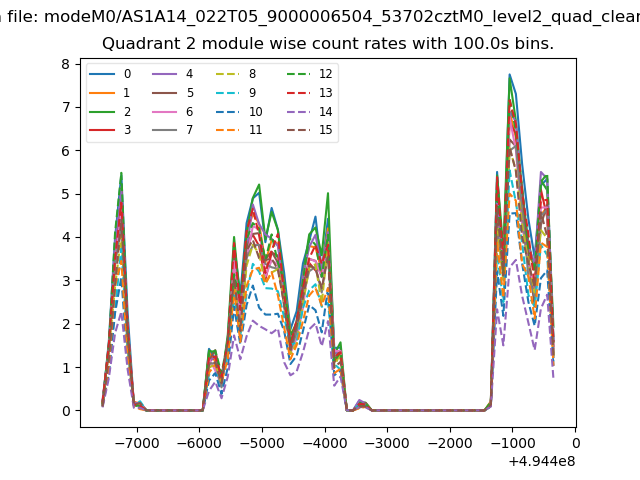
| Module-wise count rates for Quadrant B Data is divided into 100 sec bins |
 |
 |
| Module-wise count rates for Quadrant C Data is divided into 100 sec bins |
 |
 |
| Module-wise count rates for Quadrant D Data is divided into 100 sec bins |
 |
 |
| Parameter | Plot |
|---|---|
| CZT HV Monitor | 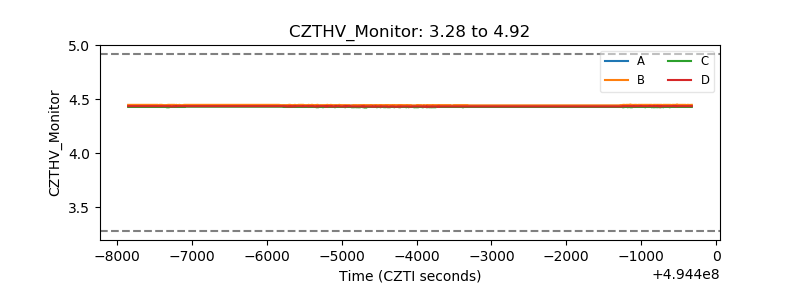 |
| D_VDD | 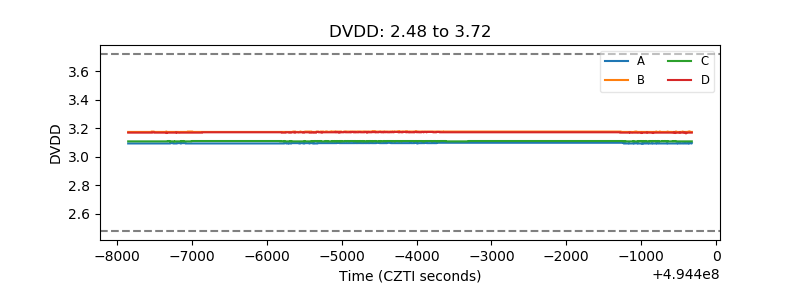 |
| Temperature 1 | 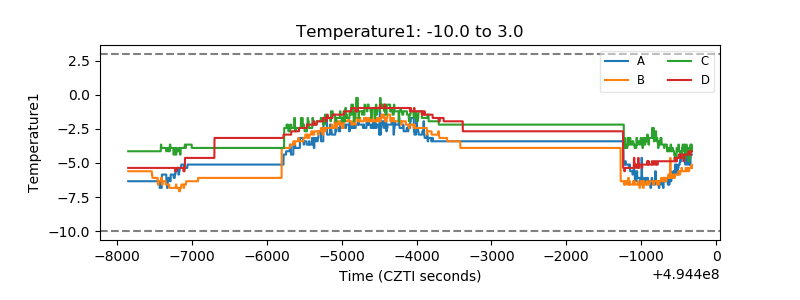 |
| Veto HV Monitor | 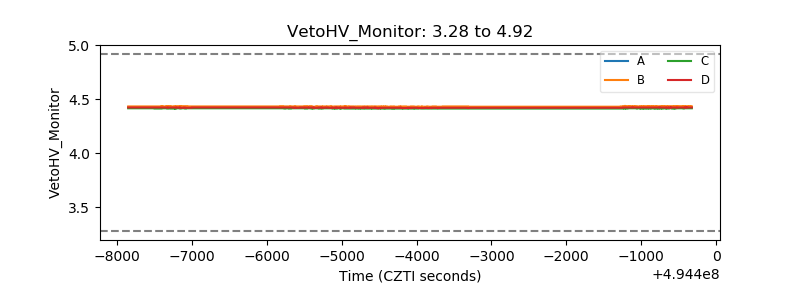 |
| Veto LLD | 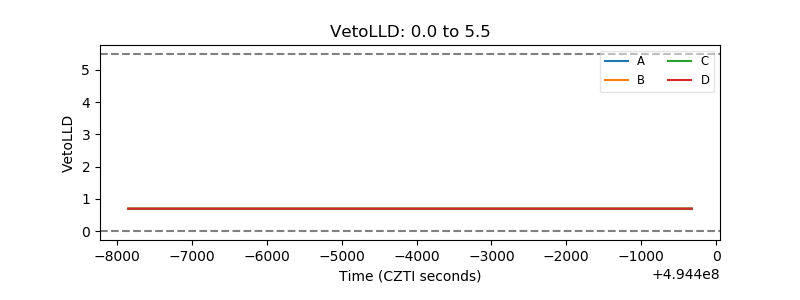 |
| Alpha Counter | 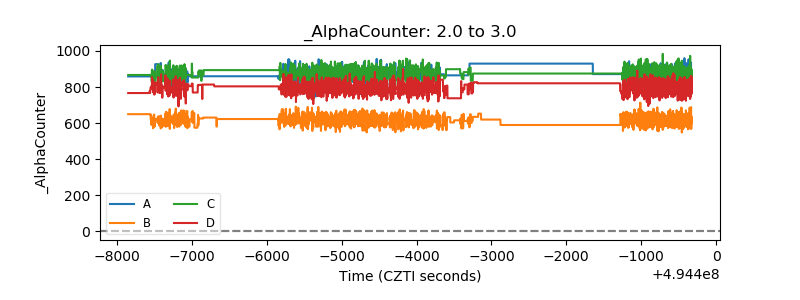 |
| _CPM_Rate | 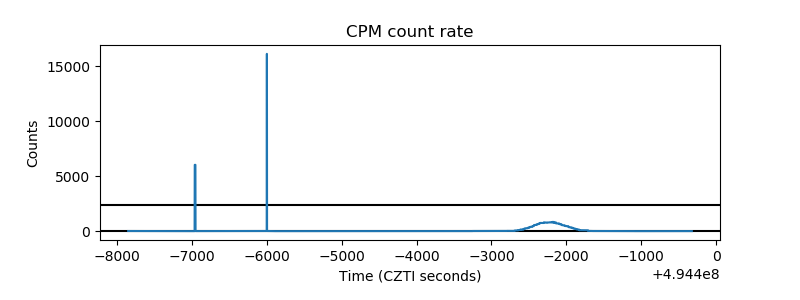 |
| CZT Counter | 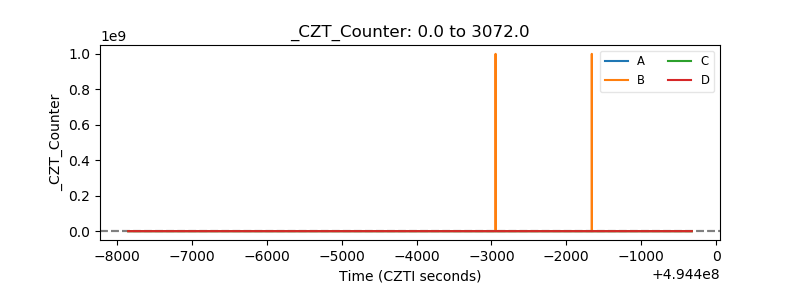 |
| +2.5 Volts monitor |  |
| +5 Volts monitor | 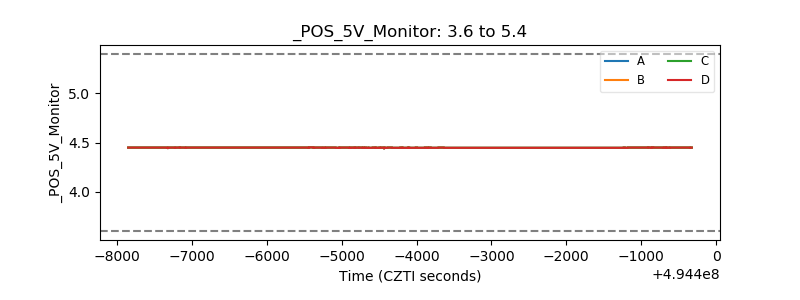 |
| _ROLL_ROT | 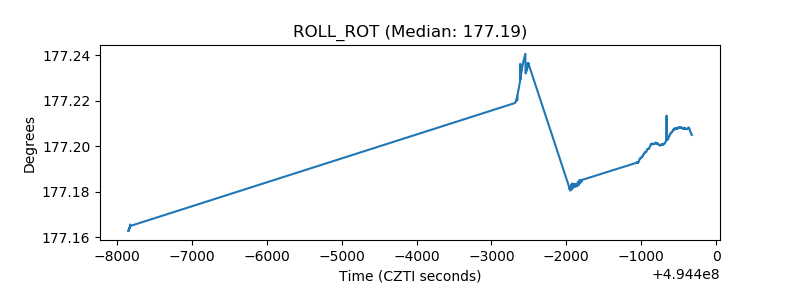 |
| _Roll_DEC | 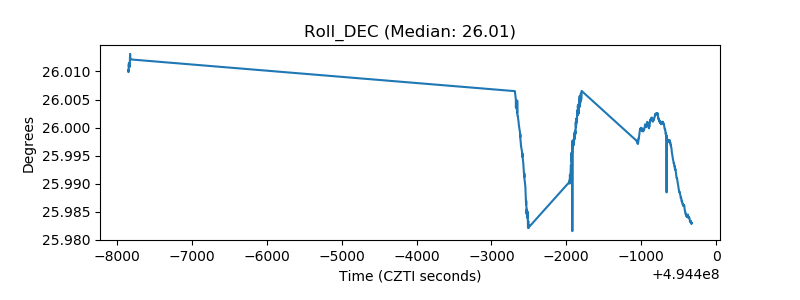 |
| _Roll_RA |  |
| Veto Counter | 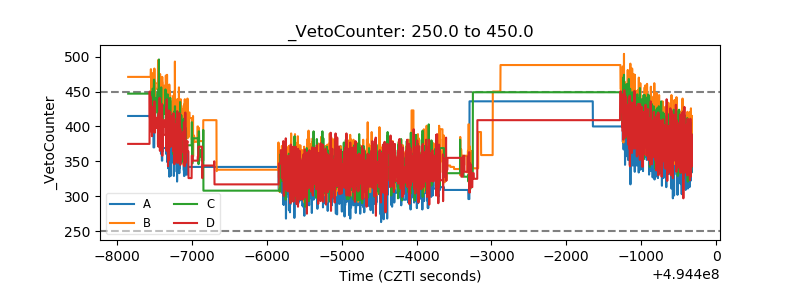 |