| Param | Original file | Final file |
|---|---|---|
| Filename | modeM0/AS1A14_022T05_9000006504_53703cztM0_level2.fits | modeM0/AS1A14_022T05_9000006504_53703cztM0_level2_quad_clean.evt |
| Size (bytes) | 2,771,838,720 | 226,051,200 |
| Size | 2.6 GB | 215.6 MB |
| Events in quadrant A | 43,515,492 | 622,572 |
| Events in quadrant B | 11,583,934 | 2,009,961 |
| Events in quadrant C | 31,727,700 | 1,176,846 |
| Events in quadrant D | 14,224,691 | 1,641,541 |
| Mode SS | |||
|---|---|---|---|
| Quadrant | BADHDUFLAG | Total packets | Discarded packets |
| A | 0 | 436 | 16 |
| B | 0 | 436 | 14 |
| C | 0 | 436 | 10 |
| D | 0 | 436 | 16 |
| Mode M9 | |||
|---|---|---|---|
| Quadrant | BADHDUFLAG | Total packets | Discarded packets |
| A | 0 | 44 | 7 |
| B | 0 | 44 | 4 |
| C | 0 | 44 | 7 |
| D | 0 | 44 | 5 |
| Mode M0 | |||
|---|---|---|---|
| Quadrant | BADHDUFLAG | Total packets | Discarded packets |
| A | 0 | 155454 | 12582 |
| B | 0 | 50821 | 2444 |
| C | 0 | 114665 | 6701 |
| D | 0 | 59217 | 2852 |
| Quadrant | Total seconds | Saturated seconds | Saturation percentage |
|---|---|---|---|
| A | 19726 | 14126 | 71.611072% |
| B | 20433 | 696 | 3.406255% |
| C | 20072 | 7517 | 37.450179% |
| D | 20436 | 998 | 4.883539% |
Noise dominated data is calculated using 1-second bins in cleaned event files. If a bin has >2000 counts, and if more than 50% of those come from <1% of pixels, then it is considered to be noise-dominated and hence unusable.
| Quadrant | # 1 sec bins | Bins with >0 counts | Bins with >2000 counts | High rate bins dominated by noise | Noise dominated (total time) | Noise dominated (detector-on time) | Marked lightcurve |
|---|---|---|---|---|---|---|---|
| A | 25874 | 20278 | 14242 | 14242 | 55.04% | 70.23% | 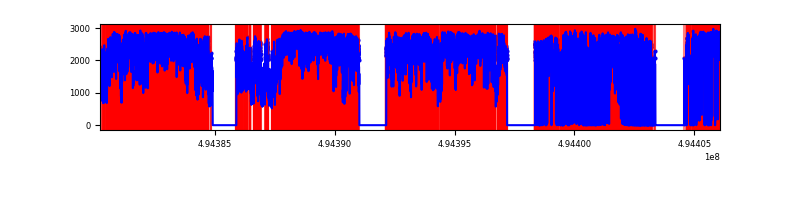 |
| B | 25873 | 20884 | 441 | 441 | 1.70% | 2.11% | 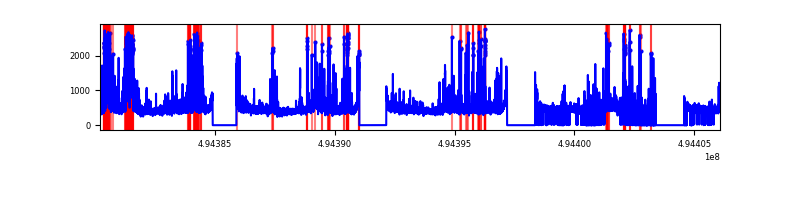 |
| C | 25873 | 20622 | 7520 | 7520 | 29.07% | 36.47% | 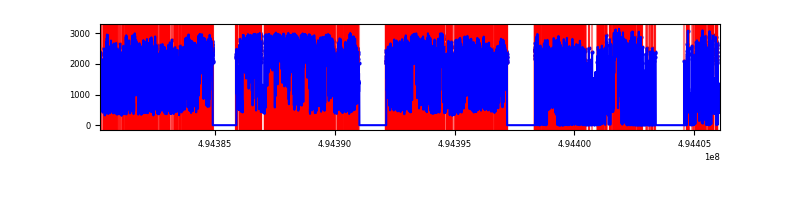 |
| D | 25873 | 20897 | 952 | 952 | 3.68% | 4.56% | 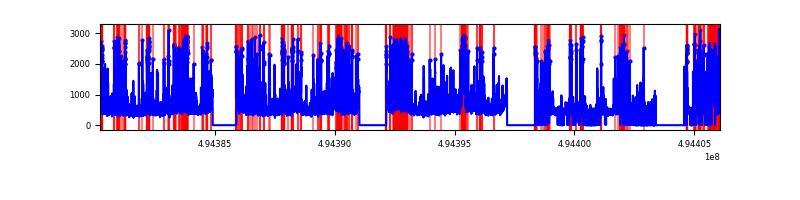 |
Top three noisy pixels from each quadrant. If the there are fewer than three noisy pixels in the level2.evt file, extra rows are filled as -1
| Pixel properties | Quadrant properties | ||||||
|---|---|---|---|---|---|---|---|
| Quadrant | DetID | PixID | Counts | Sigma | Mean | Median | Sigma |
| A | 3 | 63 | 34081261 | 93538.63 | 1478 | 1447 | 364.3 |
| A | 3 | 78 | 1973154 | 5411.73 | 1478 | 1447 | 364.3 |
| A | 14 | 254 | 858917 | 2353.49 | 1478 | 1447 | 364.3 |
| B | 5 | 185 | 1836942 | 3934.81 | 2203 | 2128 | 466.3 |
| B | 10 | 254 | 239786 | 509.66 | 2203 | 2128 | 466.3 |
| B | 7 | 0 | 214930 | 456.36 | 2203 | 2128 | 466.3 |
| C | 1 | 241 | 10768673 | 22833.17 | 1717 | 1705 | 471.5 |
| C | 15 | 224 | 9890724 | 20971.33 | 1717 | 1705 | 471.5 |
| C | 13 | 3 | 1017567 | 2154.31 | 1717 | 1705 | 471.5 |
| D | 1 | 241 | 1572903 | 2573.68 | 2130 | 2043 | 610.4 |
| D | 7 | 70 | 994540 | 1626.1 | 2130 | 2043 | 610.4 |
| D | 2 | 120 | 497057 | 811.03 | 2130 | 2043 | 610.4 |
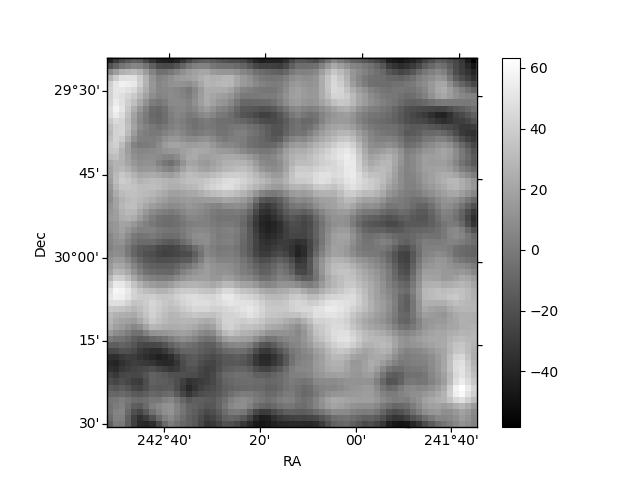
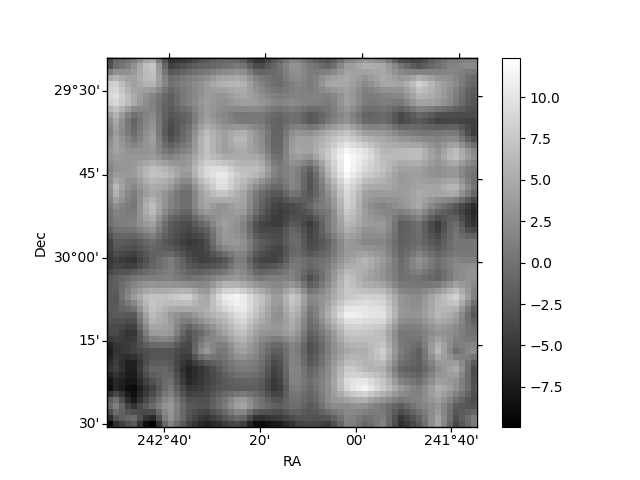
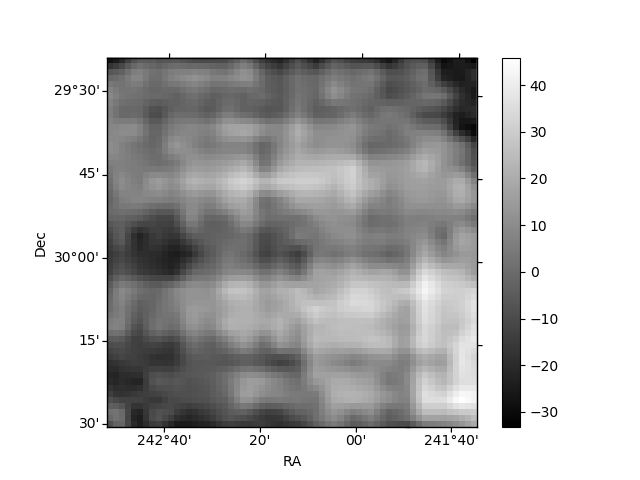
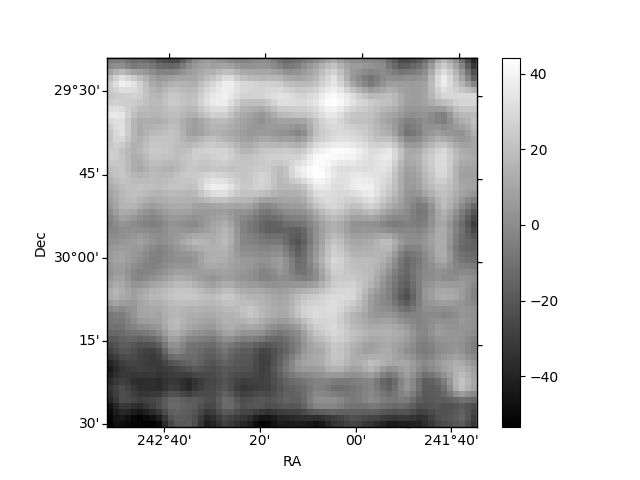
Histogram calculated using DETX and DETY for each event in the final _common_clean file
| Quadrant A | 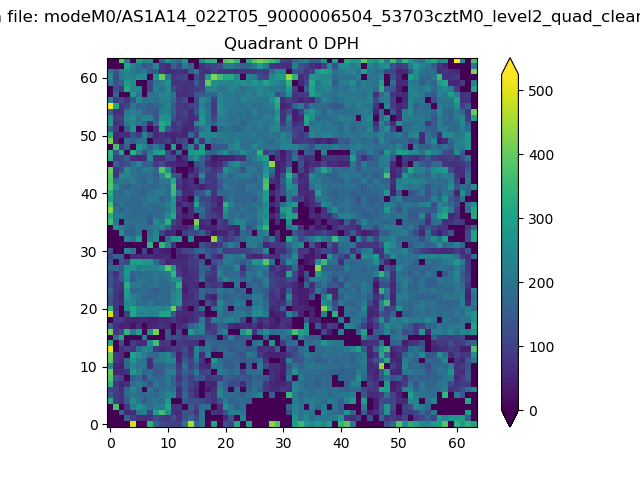 |
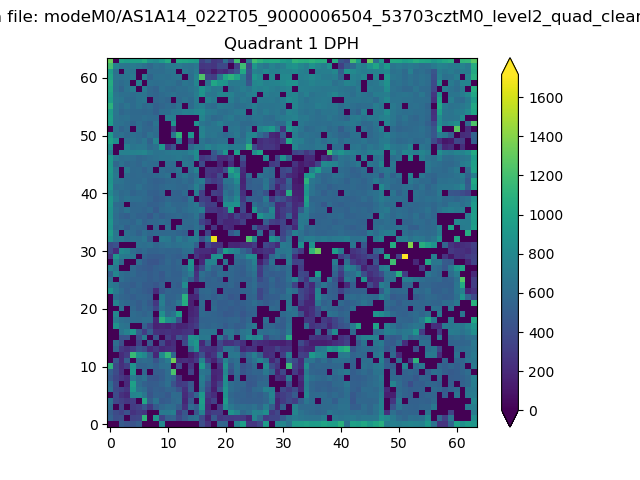 |
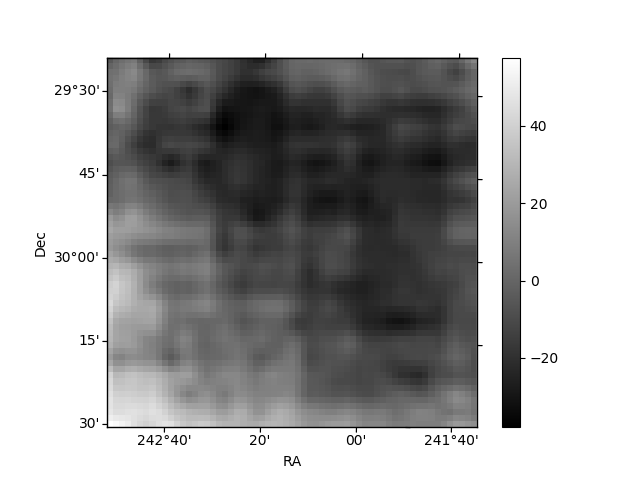
Quadrant B |
|---|---|---|---|
| Quadrant D | 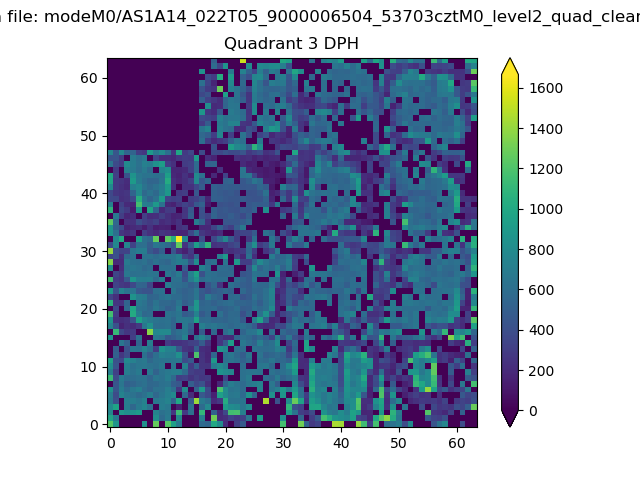 |
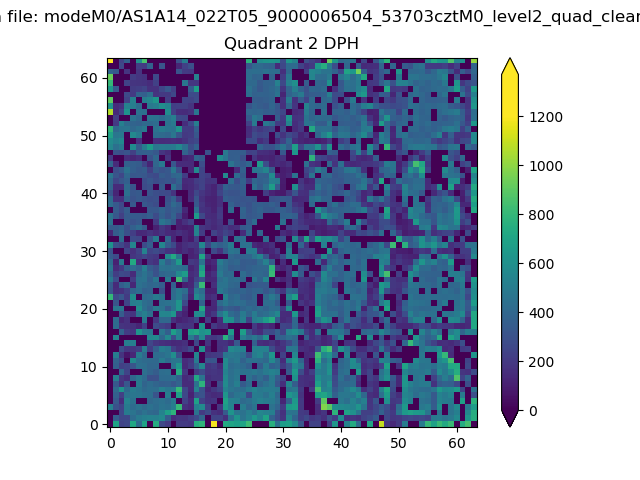 |
Quadrant C |
| Plot type | Count rate plots | Images |
|---|---|---|
| Comparison with Poisson distribution Blue bars denote a histogram of data divided into 1 sec bins. Red curve is a Poisson curve with rate = median count rate of data. |
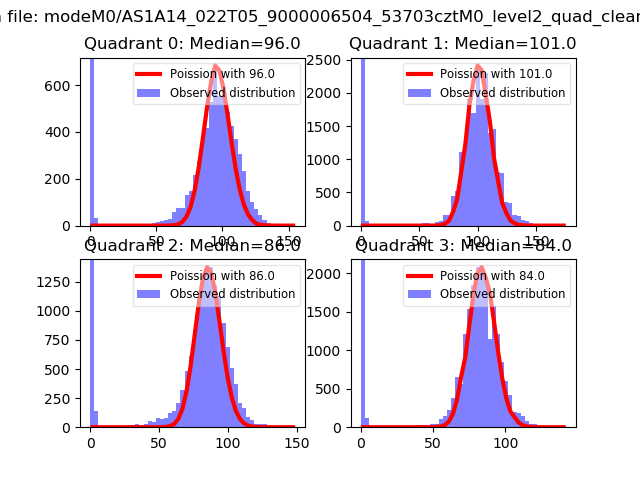 |
 |
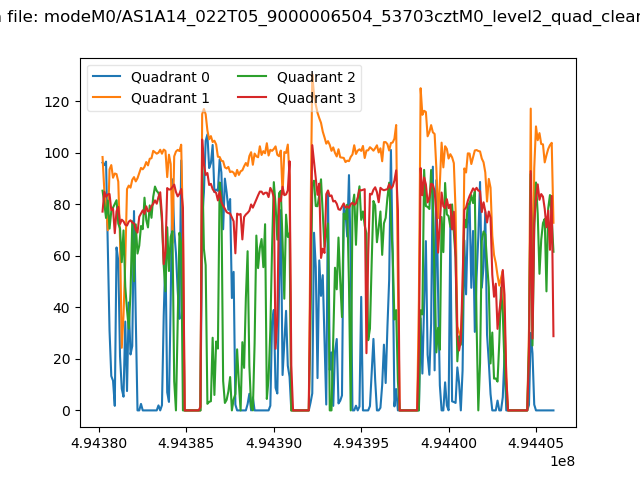
| Quadrant-wise count rates Data is divided into 100 sec bins |
 |
|
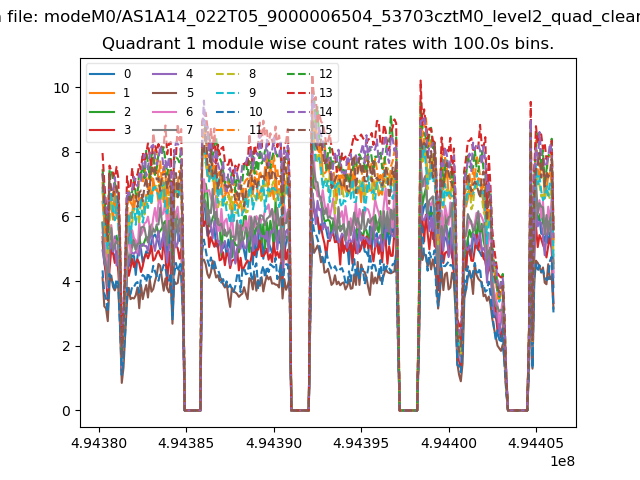
| Module-wise count rates for Quadrant A Data is divided into 100 sec bins |
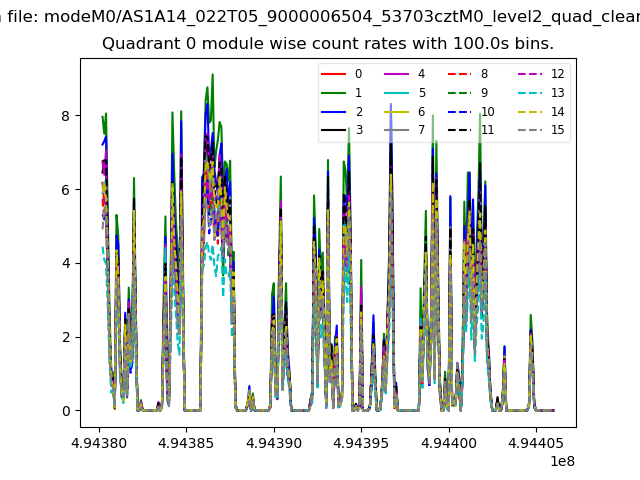 |
 |
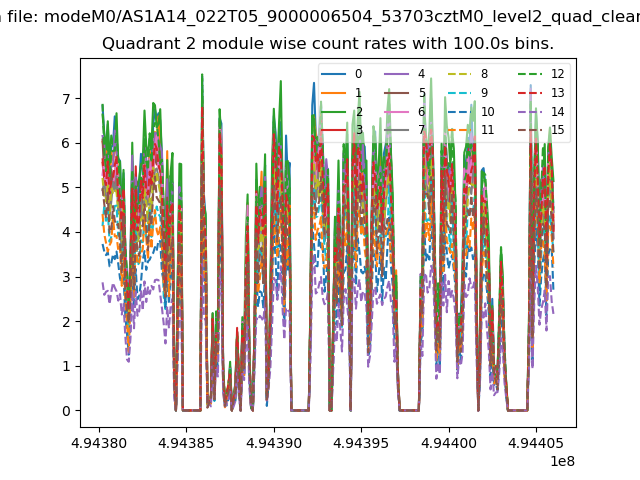
| Module-wise count rates for Quadrant B Data is divided into 100 sec bins |
 |
 |
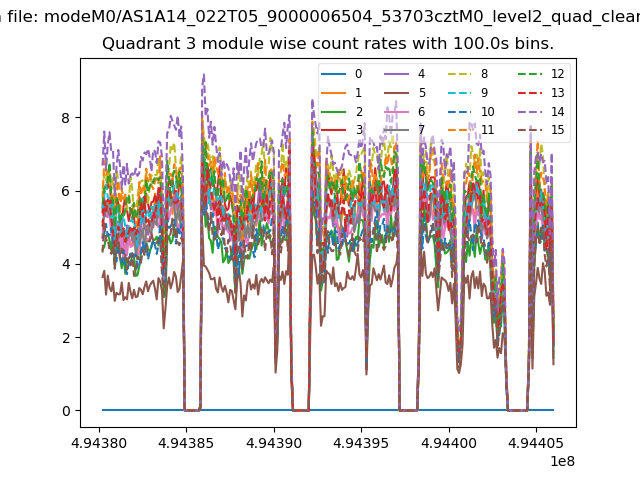
| Module-wise count rates for Quadrant C Data is divided into 100 sec bins |
 |
 |
| Module-wise count rates for Quadrant D Data is divided into 100 sec bins |
 |
 |
| Parameter | Plot |
|---|---|
| CZT HV Monitor | 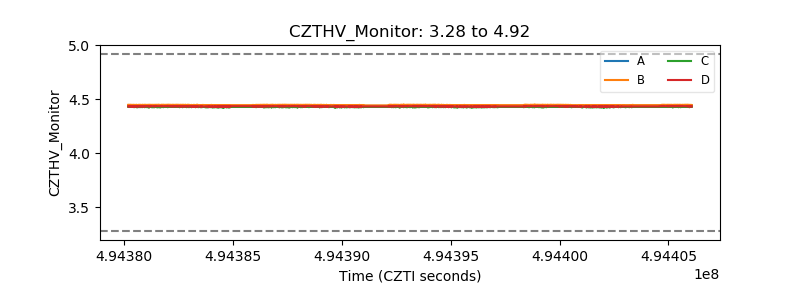 |
| D_VDD | 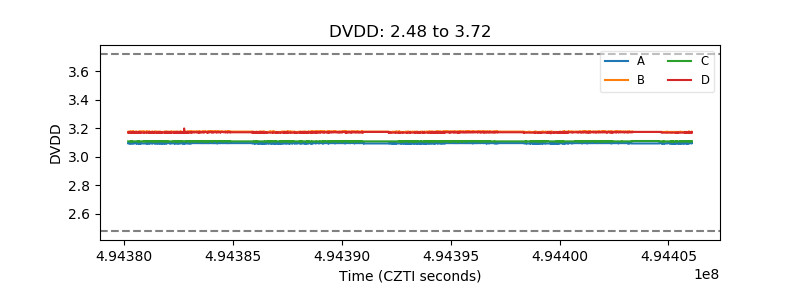 |
| Temperature 1 | 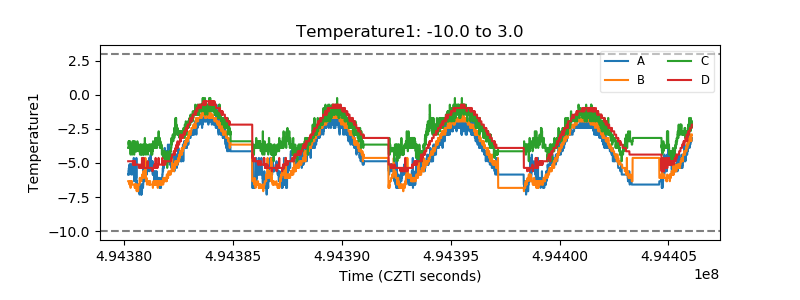 |
| Veto HV Monitor | 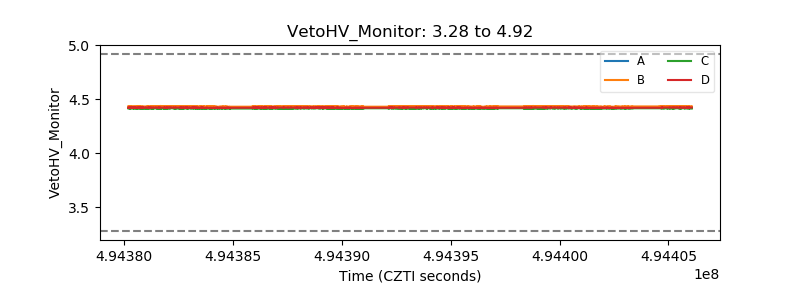 |
| Veto LLD | 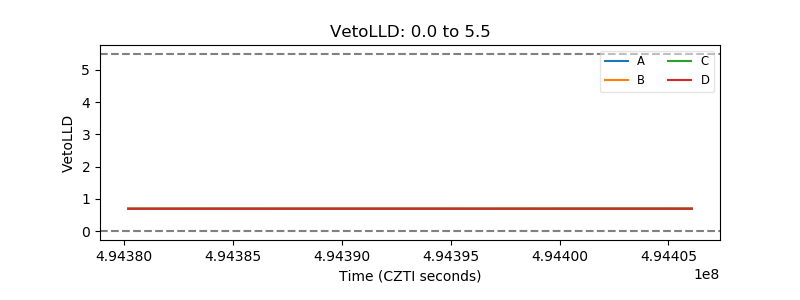 |
| Alpha Counter | 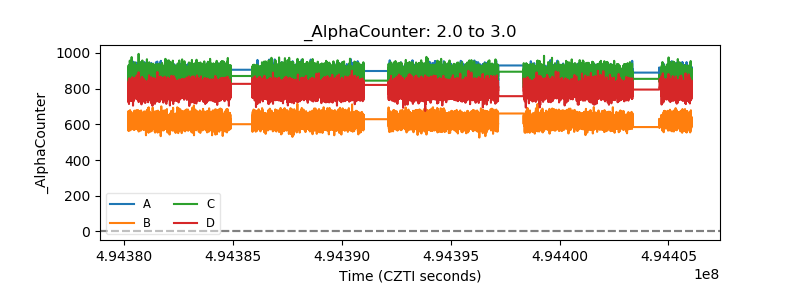 |
| _CPM_Rate | 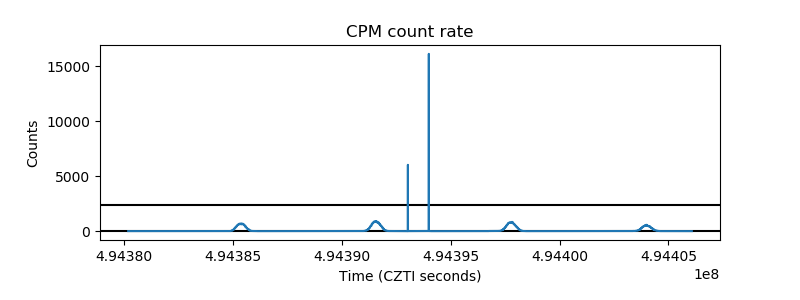 |
| CZT Counter | 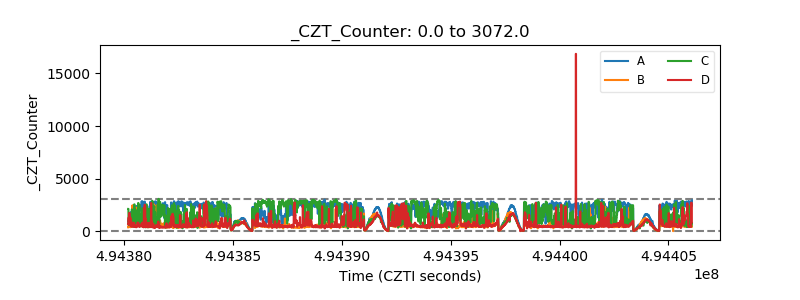 |
| +2.5 Volts monitor | 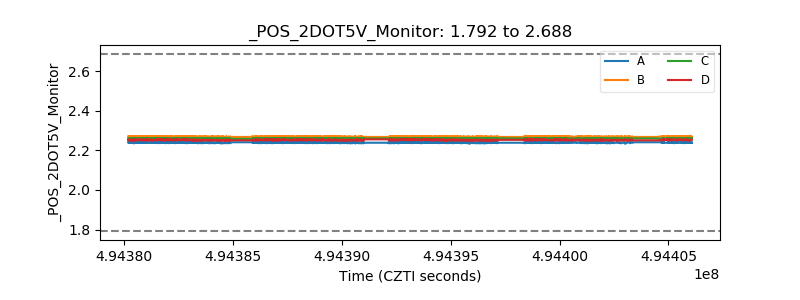 |
| +5 Volts monitor | 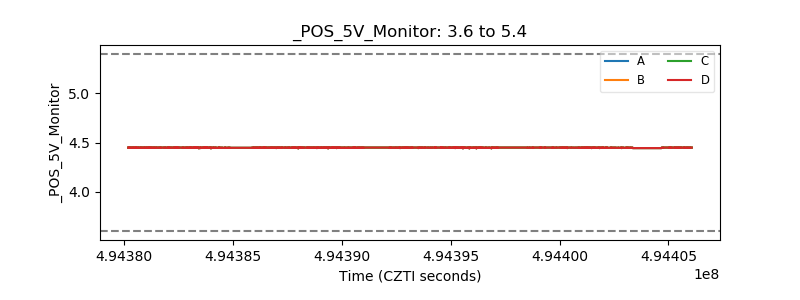 |
| _ROLL_ROT | 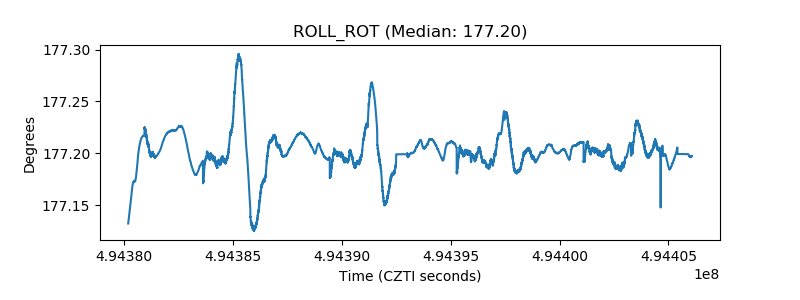 |
| _Roll_DEC | 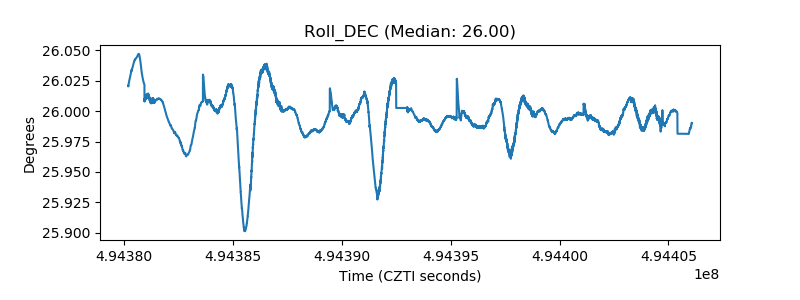 |
| _Roll_RA | 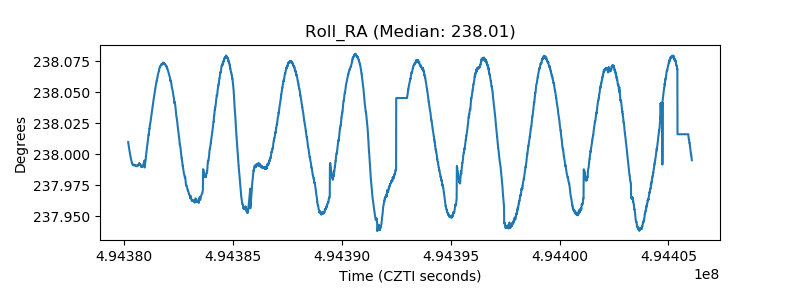 |
| Veto Counter | 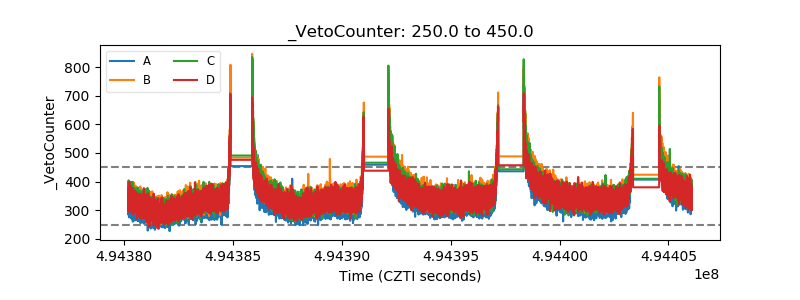 |