| Param | Original file | Final file |
|---|---|---|
| Filename | modeM0/AS1A14_022T04_9000006506cztM0_level2.fits | modeM0/AS1A14_022T04_9000006506cztM0_level2_quad_clean.evt |
| Size (bytes) | 4,290,566,400 | 1,714,317,120 |
| Size | 4.0 GB | 1.6 GB |
| Events in quadrant A | 14,614,496 | 1,282,375 |
| Events in quadrant B | 27,983,310 | 3,957,611 |
| Events in quadrant C | 24,213,384 | 2,858,029 |
| Events in quadrant D | 21,547,240 | 2,558,134 |
| Mode M0 | |||
|---|---|---|---|
| Quadrant | BADHDUFLAG | Total packets | Discarded packets |
| A | 0 | 4171865 | 0 |
| B | 0 | 1409005 | 0 |
| C | 0 | 2652989 | 0 |
| D | 0 | 2414408 | 0 |
| Mode SS | |||
|---|---|---|---|
| Quadrant | BADHDUFLAG | Total packets | Discarded packets |
| A | 0 | 12294 | 0 |
| B | 0 | 12298 | 0 |
| C | 0 | 12296 | 0 |
| D | 0 | 12296 | 0 |
| Mode M9 | |||
|---|---|---|---|
| Quadrant | BADHDUFLAG | Total packets | Discarded packets |
| A | 0 | 705 | 0 |
| B | 0 | 705 | 0 |
| C | 0 | 705 | 0 |
| D | 0 | 705 | 0 |
| Quadrant | Total seconds | Saturated seconds | Saturation percentage |
|---|---|---|---|
| A | 601356 | 444228 | 73.871051% |
| B | 601752 | 18366 | 3.052088% |
| C | 601657 | 155822 | 25.898809% |
| D | 601594 | 128129 | 21.298251% |
Noise dominated data is calculated using 1-second bins in cleaned event files. If a bin has >2000 counts, and if more than 50% of those come from <1% of pixels, then it is considered to be noise-dominated and hence unusable.
| Quadrant | # 1 sec bins | Bins with >0 counts | Bins with >2000 counts | High rate bins dominated by noise | Noise dominated (total time) | Noise dominated (detector-on time) | Marked lightcurve |
|---|---|---|---|---|---|---|---|
| A | 690877 | 565705 | 0 | 0 | 0.00% | 0.00% | 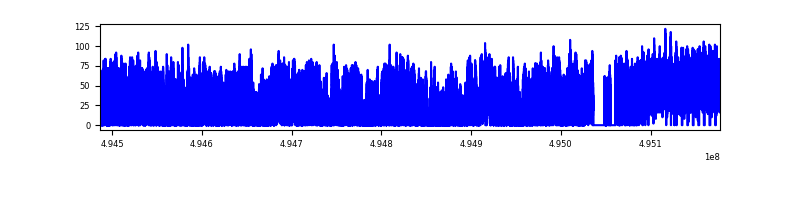 |
| B | 690878 | 601794 | 0 | 0 | 0.00% | 0.00% | 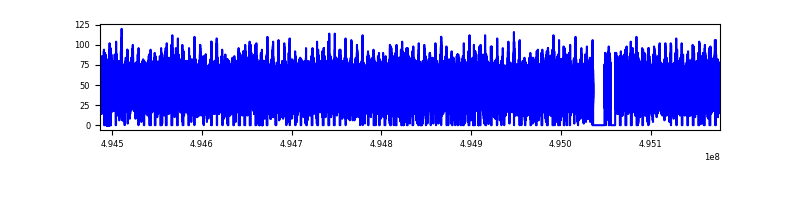 |
| C | 690878 | 597727 | 0 | 0 | 0.00% | 0.00% | 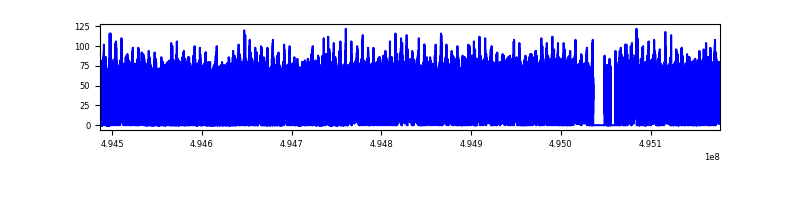 |
| D | 690875 | 588699 | 0 | 0 | 0.00% | 0.00% | 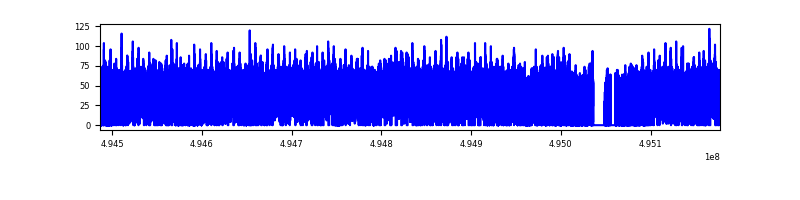 |
Top three noisy pixels from each quadrant. If the there are fewer than three noisy pixels in the level2.evt file, extra rows are filled as -1
| Pixel properties | Quadrant properties | ||||||
|---|---|---|---|---|---|---|---|
| Quadrant | DetID | PixID | Counts | Sigma | Mean | Median | Sigma |
| A | 14 | 188 | 16703 | 10.18 | 3857 | 3562 | 1290.3 |
| A | 9 | 255 | 15248 | 9.06 | 3857 | 3562 | 1290.3 |
| A | 14 | 204 | 13541 | 7.73 | 3857 | 3562 | 1290.3 |
| B | 2 | 9 | 32331 | 14.75 | 7417 | 7015 | 1716.4 |
| B | 2 | 8 | 28768 | 12.67 | 7417 | 7015 | 1716.4 |
| B | 3 | 25 | 23379 | 9.53 | 7417 | 7015 | 1716.4 |
| C | 2 | 31 | 19452 | 6.08 | 6509 | 5915 | 2226.7 |
| C | 3 | 203 | 18843 | 5.81 | 6509 | 5915 | 2226.7 |
| C | 7 | 221 | 18722 | 5.75 | 6509 | 5915 | 2226.7 |
| D | 6 | 218 | 27815 | 10.9 | 6189 | 5496 | 2047.3 |
| D | 15 | 11 | 21316 | 7.73 | 6189 | 5496 | 2047.3 |
| D | 3 | 30 | 19747 | 6.96 | 6189 | 5496 | 2047.3 |
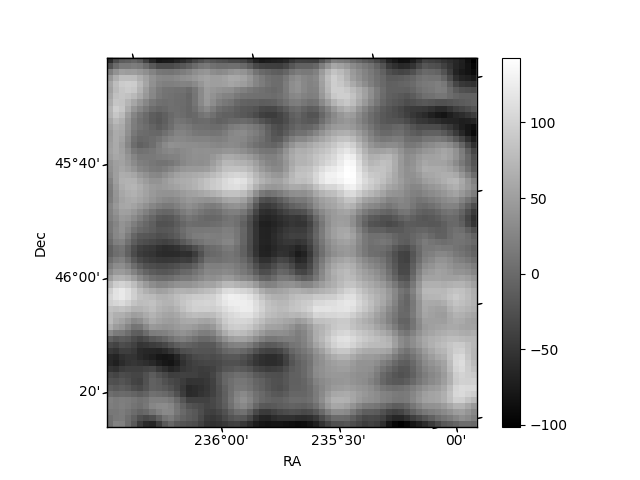
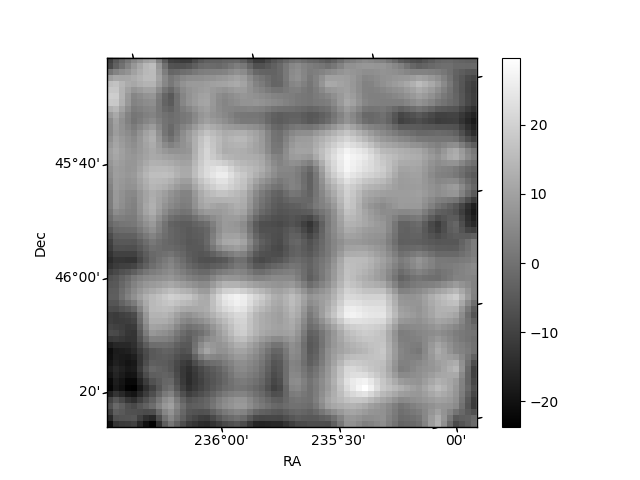
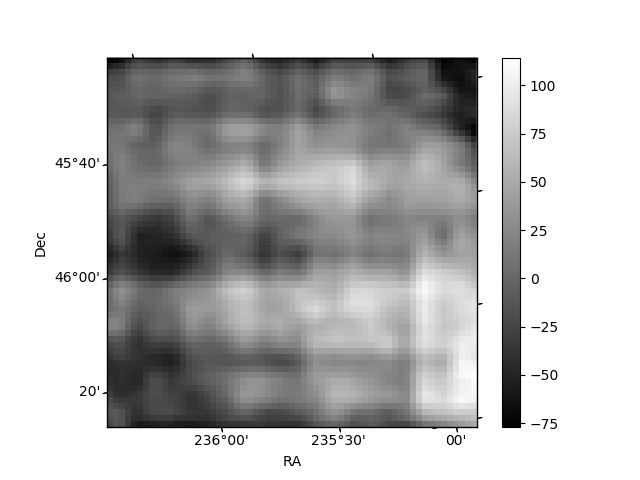
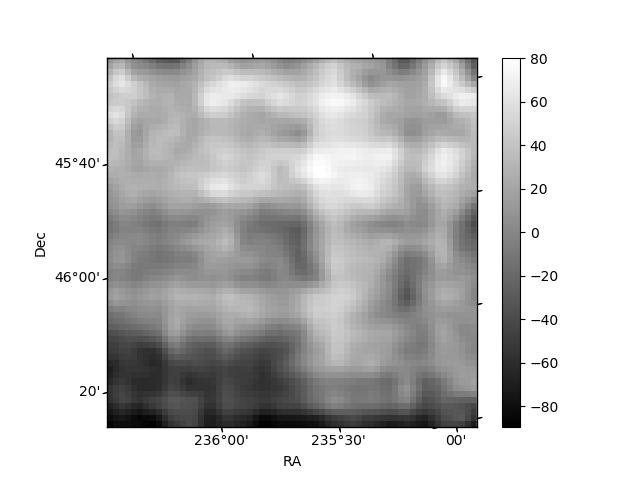
Histogram calculated using DETX and DETY for each event in the final _common_clean file
| Quadrant A | 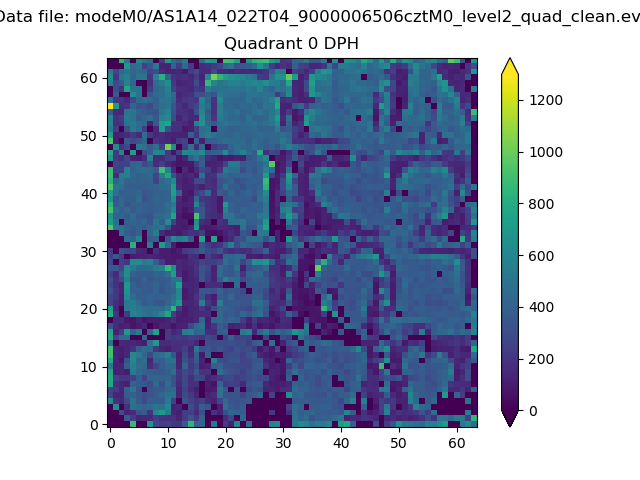 |
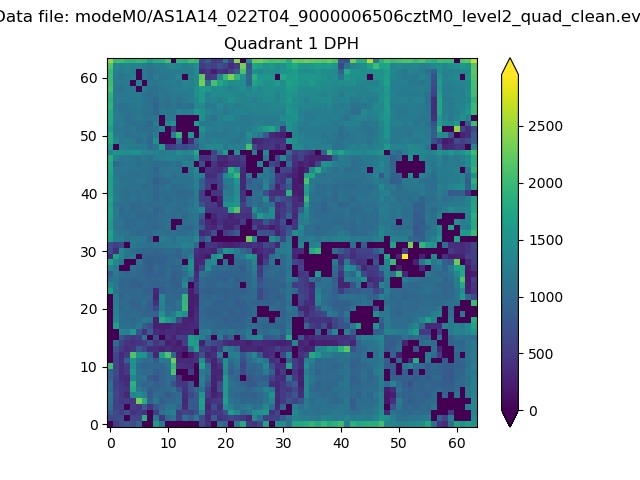 |
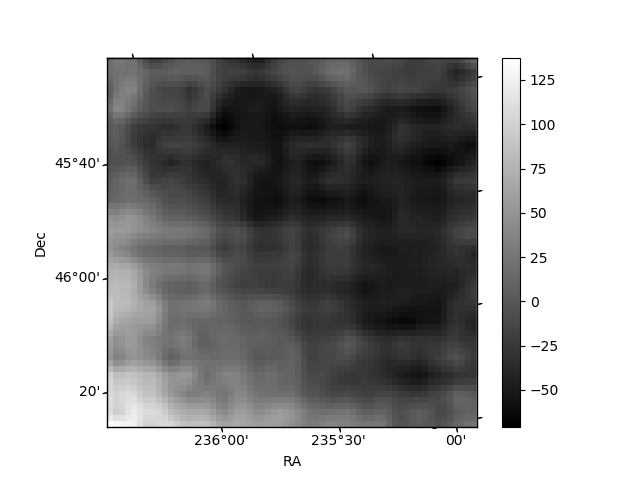
Quadrant B |
|---|---|---|---|
| Quadrant D | 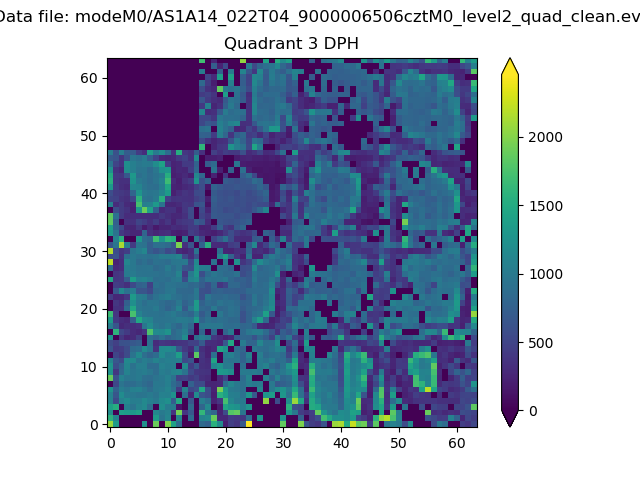 |
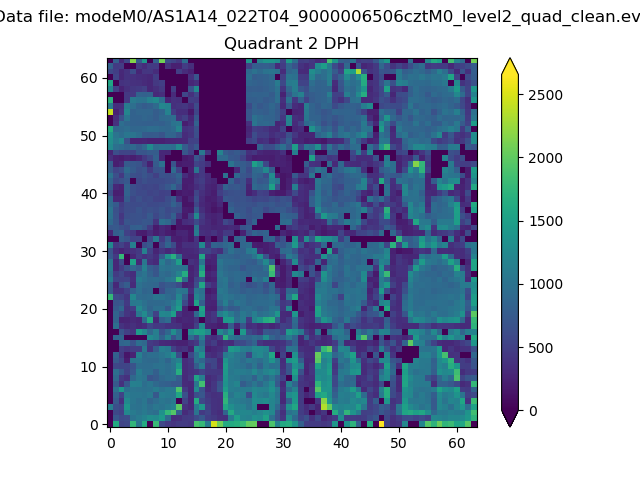 |
Quadrant C |
| Plot type | Count rate plots | Images |
|---|---|---|
| Comparison with Poisson distribution Blue bars denote a histogram of data divided into 1 sec bins. Red curve is a Poisson curve with rate = median count rate of data. |
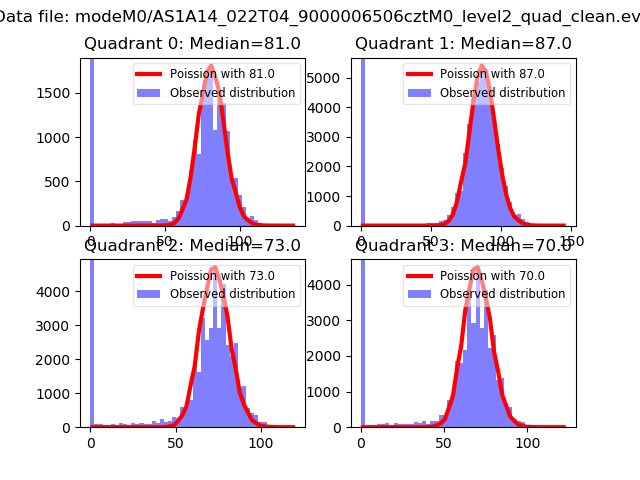 |
 |
| Quadrant-wise count rates Data is divided into 100 sec bins |
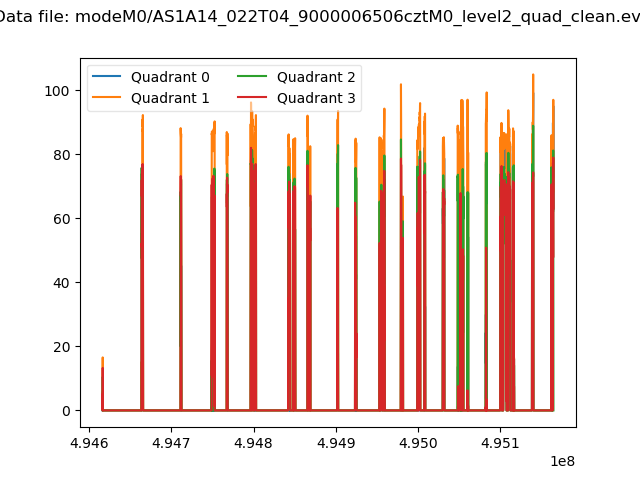 |
|
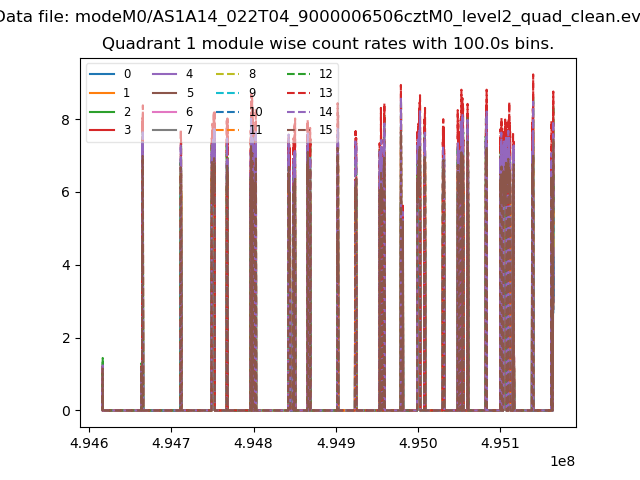
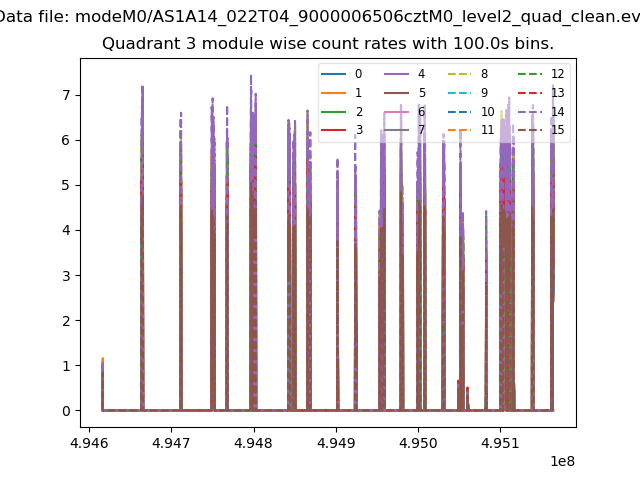
| Module-wise count rates for Quadrant A Data is divided into 100 sec bins |
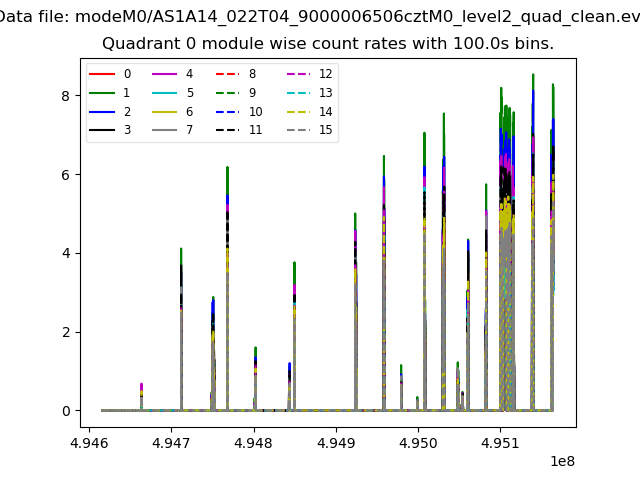 |
 |
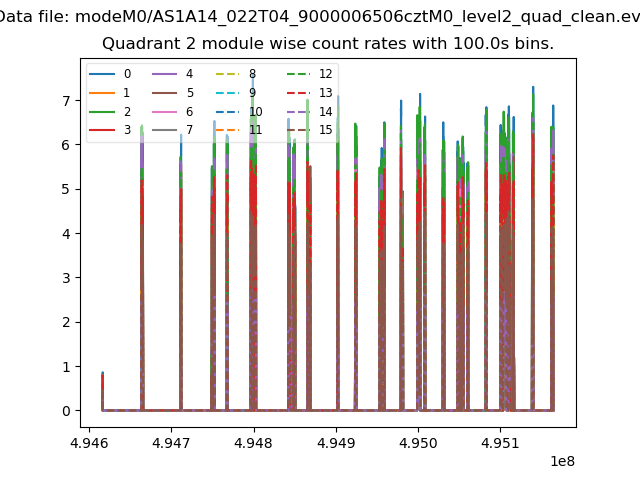
| Module-wise count rates for Quadrant B Data is divided into 100 sec bins |
 |
 |
| Module-wise count rates for Quadrant C Data is divided into 100 sec bins |
 |
 |
| Module-wise count rates for Quadrant D Data is divided into 100 sec bins |
 |
 |
| Parameter | Plot |
|---|---|
| CZT HV Monitor | 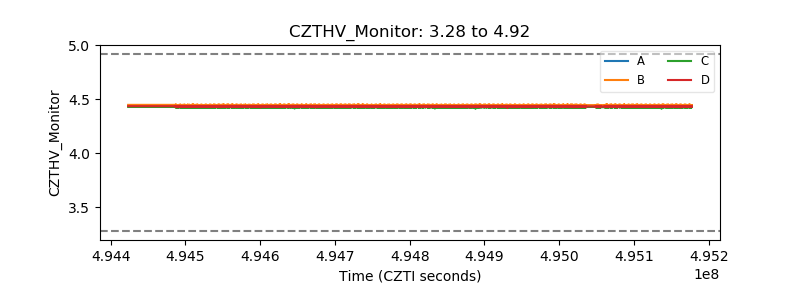 |
| D_VDD | 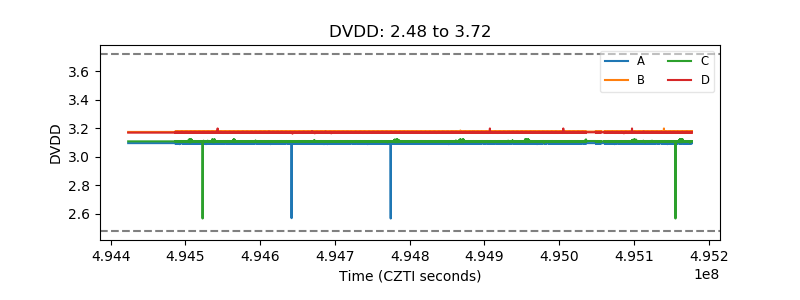 |
| Temperature 1 | 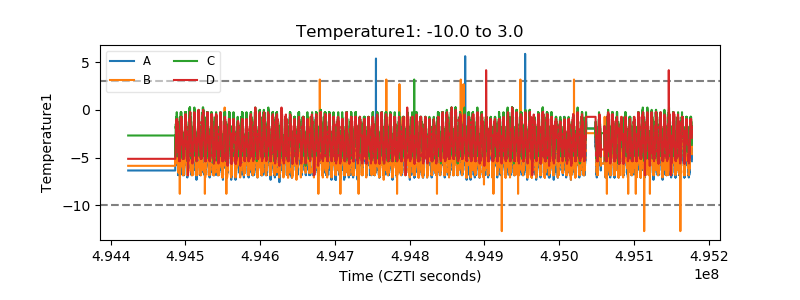 |
| Veto HV Monitor | 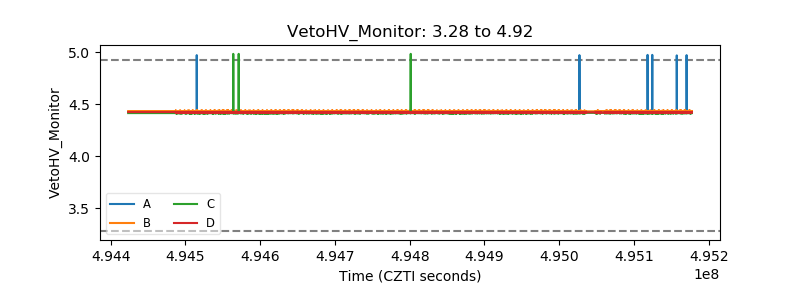 |
| Veto LLD | 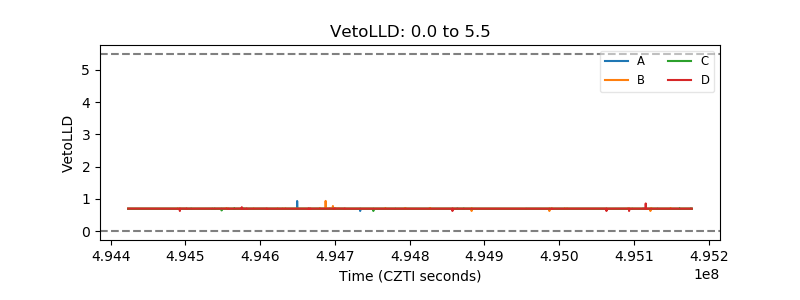 |
| Alpha Counter | 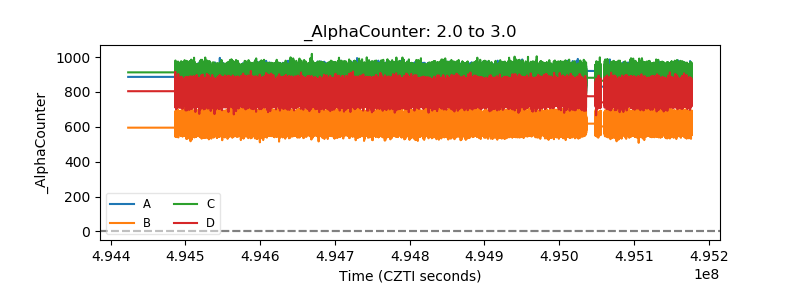 |
| _CPM_Rate | 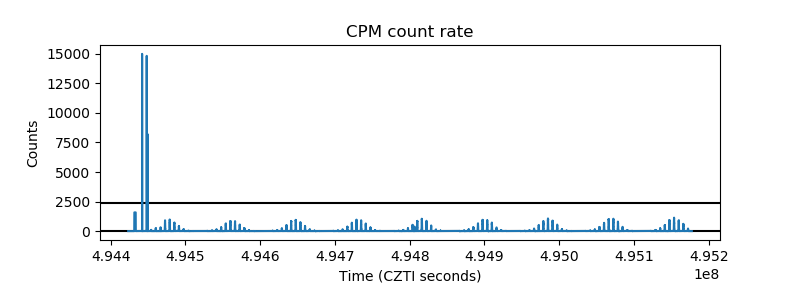 |
| CZT Counter | 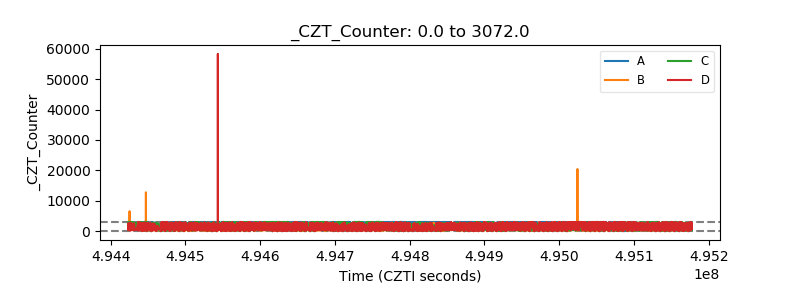 |
| +2.5 Volts monitor | 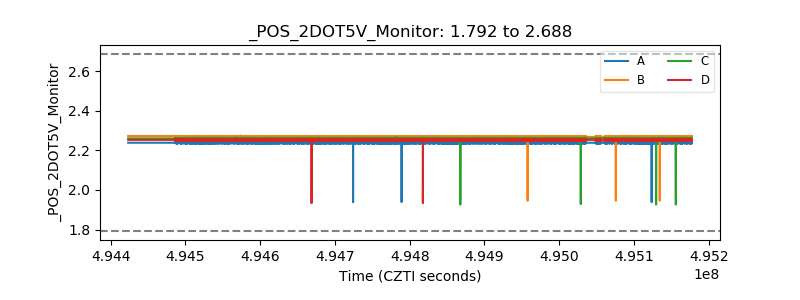 |
| +5 Volts monitor | 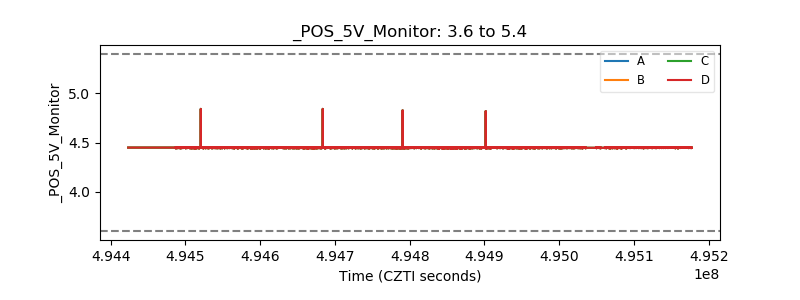 |
| _ROLL_ROT | 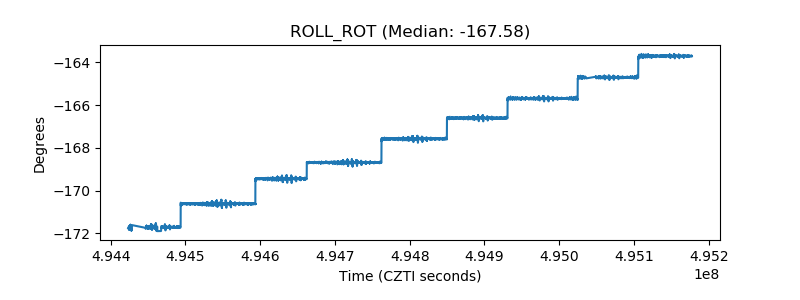 |
| _Roll_DEC | 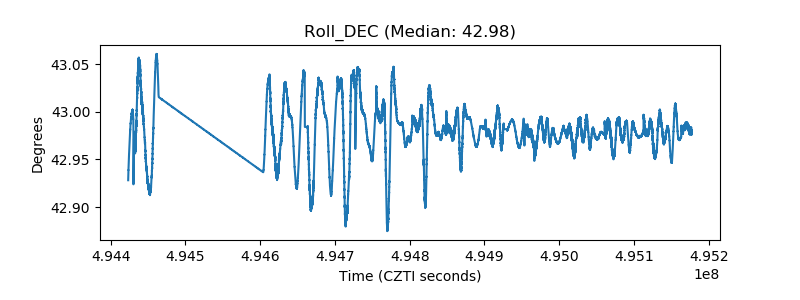 |
| _Roll_RA | 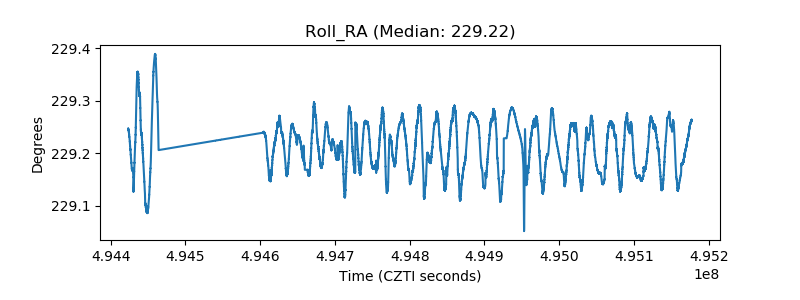 |
| Veto Counter | 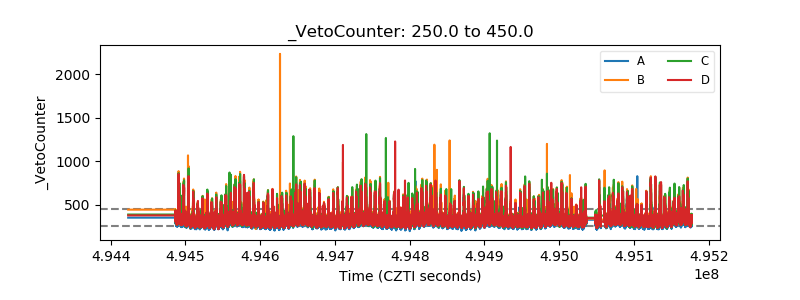 |