| Param | Original file | Final file |
|---|---|---|
| Filename | modeM0/AS1A14_022T04_9000006506_53711cztM0_level2.fits | modeM0/AS1A14_022T04_9000006506_53711cztM0_level2_quad_clean.evt |
| Size (bytes) | 1,432,679,040 | 119,957,760 |
| Size | 1.3 GB | 114.4 MB |
| Events in quadrant A | 19,238,969 | 516,184 |
| Events in quadrant B | 5,722,033 | 1,043,045 |
| Events in quadrant C | 18,950,121 | 487,280 |
| Events in quadrant D | 8,301,994 | 848,954 |
| Mode M0 | |||
|---|---|---|---|
| Quadrant | BADHDUFLAG | Total packets | Discarded packets |
| A | 0 | 64582 | 1 |
| B | 0 | 24565 | 1 |
| C | 0 | 63573 | 7 |
| D | 0 | 32214 | 1 |
| Mode SS | |||
|---|---|---|---|
| Quadrant | BADHDUFLAG | Total packets | Discarded packets |
| A | 0 | 214 | 0 |
| B | 0 | 214 | 0 |
| C | 0 | 214 | 0 |
| D | 0 | 214 | 0 |
| Mode M9 | |||
|---|---|---|---|
| Quadrant | BADHDUFLAG | Total packets | Discarded packets |
| A | 0 | 2 | 0 |
| B | 0 | 2 | 0 |
| C | 0 | 2 | 0 |
| D | 0 | 2 | 0 |
| Quadrant | Total seconds | Saturated seconds | Saturation percentage |
|---|---|---|---|
| A | 10629 | 5385 | 50.663280% |
| B | 10629 | 132 | 1.241885% |
| C | 10629 | 5405 | 50.851444% |
| D | 10629 | 713 | 6.708063% |
Noise dominated data is calculated using 1-second bins in cleaned event files. If a bin has >2000 counts, and if more than 50% of those come from <1% of pixels, then it is considered to be noise-dominated and hence unusable.
| Quadrant | # 1 sec bins | Bins with >0 counts | Bins with >2000 counts | High rate bins dominated by noise | Noise dominated (total time) | Noise dominated (detector-on time) | Marked lightcurve |
|---|---|---|---|---|---|---|---|
| A | 10809 | 10630 | 4983 | 4983 | 46.10% | 46.88% | 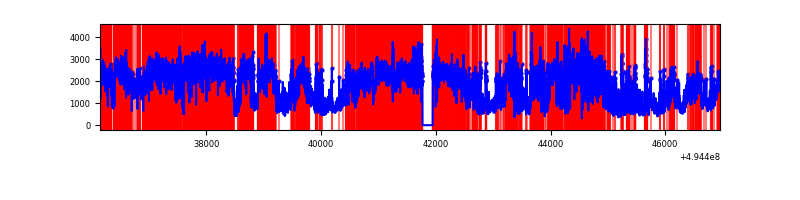 |
| B | 10809 | 10630 | 37 | 37 | 0.34% | 0.35% | 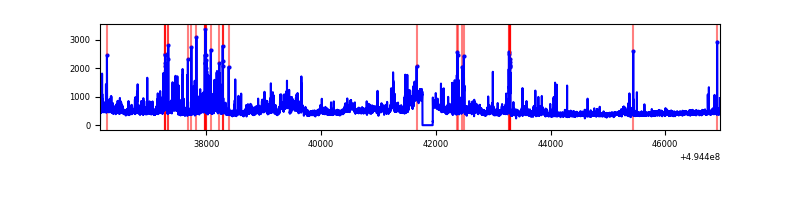 |
| C | 10809 | 10630 | 5138 | 5138 | 47.53% | 48.33% | 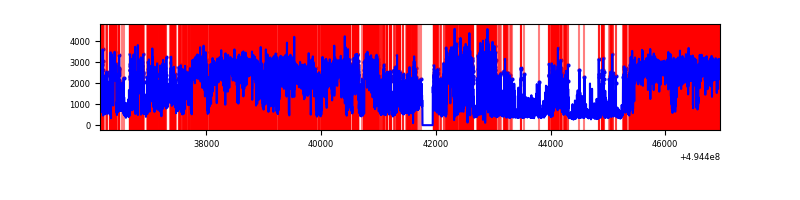 |
| D | 10809 | 10630 | 698 | 698 | 6.46% | 6.57% | 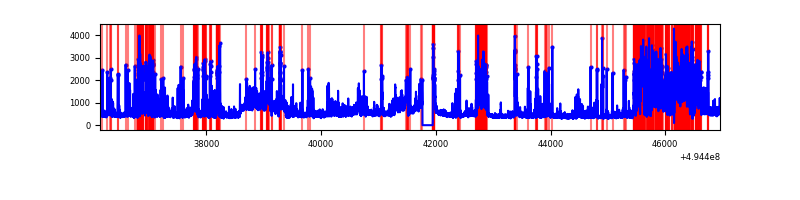 |
Top three noisy pixels from each quadrant. If the there are fewer than three noisy pixels in the level2.evt file, extra rows are filled as -1
| Pixel properties | Quadrant properties | ||||||
|---|---|---|---|---|---|---|---|
| Quadrant | DetID | PixID | Counts | Sigma | Mean | Median | Sigma |
| A | 3 | 63 | 10268481 | 50168.96 | 821 | 800 | 204.7 |
| A | 3 | 78 | 3764596 | 18390.3 | 821 | 800 | 204.7 |
| A | 15 | 174 | 513064 | 2502.98 | 821 | 800 | 204.7 |
| B | 7 | 0 | 869962 | 3762.69 | 1085 | 1048 | 230.9 |
| B | 0 | 213 | 153292 | 659.27 | 1085 | 1048 | 230.9 |
| B | 7 | 252 | 99967 | 428.35 | 1085 | 1048 | 230.9 |
| C | 1 | 241 | 7907694 | 37071.95 | 770 | 763 | 213.3 |
| C | 15 | 224 | 4060080 | 19032.27 | 770 | 763 | 213.3 |
| C | 6 | 13 | 1904763 | 8926.98 | 770 | 763 | 213.3 |
| D | 7 | 70 | 958337 | 3240.87 | 1042 | 995 | 295.4 |
| D | 8 | 176 | 873589 | 2953.97 | 1042 | 995 | 295.4 |
| D | 1 | 241 | 714367 | 2414.96 | 1042 | 995 | 295.4 |
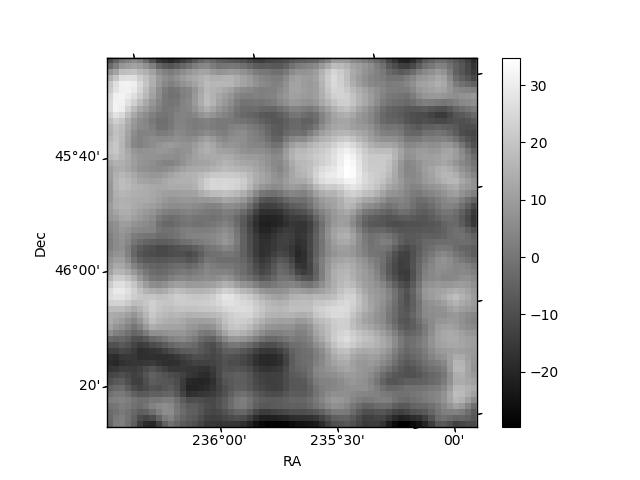
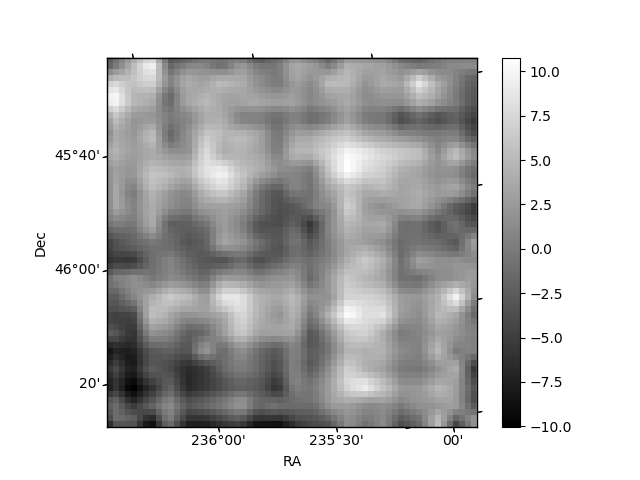
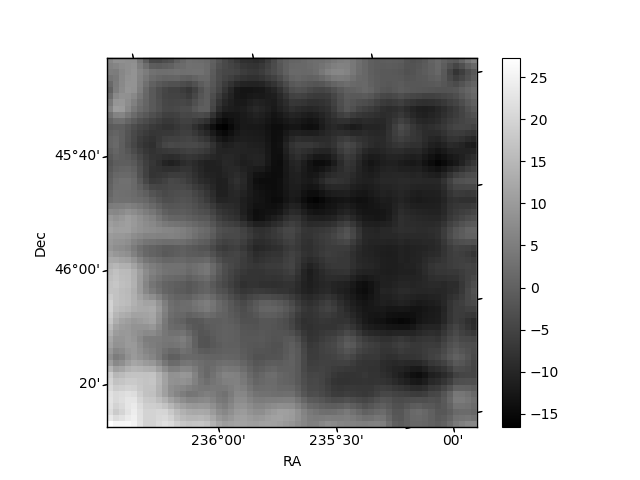
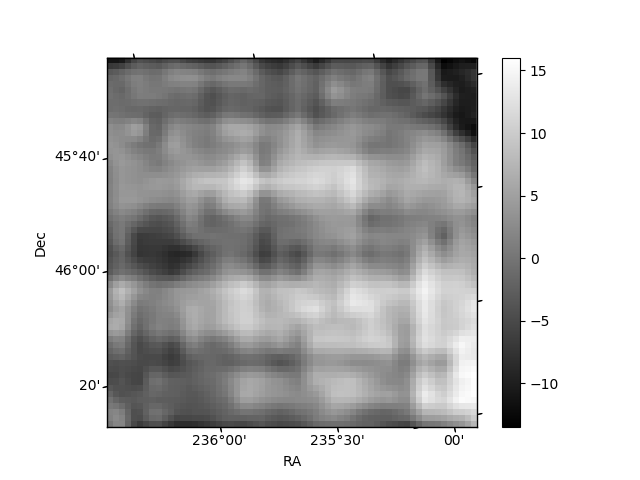
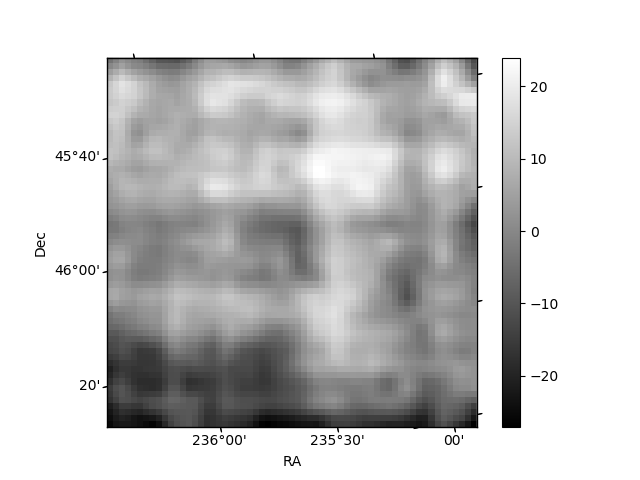
Histogram calculated using DETX and DETY for each event in the final _common_clean file
| Quadrant A | 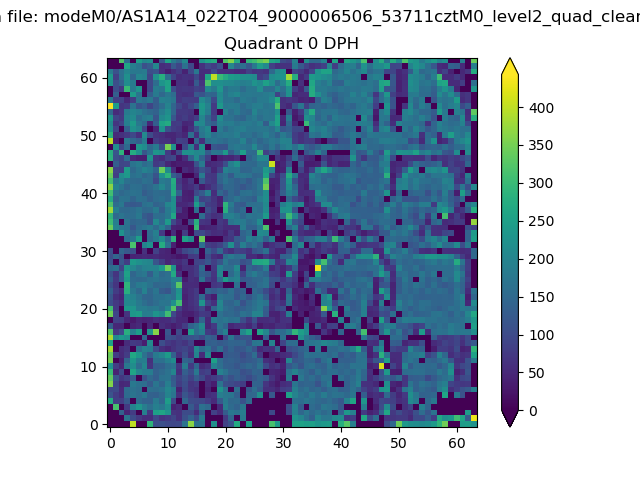 |
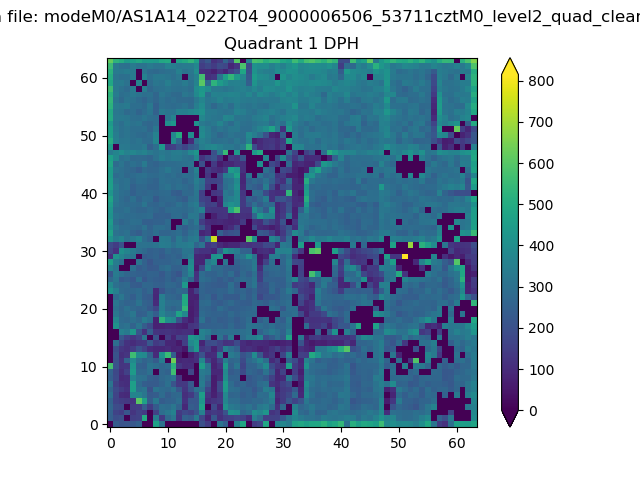 |
Quadrant B |
|---|---|---|---|
| Quadrant D | 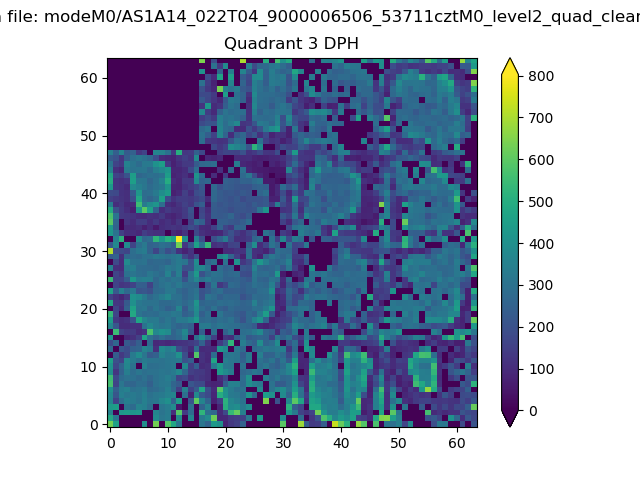 |
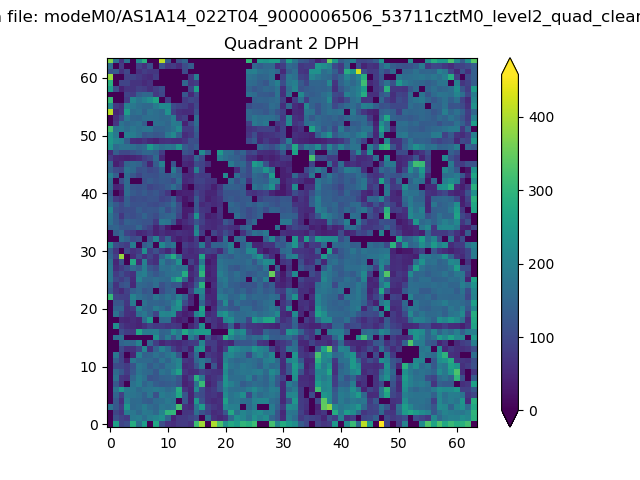 |
Quadrant C |
| Plot type | Count rate plots | Images |
|---|---|---|
| Comparison with Poisson distribution Blue bars denote a histogram of data divided into 1 sec bins. Red curve is a Poisson curve with rate = median count rate of data. |
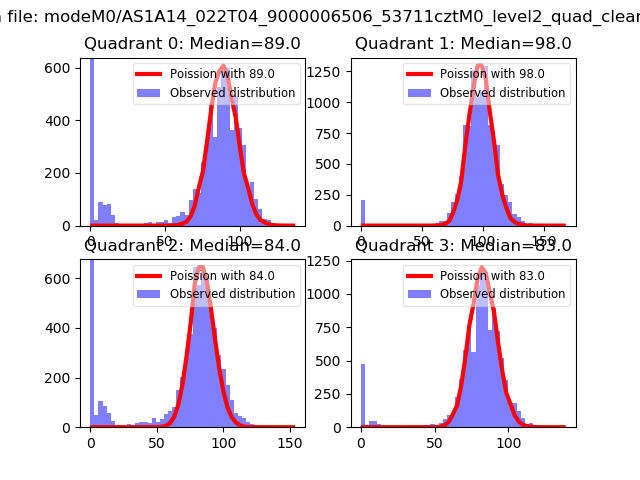 |
 |
| Quadrant-wise count rates Data is divided into 100 sec bins |
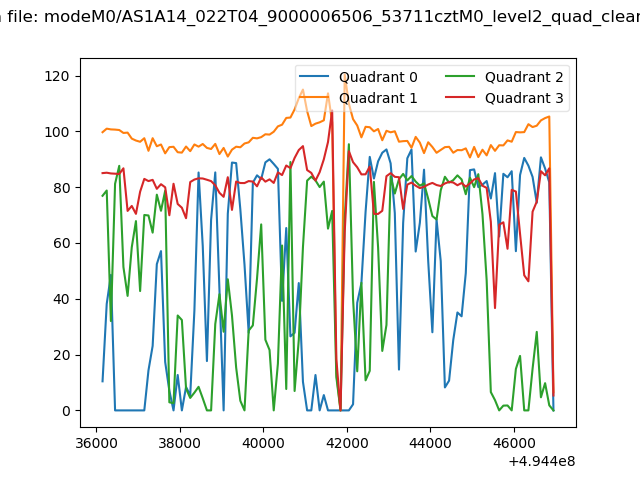 |
|
| Module-wise count rates for Quadrant A Data is divided into 100 sec bins |
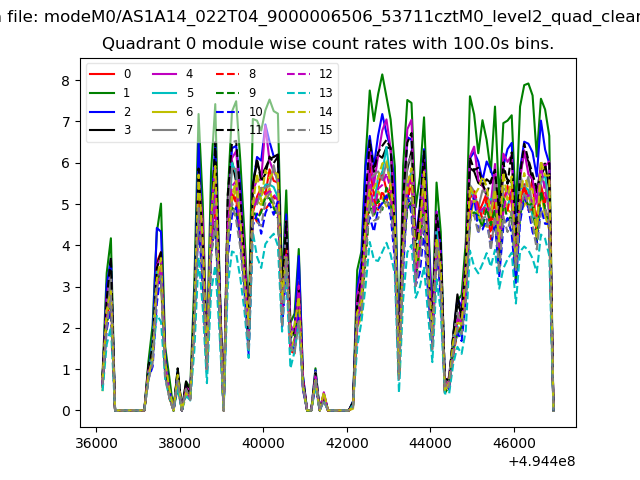 |
 |
| Module-wise count rates for Quadrant B Data is divided into 100 sec bins |
 |
 |
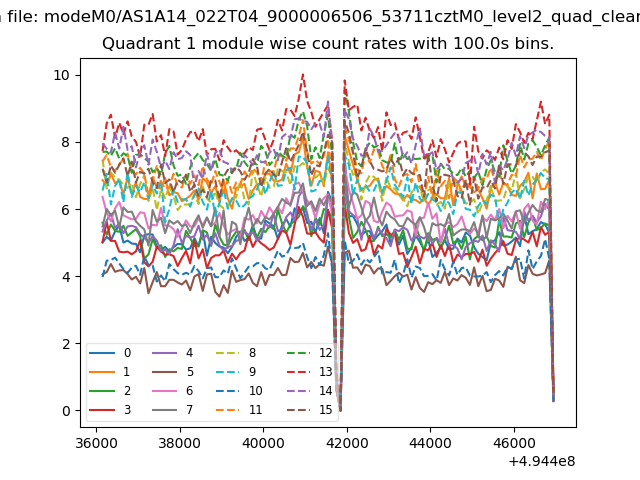
| Module-wise count rates for Quadrant C Data is divided into 100 sec bins |
 |
 |
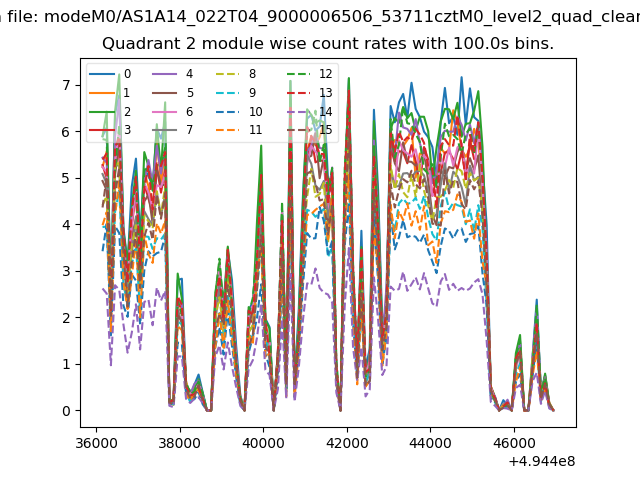
| Module-wise count rates for Quadrant D Data is divided into 100 sec bins |
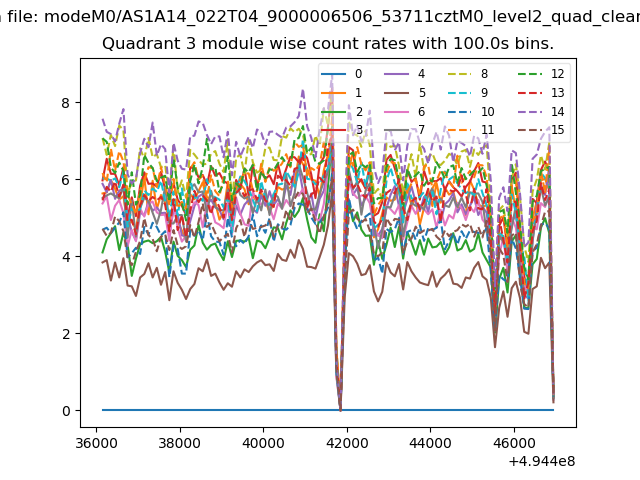 |
 |
| Parameter | Plot |
|---|---|
| CZT HV Monitor | 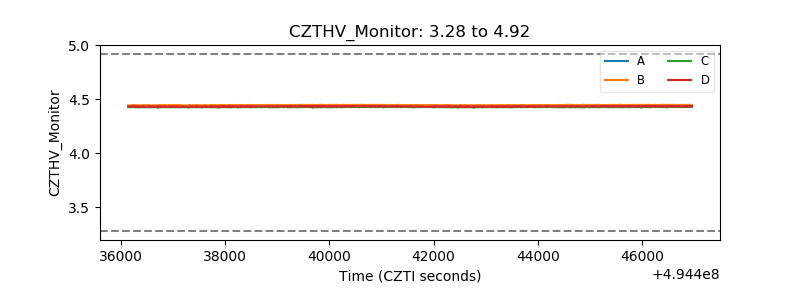 |
| D_VDD | 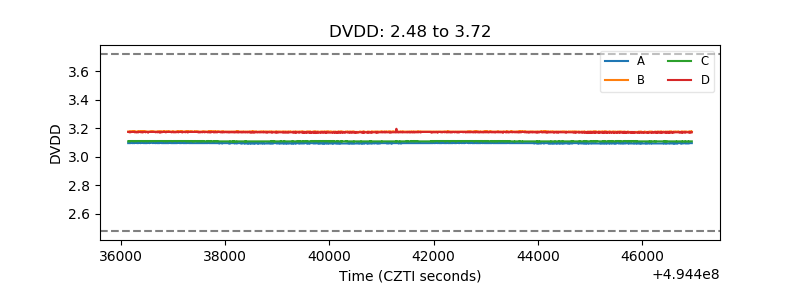 |
| Temperature 1 | 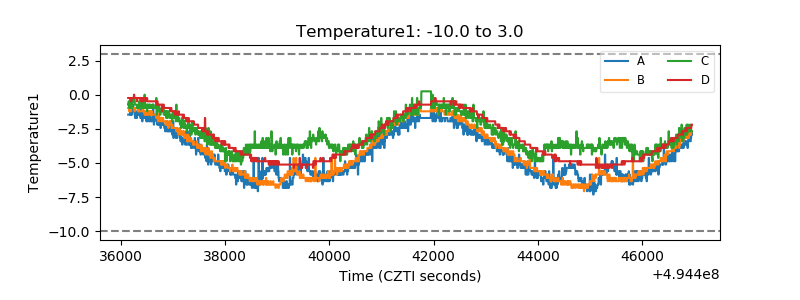 |
| Veto HV Monitor | 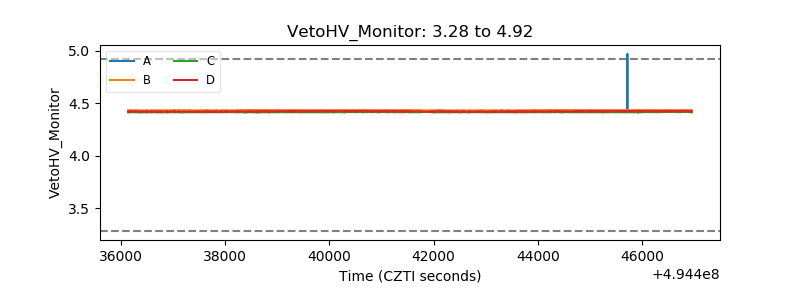 |
| Veto LLD | 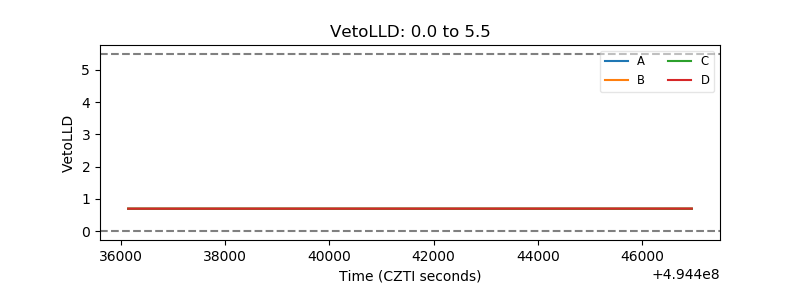 |
| Alpha Counter | 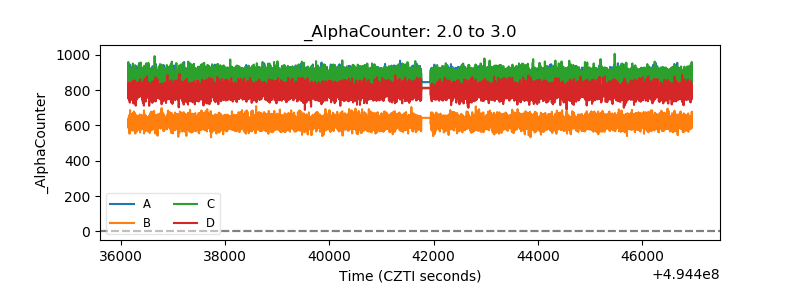 |
| _CPM_Rate | 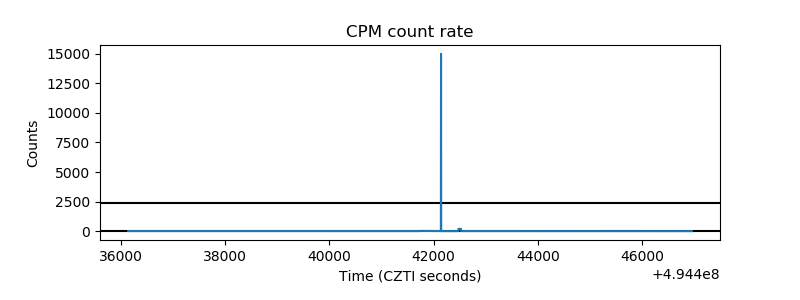 |
| CZT Counter | 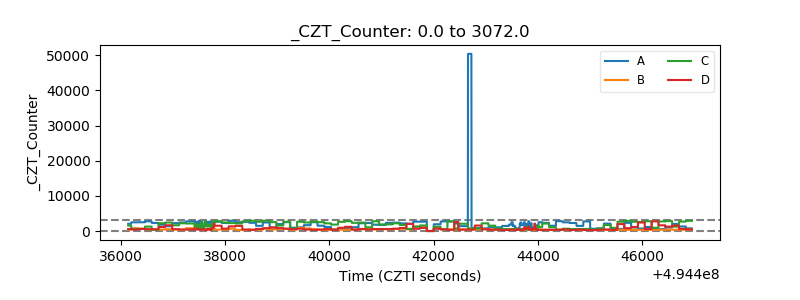 |
| +2.5 Volts monitor |  |
| +5 Volts monitor |  |
| _ROLL_ROT | 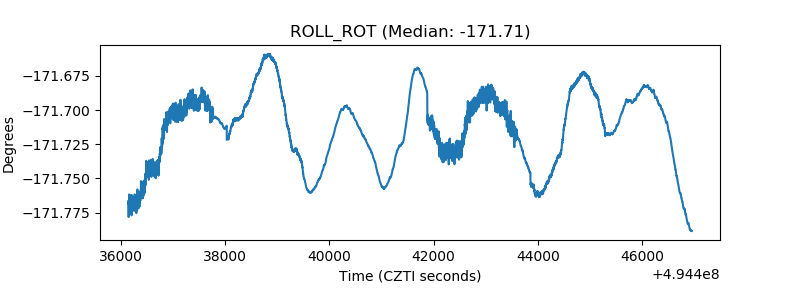 |
| _Roll_DEC | 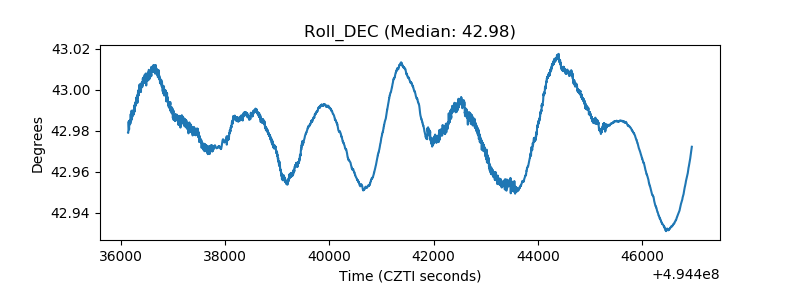 |
| _Roll_RA | 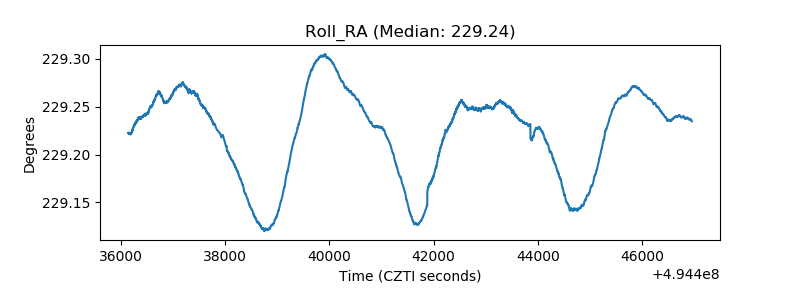 |
| Veto Counter | 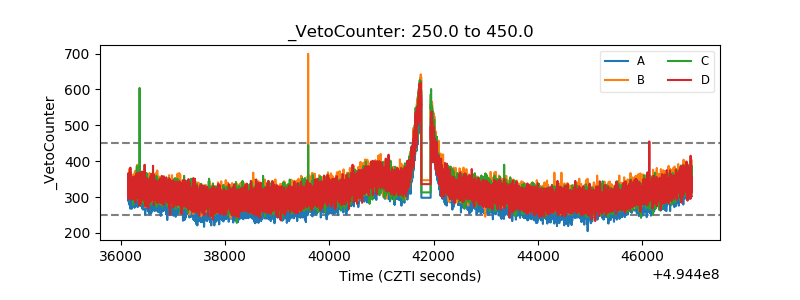 |