| Param | Original file | Final file |
|---|---|---|
| Filename | modeM0/AS1A14_022T04_9000006506_53713cztM0_level2.fits | modeM0/AS1A14_022T04_9000006506_53713cztM0_level2_quad_clean.evt |
| Size (bytes) | 3,471,042,240 | 265,806,720 |
| Size | 3.2 GB | 253.5 MB |
| Events in quadrant A | 47,048,250 | 961,902 |
| Events in quadrant B | 13,347,253 | 2,477,672 |
| Events in quadrant C | 45,999,675 | 912,827 |
| Events in quadrant D | 20,183,780 | 1,989,047 |
| Mode M0 | |||
|---|---|---|---|
| Quadrant | BADHDUFLAG | Total packets | Discarded packets |
| A | 0 | 156912 | 3 |
| B | 0 | 57491 | 3 |
| C | 0 | 153642 | 5 |
| D | 0 | 77509 | 3 |
| Mode SS | |||
|---|---|---|---|
| Quadrant | BADHDUFLAG | Total packets | Discarded packets |
| A | 0 | 502 | 0 |
| B | 0 | 502 | 0 |
| C | 0 | 502 | 0 |
| D | 0 | 502 | 0 |
| Mode M9 | |||
|---|---|---|---|
| Quadrant | BADHDUFLAG | Total packets | Discarded packets |
| A | 0 | 12 | 0 |
| B | 0 | 12 | 0 |
| C | 0 | 12 | 0 |
| D | 0 | 12 | 0 |
| Quadrant | Total seconds | Saturated seconds | Saturation percentage |
|---|---|---|---|
| A | 24781 | 14743 | 59.493160% |
| B | 24782 | 323 | 1.303365% |
| C | 24781 | 15070 | 60.812719% |
| D | 24781 | 1991 | 8.034381% |
Noise dominated data is calculated using 1-second bins in cleaned event files. If a bin has >2000 counts, and if more than 50% of those come from <1% of pixels, then it is considered to be noise-dominated and hence unusable.
| Quadrant | # 1 sec bins | Bins with >0 counts | Bins with >2000 counts | High rate bins dominated by noise | Noise dominated (total time) | Noise dominated (detector-on time) | Marked lightcurve |
|---|---|---|---|---|---|---|---|
| A | 26016 | 24784 | 13413 | 13413 | 51.56% | 54.12% | 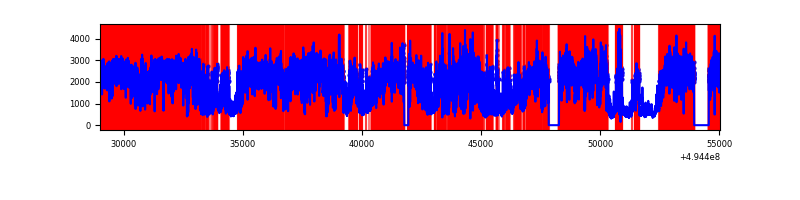 |
| B | 26017 | 24785 | 100 | 100 | 0.38% | 0.40% | 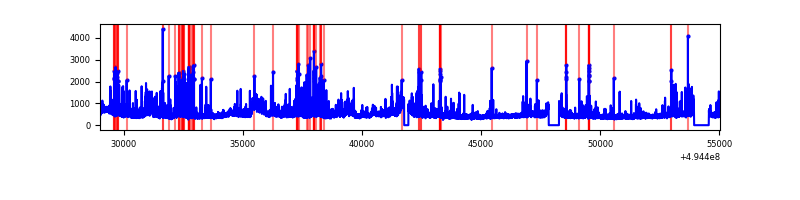 |
| C | 26016 | 24782 | 12356 | 12356 | 47.49% | 49.86% | 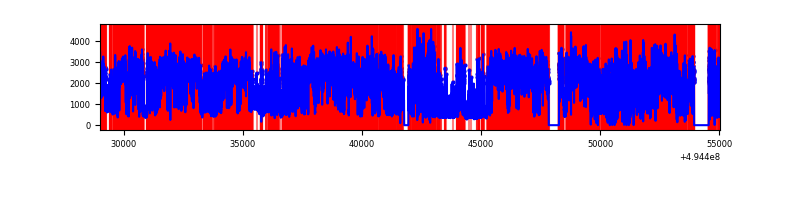 |
| D | 26016 | 24784 | 1865 | 1865 | 7.17% | 7.53% | 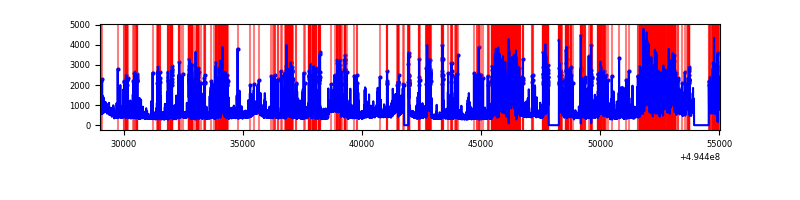 |
Top three noisy pixels from each quadrant. If the there are fewer than three noisy pixels in the level2.evt file, extra rows are filled as -1
| Pixel properties | Quadrant properties | ||||||
|---|---|---|---|---|---|---|---|
| Quadrant | DetID | PixID | Counts | Sigma | Mean | Median | Sigma |
| A | 3 | 63 | 26224095 | 60824.57 | 1748 | 1704 | 431.1 |
| A | 3 | 78 | 10408613 | 24139.51 | 1748 | 1704 | 431.1 |
| A | 15 | 174 | 777702 | 1799.98 | 1748 | 1704 | 431.1 |
| B | 7 | 0 | 1481178 | 2665.56 | 2615 | 2520 | 554.7 |
| B | 0 | 213 | 447241 | 801.69 | 2615 | 2520 | 554.7 |
| B | 5 | 185 | 286386 | 511.72 | 2615 | 2520 | 554.7 |
| C | 1 | 241 | 19716062 | 42543.15 | 1674 | 1657 | 463.4 |
| C | 15 | 224 | 7952013 | 17156.65 | 1674 | 1657 | 463.4 |
| C | 15 | 219 | 4020875 | 8673.36 | 1674 | 1657 | 463.4 |
| D | 8 | 176 | 2222873 | 3110.61 | 2511 | 2406 | 713.8 |
| D | 2 | 62 | 1476420 | 2064.92 | 2511 | 2406 | 713.8 |
| D | 7 | 70 | 1417377 | 1982.21 | 2511 | 2406 | 713.8 |
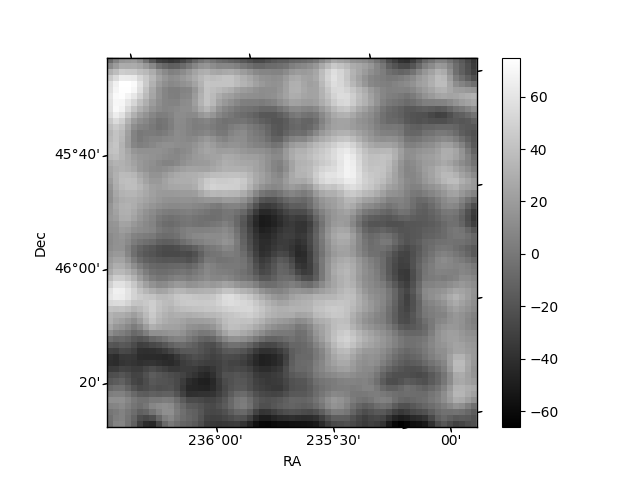
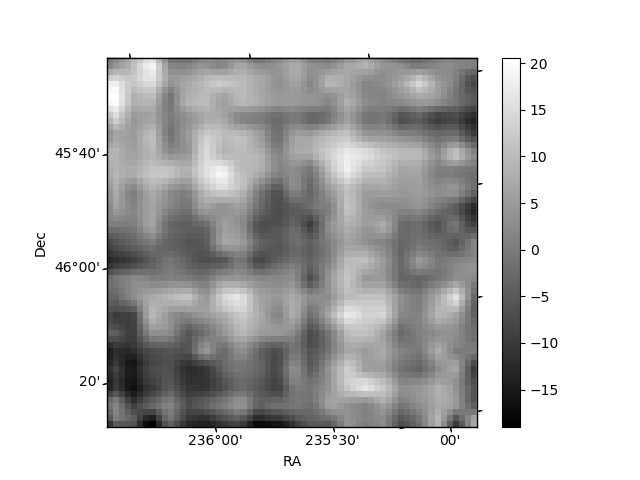
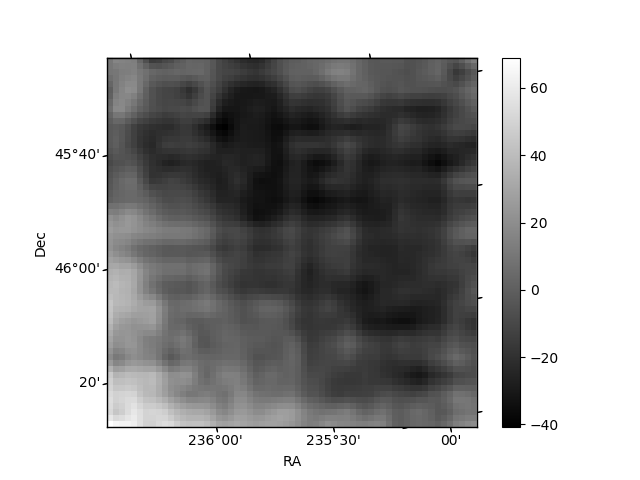
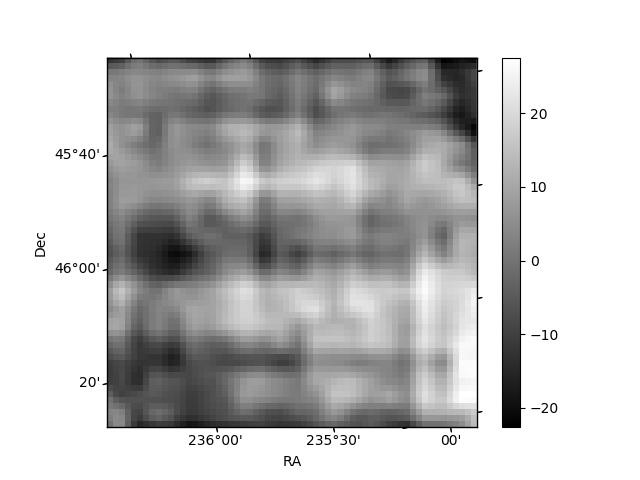
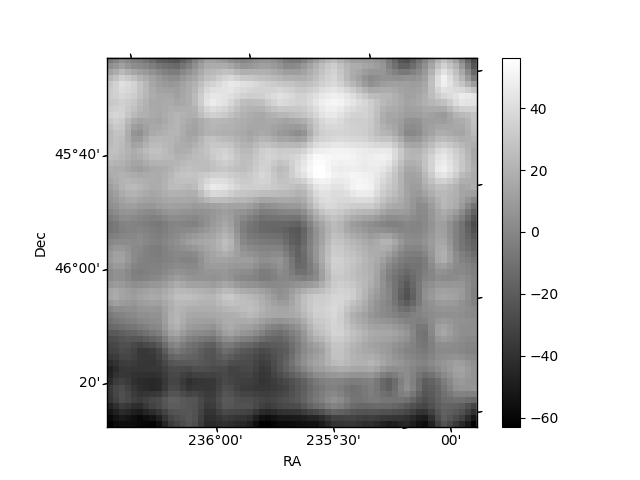
Histogram calculated using DETX and DETY for each event in the final _common_clean file
| Quadrant A | 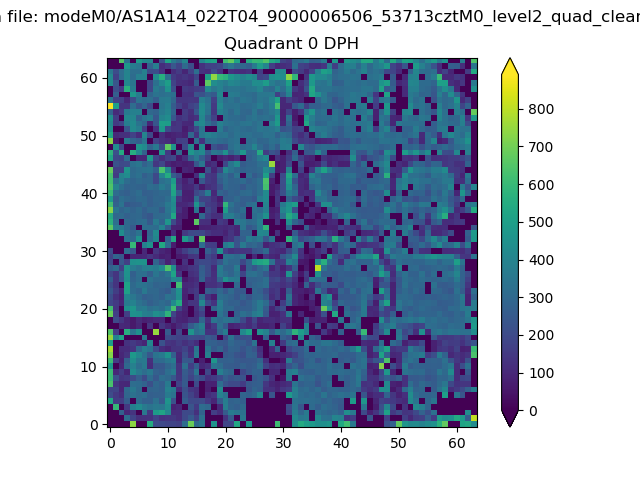 |
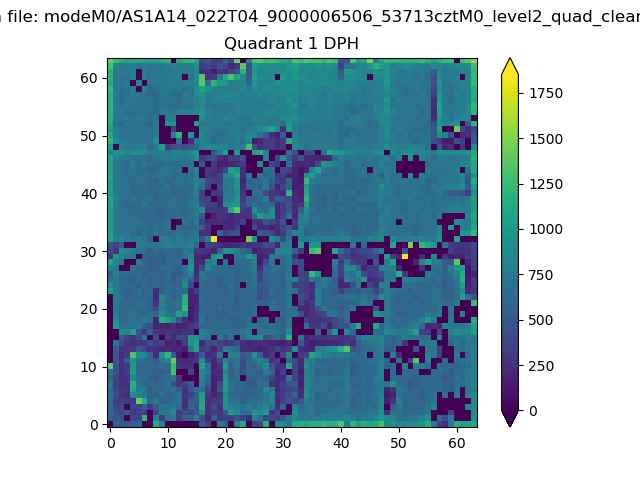 |
Quadrant B |
|---|---|---|---|
| Quadrant D | 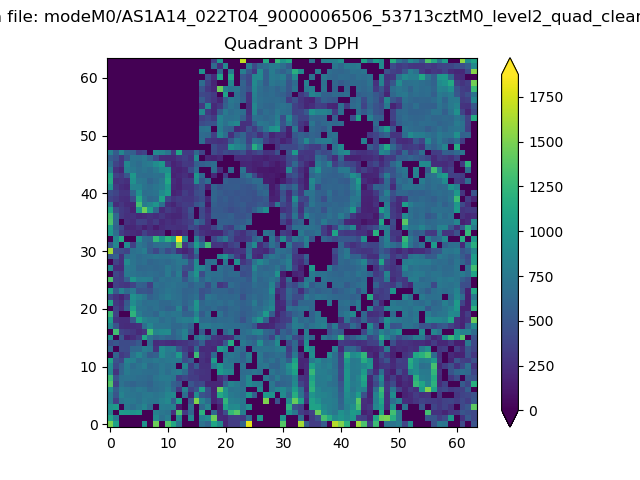 |
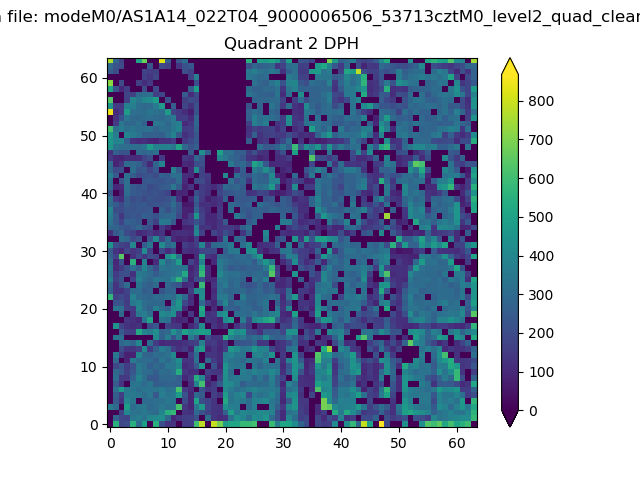 |
Quadrant C |
| Plot type | Count rate plots | Images |
|---|---|---|
| Comparison with Poisson distribution Blue bars denote a histogram of data divided into 1 sec bins. Red curve is a Poisson curve with rate = median count rate of data. |
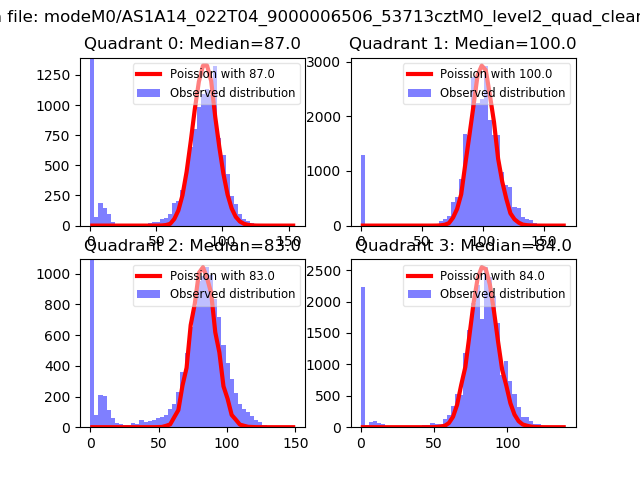 |
 |
| Quadrant-wise count rates Data is divided into 100 sec bins |
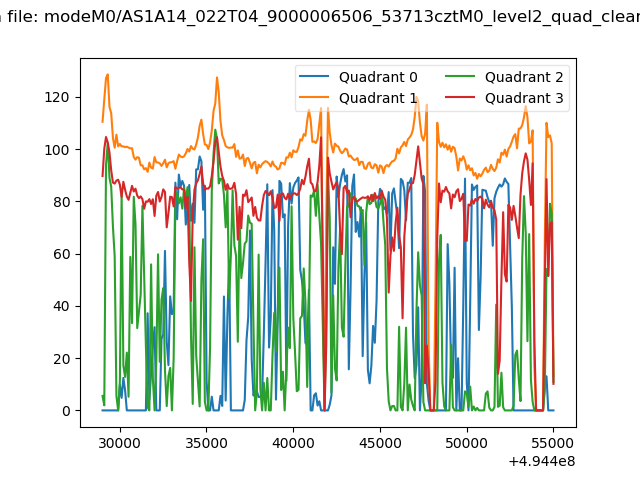 |
|
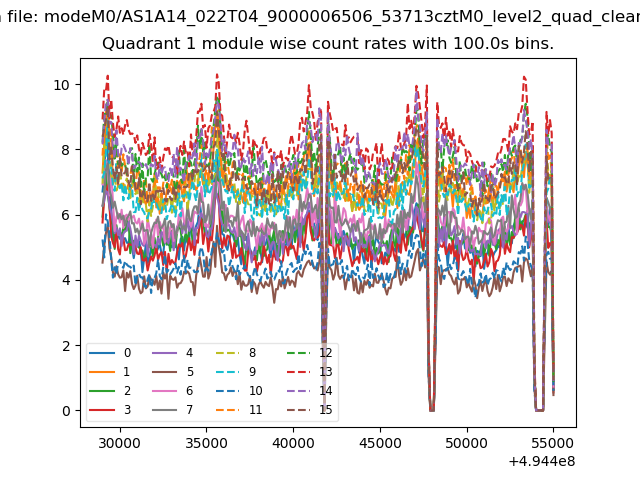
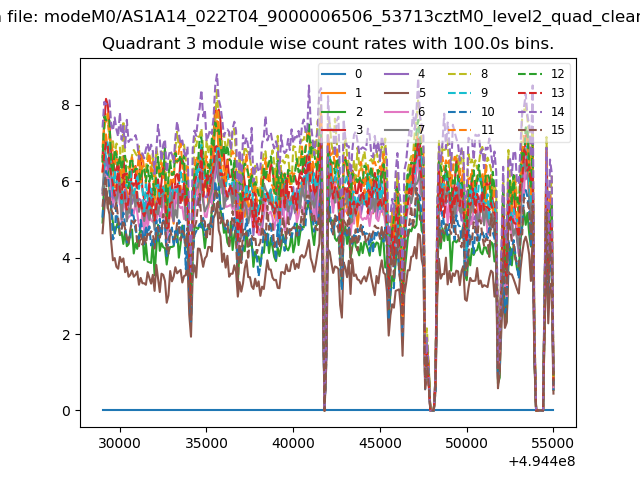
| Module-wise count rates for Quadrant A Data is divided into 100 sec bins |
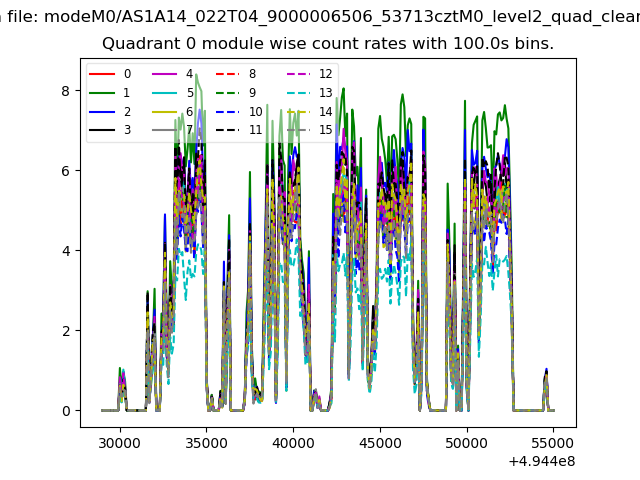 |
 |
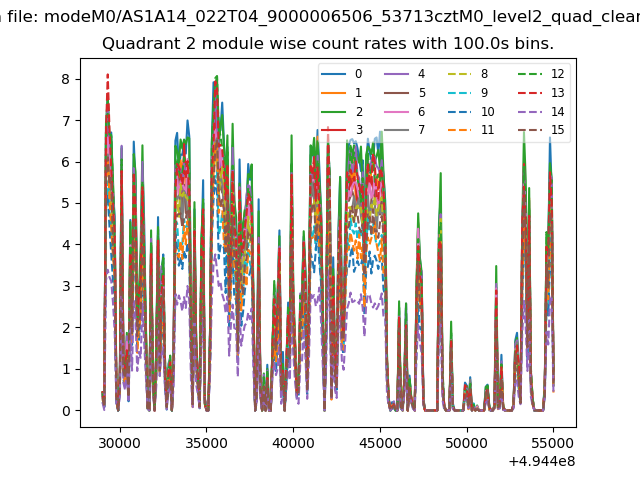
| Module-wise count rates for Quadrant B Data is divided into 100 sec bins |
 |
 |
| Module-wise count rates for Quadrant C Data is divided into 100 sec bins |
 |
 |
| Module-wise count rates for Quadrant D Data is divided into 100 sec bins |
 |
 |
| Parameter | Plot |
|---|---|
| CZT HV Monitor | 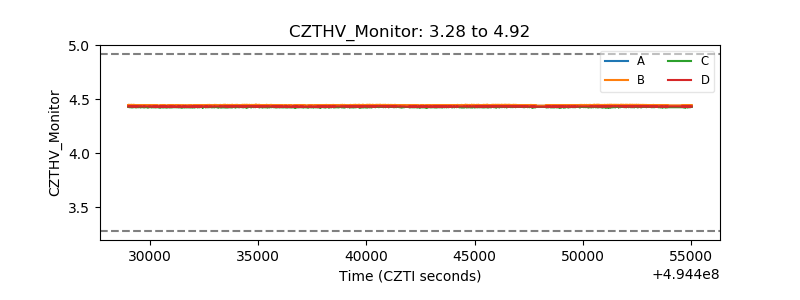 |
| D_VDD | 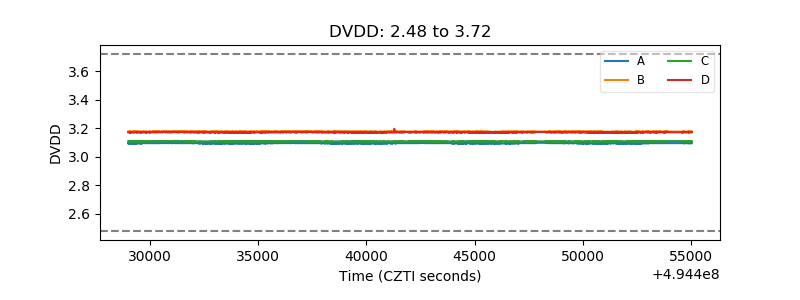 |
| Temperature 1 | 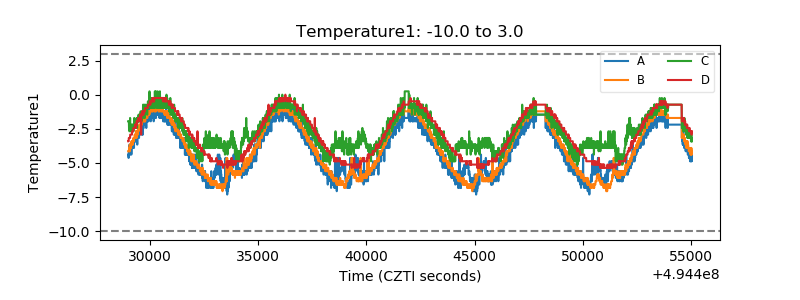 |
| Veto HV Monitor | 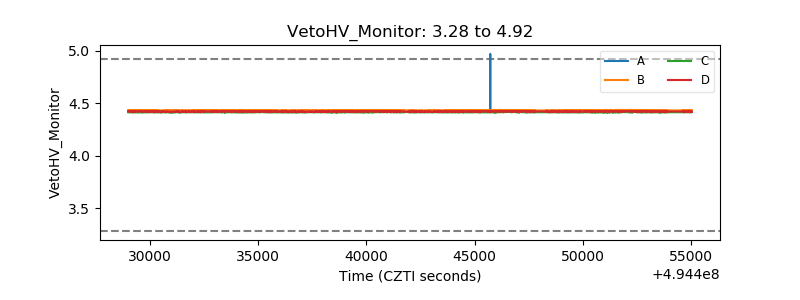 |
| Veto LLD | 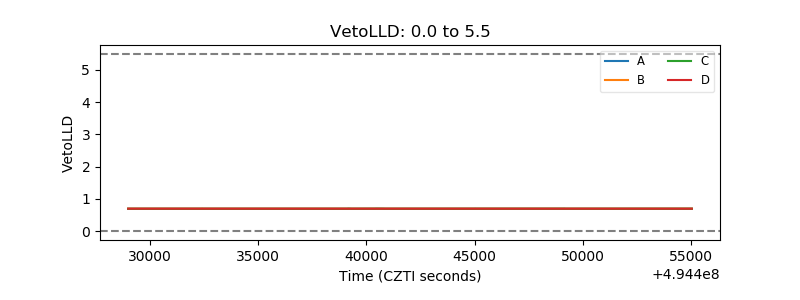 |
| Alpha Counter | 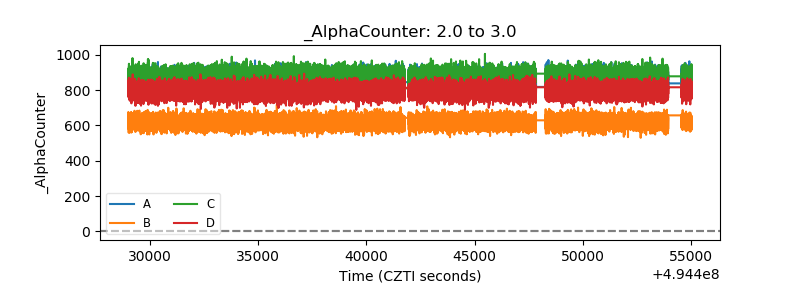 |
| _CPM_Rate | 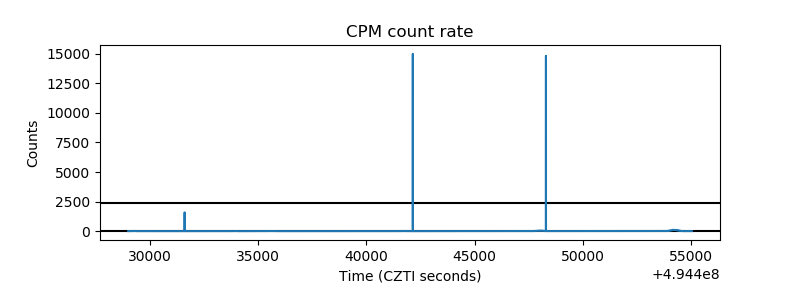 |
| CZT Counter | 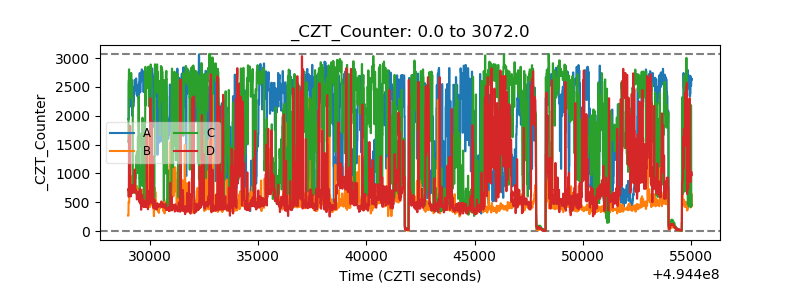 |
| +2.5 Volts monitor |  |
| +5 Volts monitor |  |
| _ROLL_ROT | 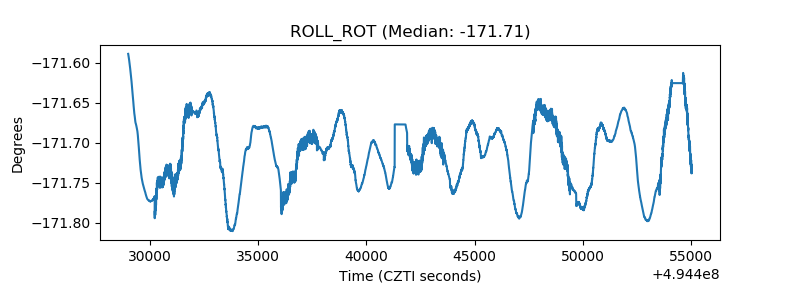 |
| _Roll_DEC | 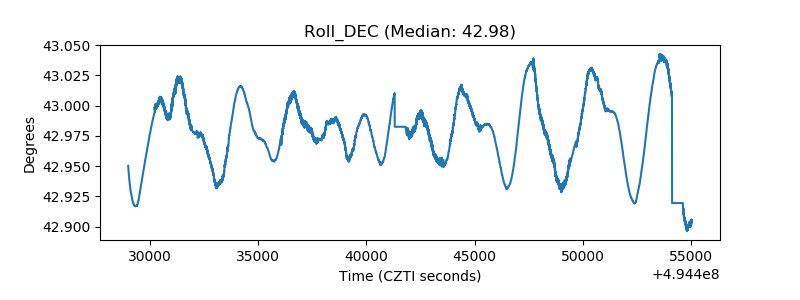 |
| _Roll_RA | 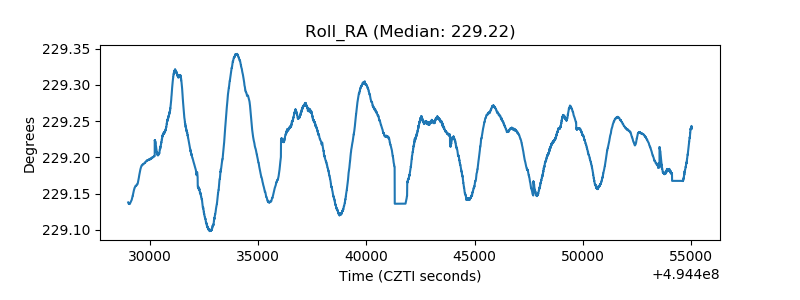 |
| Veto Counter | 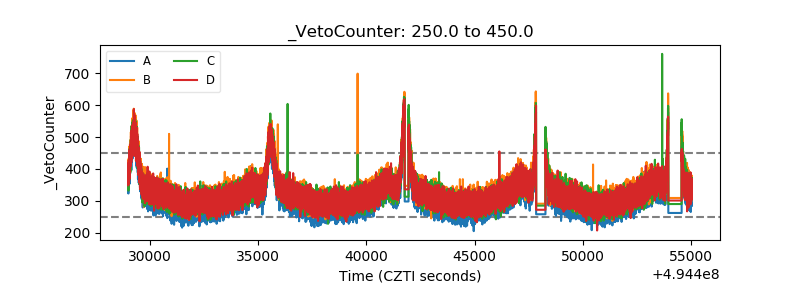 |