| Param | Original file | Final file |
|---|---|---|
| Filename | modeM0/AS1A14_022T04_9000006506_53715cztM0_level2.fits | modeM0/AS1A14_022T04_9000006506_53715cztM0_level2_quad_clean.evt |
| Size (bytes) | 933,238,080 | 70,689,600 |
| Size | 890.0 MB | 67.4 MB |
| Events in quadrant A | 13,711,747 | 224,966 |
| Events in quadrant B | 3,143,356 | 656,083 |
| Events in quadrant C | 7,402,667 | 480,433 |
| Events in quadrant D | 9,790,431 | 330,254 |
| Mode M0 | |||
|---|---|---|---|
| Quadrant | BADHDUFLAG | Total packets | Discarded packets |
| A | 0 | 45208 | 1 |
| B | 0 | 14087 | 1 |
| C | 0 | 26480 | 1 |
| D | 0 | 33488 | 8 |
| Mode SS | |||
|---|---|---|---|
| Quadrant | BADHDUFLAG | Total packets | Discarded packets |
| A | 0 | 130 | 0 |
| B | 0 | 130 | 0 |
| C | 0 | 130 | 0 |
| D | 0 | 130 | 0 |
| Mode M9 | |||
|---|---|---|---|
| Quadrant | BADHDUFLAG | Total packets | Discarded packets |
| A | 0 | 11 | 0 |
| B | 0 | 11 | 0 |
| C | 0 | 11 | 0 |
| D | 0 | 11 | 0 |
| Quadrant | Total seconds | Saturated seconds | Saturation percentage |
|---|---|---|---|
| A | 6429 | 4357 | 67.771037% |
| B | 6430 | 104 | 1.617418% |
| C | 6430 | 1479 | 23.001555% |
| D | 6429 | 2862 | 44.517032% |
Noise dominated data is calculated using 1-second bins in cleaned event files. If a bin has >2000 counts, and if more than 50% of those come from <1% of pixels, then it is considered to be noise-dominated and hence unusable.
| Quadrant | # 1 sec bins | Bins with >0 counts | Bins with >2000 counts | High rate bins dominated by noise | Noise dominated (total time) | Noise dominated (detector-on time) | Marked lightcurve |
|---|---|---|---|---|---|---|---|
| A | 7509 | 6430 | 4266 | 4266 | 56.81% | 66.35% | 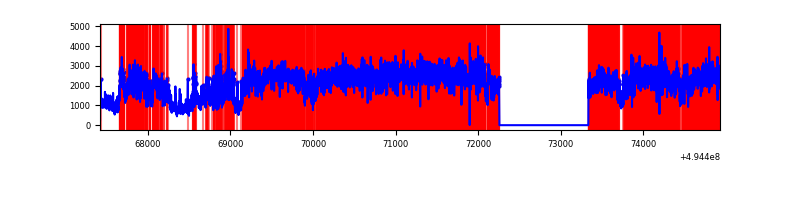 |
| B | 7510 | 6431 | 41 | 41 | 0.55% | 0.64% | 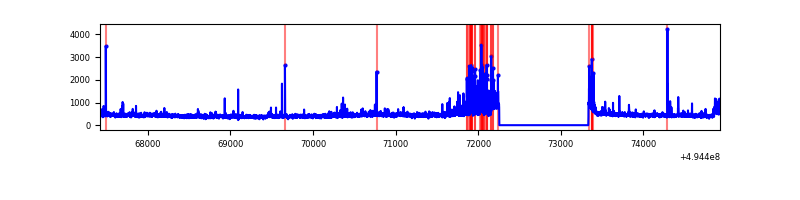 |
| C | 7510 | 6431 | 1024 | 1024 | 13.64% | 15.92% | 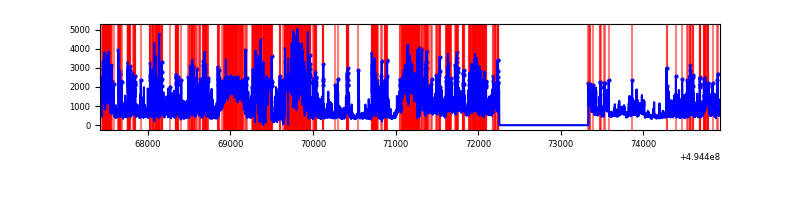 |
| D | 7508 | 6429 | 2385 | 2385 | 31.77% | 37.10% | 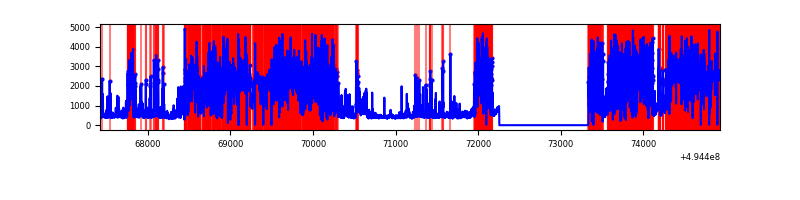 |
Top three noisy pixels from each quadrant. If the there are fewer than three noisy pixels in the level2.evt file, extra rows are filled as -1
| Pixel properties | Quadrant properties | ||||||
|---|---|---|---|---|---|---|---|
| Quadrant | DetID | PixID | Counts | Sigma | Mean | Median | Sigma |
| A | 3 | 63 | 10583469 | 88733.67 | 475 | 464 | 119.3 |
| A | 3 | 78 | 687063 | 5756.82 | 475 | 464 | 119.3 |
| A | 7 | 206 | 320559 | 2683.85 | 475 | 464 | 119.3 |
| B | 1 | 223 | 171025 | 1186.9 | 672 | 649 | 143.5 |
| B | 5 | 185 | 98931 | 684.67 | 672 | 649 | 143.5 |
| B | 0 | 213 | 48879 | 335.99 | 672 | 649 | 143.5 |
| C | 15 | 219 | 1819951 | 11487.47 | 576 | 573 | 158.4 |
| C | 15 | 224 | 1460402 | 9217.29 | 576 | 573 | 158.4 |
| C | 15 | 158 | 802763 | 5064.99 | 576 | 573 | 158.4 |
| D | 8 | 176 | 5057394 | 37757.51 | 463 | 442 | 133.9 |
| D | 1 | 241 | 2131702 | 15912.96 | 463 | 442 | 133.9 |
| D | 7 | 70 | 500129 | 3730.89 | 463 | 442 | 133.9 |
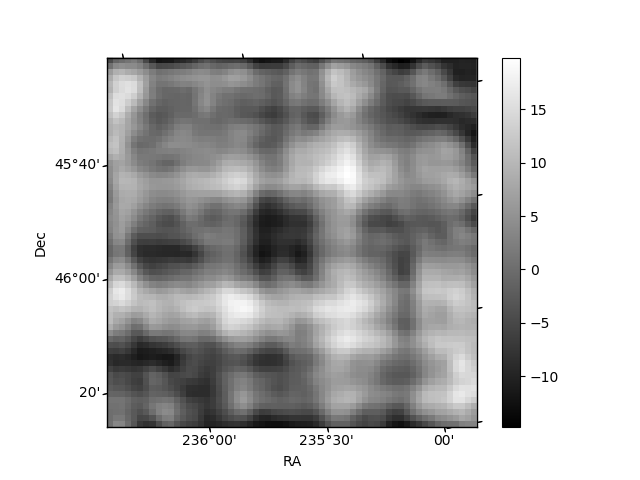
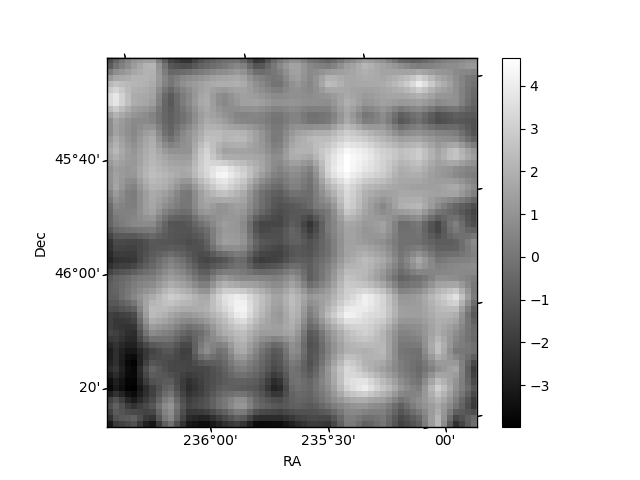
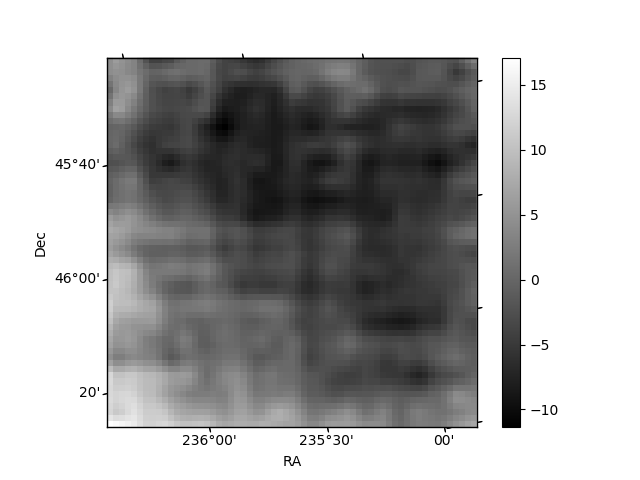
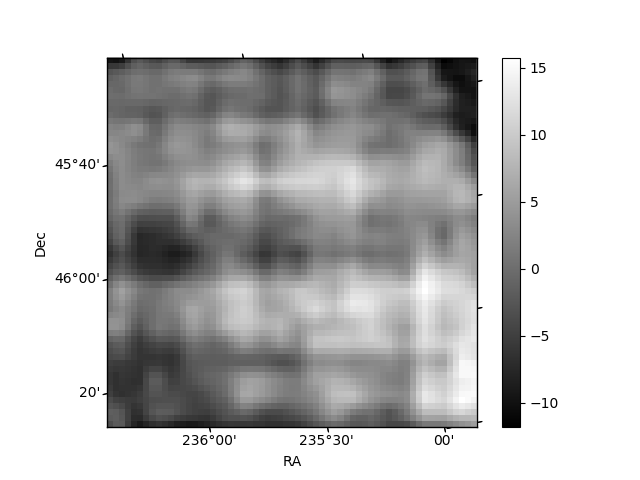
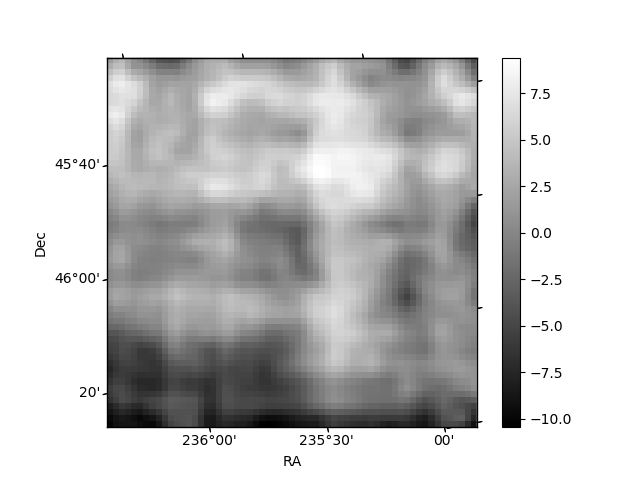
Histogram calculated using DETX and DETY for each event in the final _common_clean file
| Quadrant A | 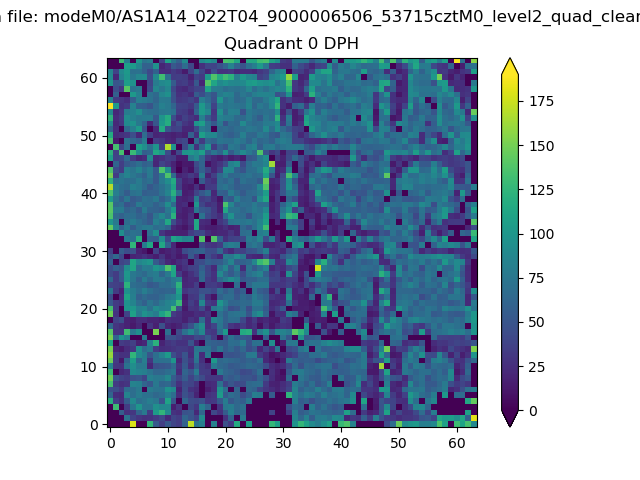 |
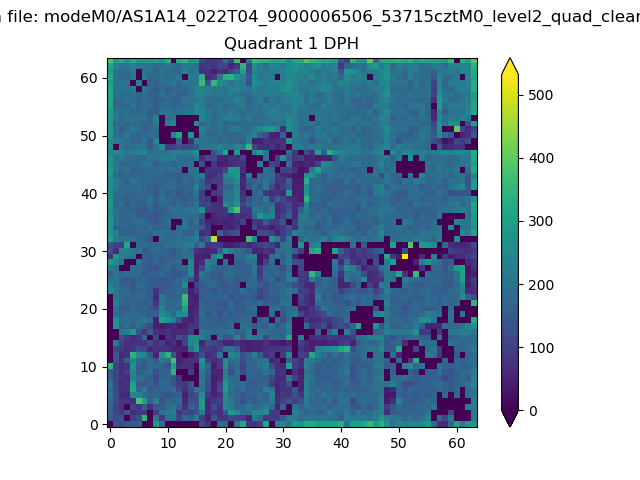 |
Quadrant B |
|---|---|---|---|
| Quadrant D | 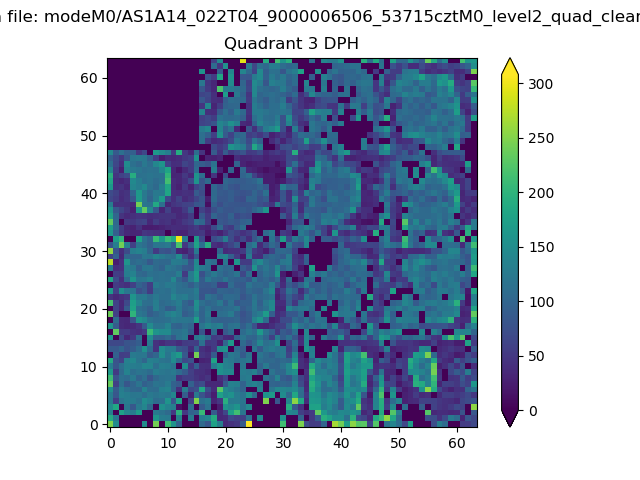 |
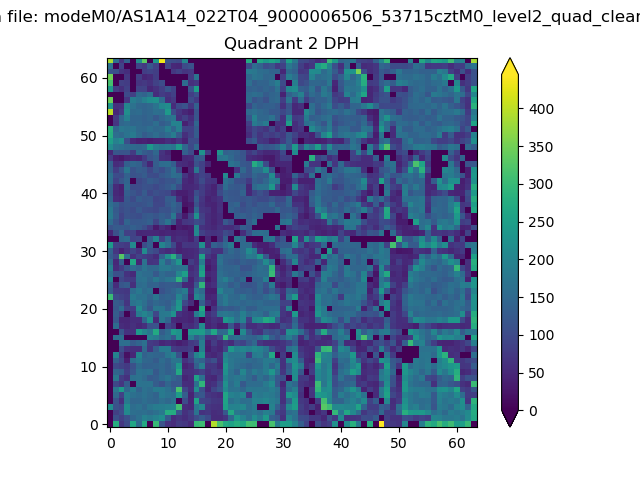 |
Quadrant C |
| Plot type | Count rate plots | Images |
|---|---|---|
| Comparison with Poisson distribution Blue bars denote a histogram of data divided into 1 sec bins. Red curve is a Poisson curve with rate = median count rate of data. |
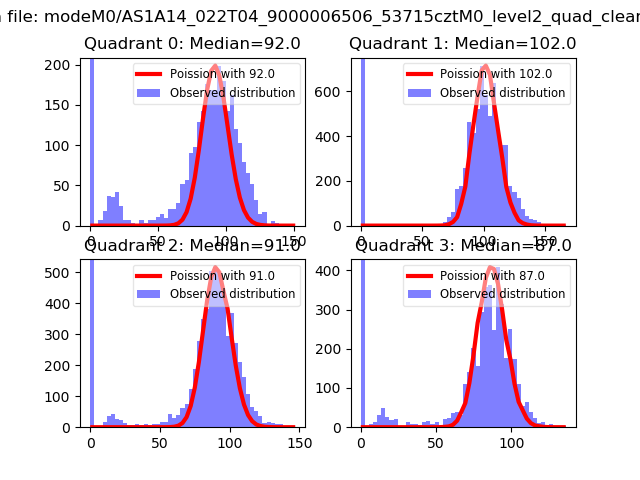 |
 |
| Quadrant-wise count rates Data is divided into 100 sec bins |
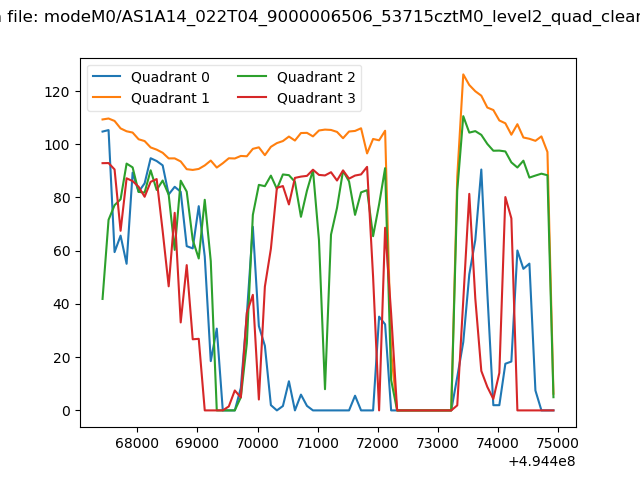 |
|
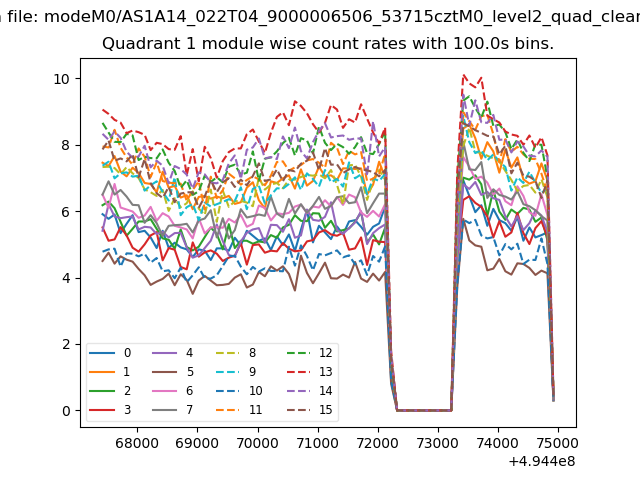
| Module-wise count rates for Quadrant A Data is divided into 100 sec bins |
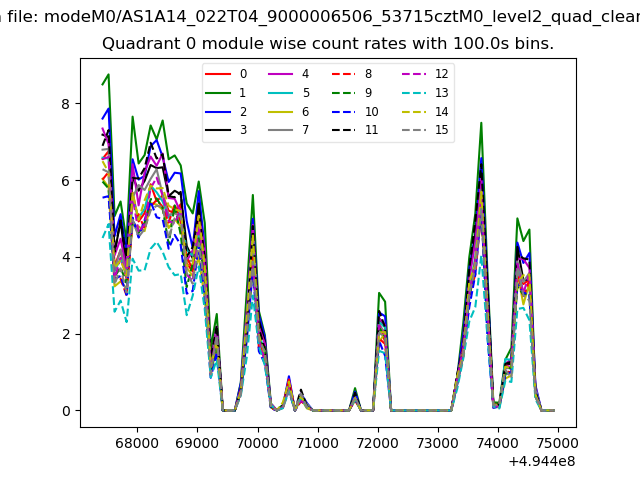 |
 |
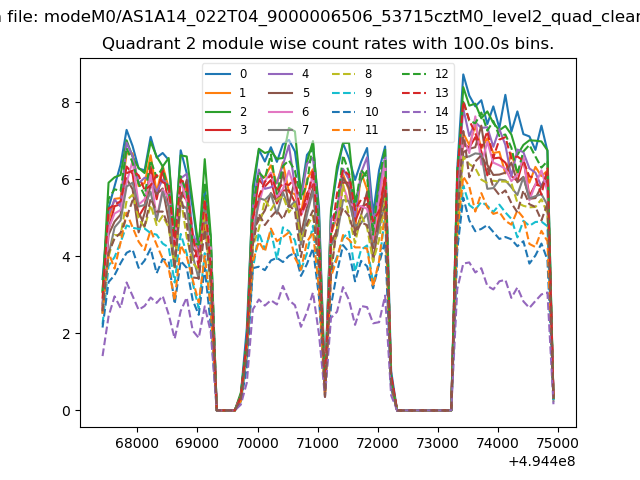
| Module-wise count rates for Quadrant B Data is divided into 100 sec bins |
 |
 |
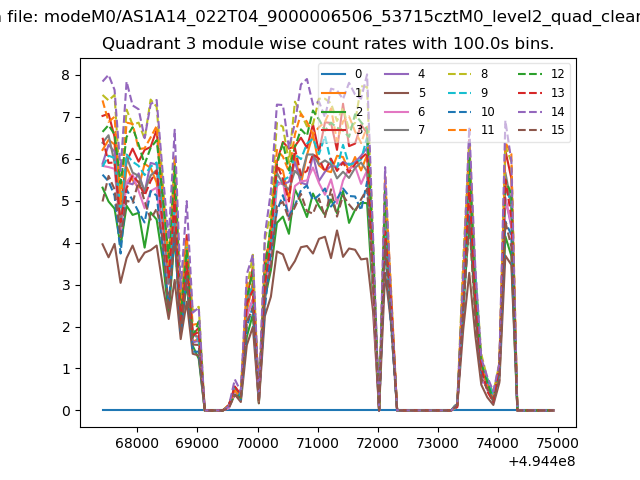
| Module-wise count rates for Quadrant C Data is divided into 100 sec bins |
 |
 |
| Module-wise count rates for Quadrant D Data is divided into 100 sec bins |
 |
 |
| Parameter | Plot |
|---|---|
| CZT HV Monitor | 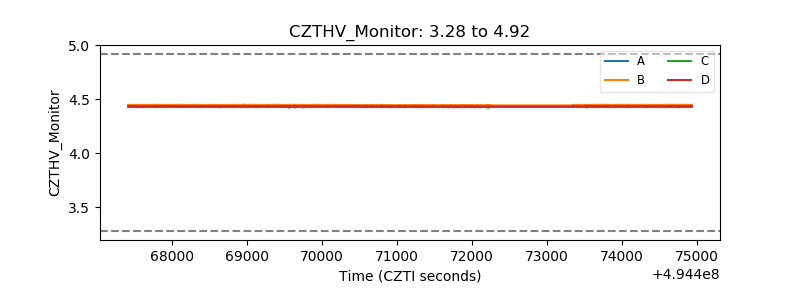 |
| D_VDD | 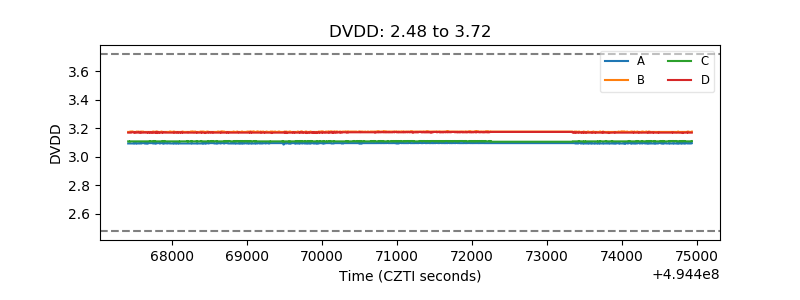 |
| Temperature 1 | 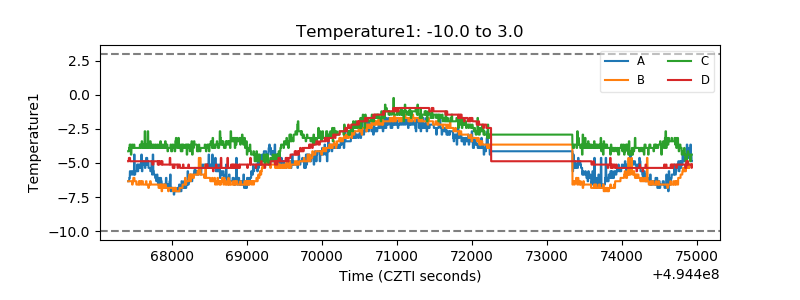 |
| Veto HV Monitor | 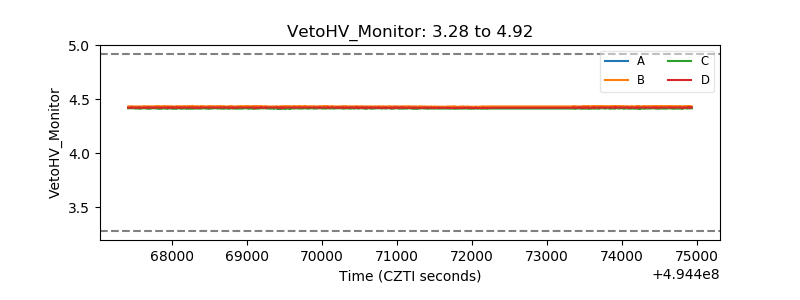 |
| Veto LLD | 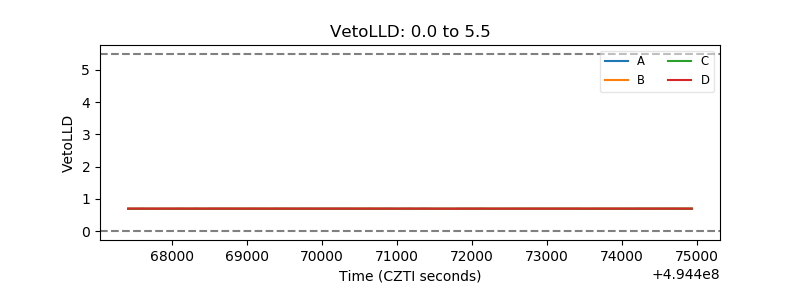 |
| Alpha Counter | 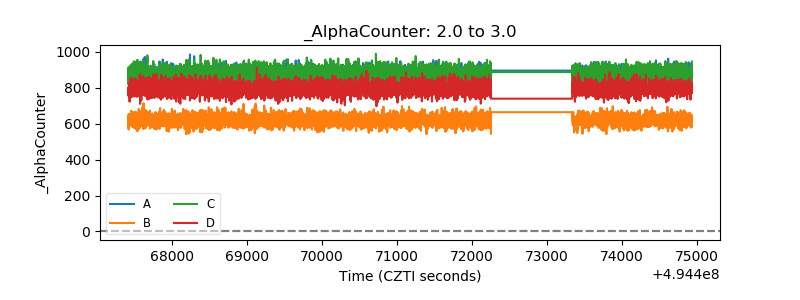 |
| _CPM_Rate | 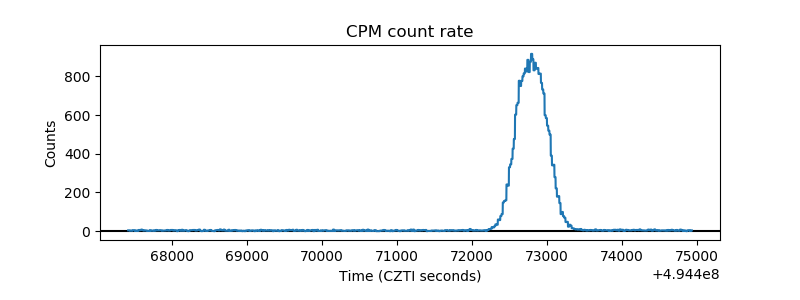 |
| CZT Counter | 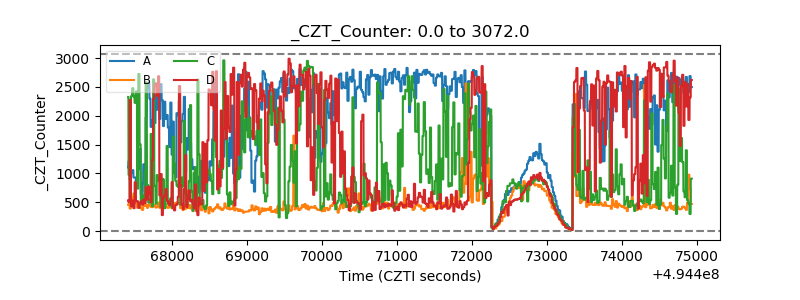 |
| +2.5 Volts monitor | 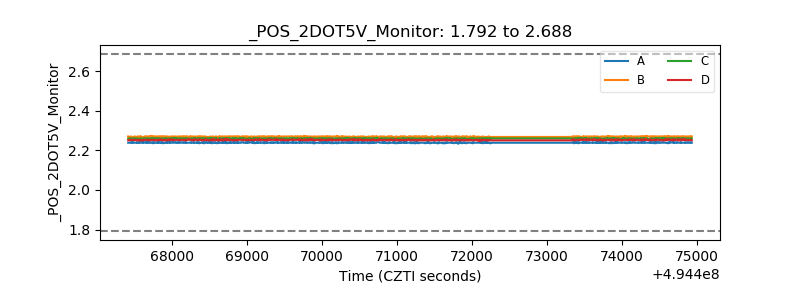 |
| +5 Volts monitor | 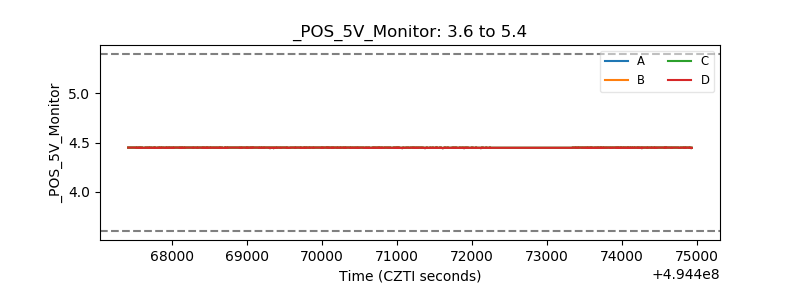 |
| _ROLL_ROT | 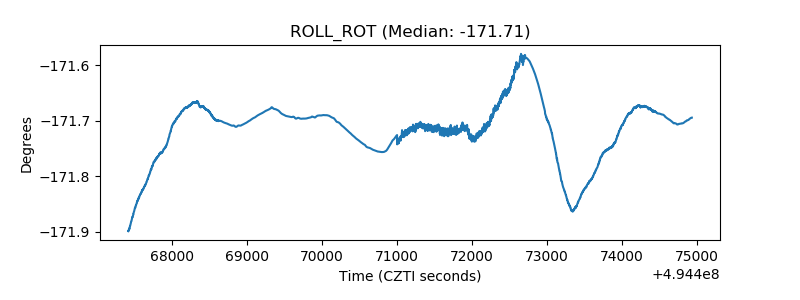 |
| _Roll_DEC | 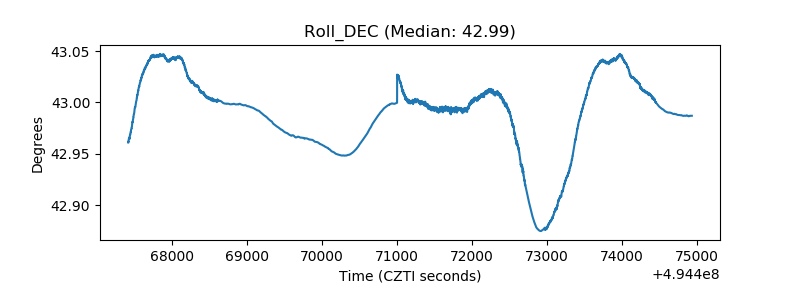 |
| _Roll_RA | 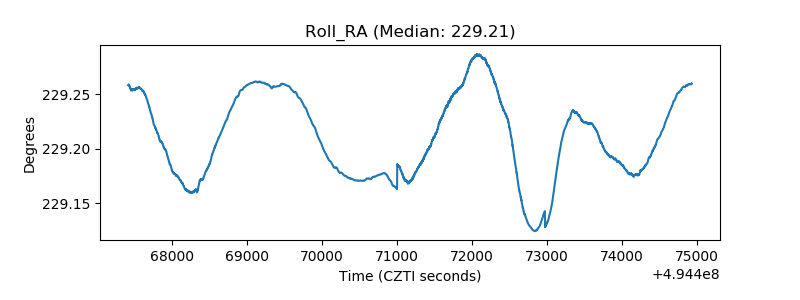 |
| Veto Counter | 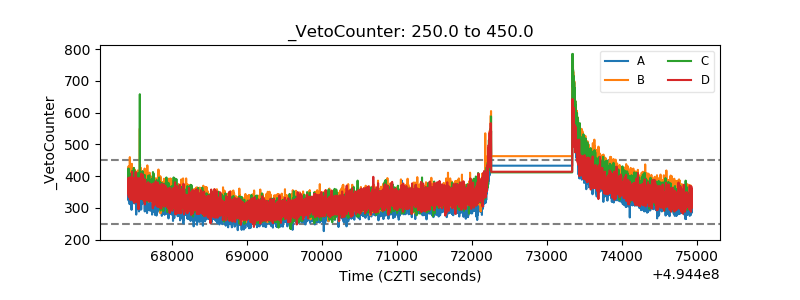 |