| Param | Original file | Final file |
|---|---|---|
| Filename | modeM0/AS1A14_022T04_9000006506_53717cztM0_level2.fits | modeM0/AS1A14_022T04_9000006506_53717cztM0_level2_quad_clean.evt |
| Size (bytes) | 1,679,106,240 | 104,466,240 |
| Size | 1.6 GB | 99.6 MB |
| Events in quadrant A | 26,156,088 | 52,699 |
| Events in quadrant B | 5,901,718 | 1,085,333 |
| Events in quadrant C | 10,323,200 | 875,961 |
| Events in quadrant D | 18,971,930 | 427,065 |
| Mode M0 | |||
|---|---|---|---|
| Quadrant | BADHDUFLAG | Total packets | Discarded packets |
| A | 0 | 84904 | 10 |
| B | 0 | 24900 | 2 |
| C | 0 | 38021 | 2 |
| D | 0 | 63579 | 2 |
| Mode SS | |||
|---|---|---|---|
| Quadrant | BADHDUFLAG | Total packets | Discarded packets |
| A | 0 | 214 | 0 |
| B | 0 | 214 | 0 |
| C | 0 | 214 | 0 |
| D | 0 | 214 | 0 |
| Mode M9 | |||
|---|---|---|---|
| Quadrant | BADHDUFLAG | Total packets | Discarded packets |
| A | 0 | 23 | 0 |
| B | 0 | 23 | 0 |
| C | 0 | 23 | 0 |
| D | 0 | 23 | 0 |
| Quadrant | Total seconds | Saturated seconds | Saturation percentage |
|---|---|---|---|
| A | 10412 | 10023 | 96.263926% |
| B | 10413 | 299 | 2.871411% |
| C | 10413 | 1304 | 12.522808% |
| D | 10414 | 5872 | 56.385635% |
Noise dominated data is calculated using 1-second bins in cleaned event files. If a bin has >2000 counts, and if more than 50% of those come from <1% of pixels, then it is considered to be noise-dominated and hence unusable.
| Quadrant | # 1 sec bins | Bins with >0 counts | Bins with >2000 counts | High rate bins dominated by noise | Noise dominated (total time) | Noise dominated (detector-on time) | Marked lightcurve |
|---|---|---|---|---|---|---|---|
| A | 12718 | 10414 | 9546 | 9546 | 75.06% | 91.67% | 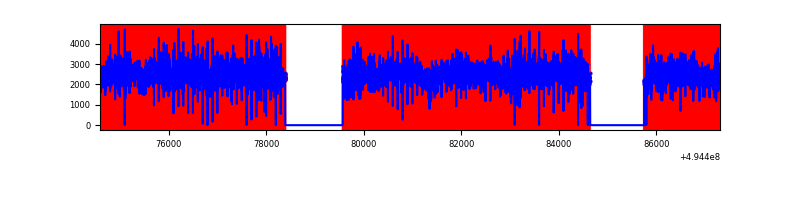 |
| B | 12718 | 10416 | 105 | 105 | 0.83% | 1.01% | 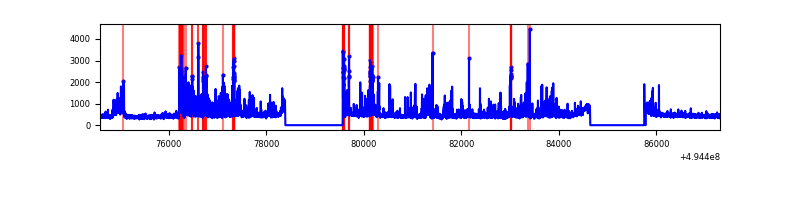 |
| C | 12718 | 10416 | 914 | 914 | 7.19% | 8.77% | 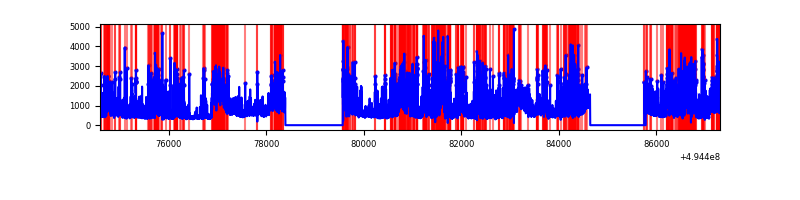 |
| D | 12719 | 10415 | 4954 | 4954 | 38.95% | 47.57% | 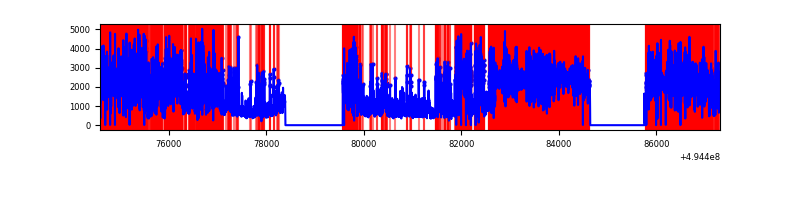 |
Top three noisy pixels from each quadrant. If the there are fewer than three noisy pixels in the level2.evt file, extra rows are filled as -1
| Pixel properties | Quadrant properties | ||||||
|---|---|---|---|---|---|---|---|
| Quadrant | DetID | PixID | Counts | Sigma | Mean | Median | Sigma |
| A | 3 | 63 | 21284767 | 167172.23 | 506 | 494 | 127.3 |
| A | 3 | 78 | 2164078 | 16993.35 | 506 | 494 | 127.3 |
| A | 8 | 245 | 343428 | 2693.49 | 506 | 494 | 127.3 |
| B | 5 | 185 | 876103 | 3690.58 | 1115 | 1078 | 237.1 |
| B | 1 | 223 | 240616 | 1010.3 | 1115 | 1078 | 237.1 |
| B | 10 | 254 | 159958 | 670.11 | 1115 | 1078 | 237.1 |
| C | 15 | 224 | 3175933 | 11091.23 | 1044 | 1038 | 286.3 |
| C | 15 | 158 | 1284308 | 4483.0 | 1044 | 1038 | 286.3 |
| C | 15 | 219 | 439444 | 1531.53 | 1044 | 1038 | 286.3 |
| D | 8 | 176 | 7082121 | 33560.38 | 737 | 705 | 211.0 |
| D | 2 | 62 | 4469017 | 21176.31 | 737 | 705 | 211.0 |
| D | 2 | 172 | 3179745 | 15066.17 | 737 | 705 | 211.0 |
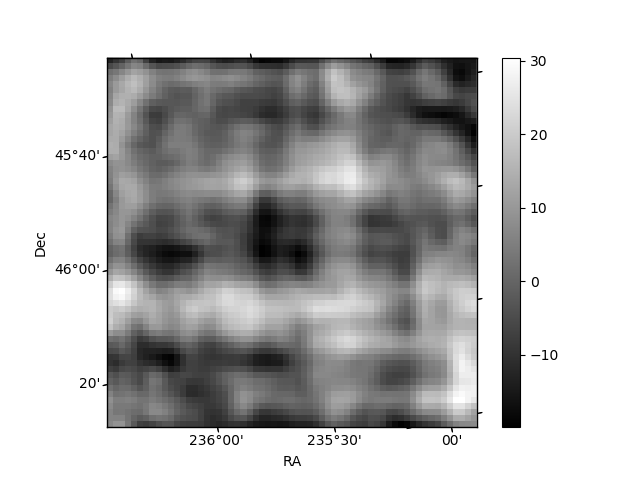
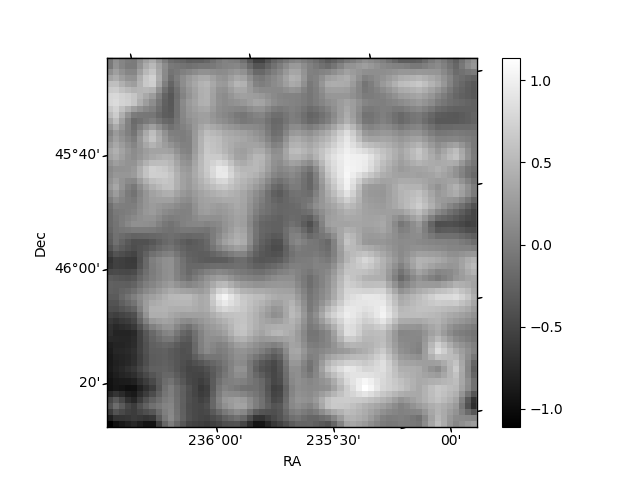
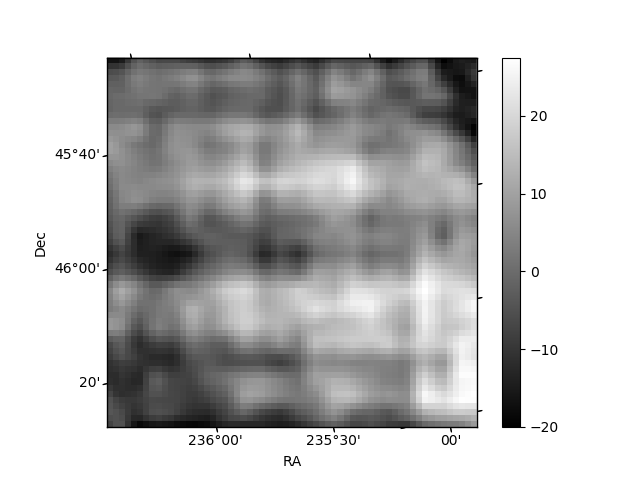
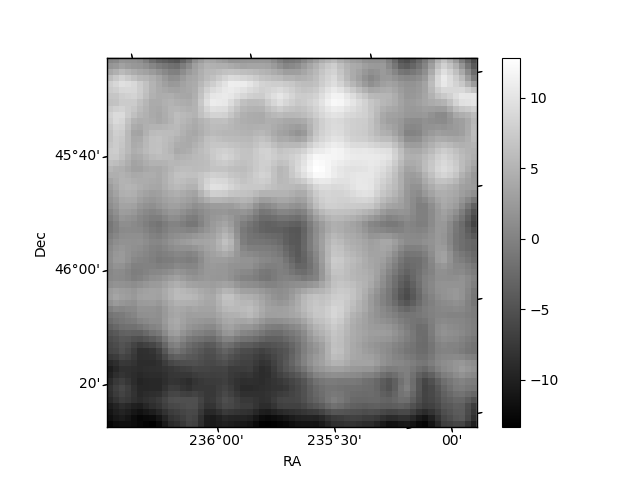
Histogram calculated using DETX and DETY for each event in the final _common_clean file
| Quadrant A | 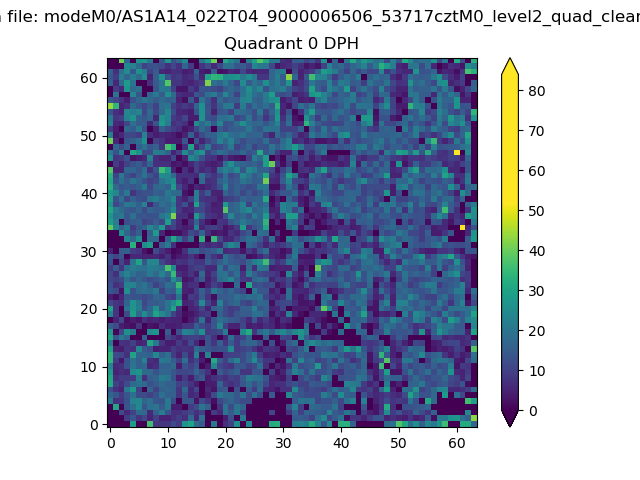 |
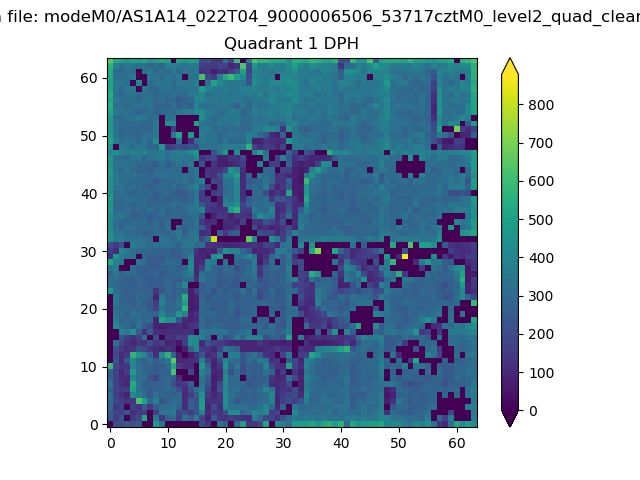 |
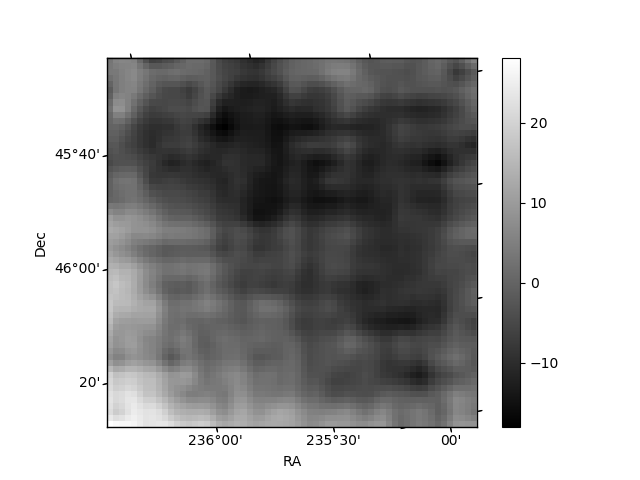
Quadrant B |
|---|---|---|---|
| Quadrant D | 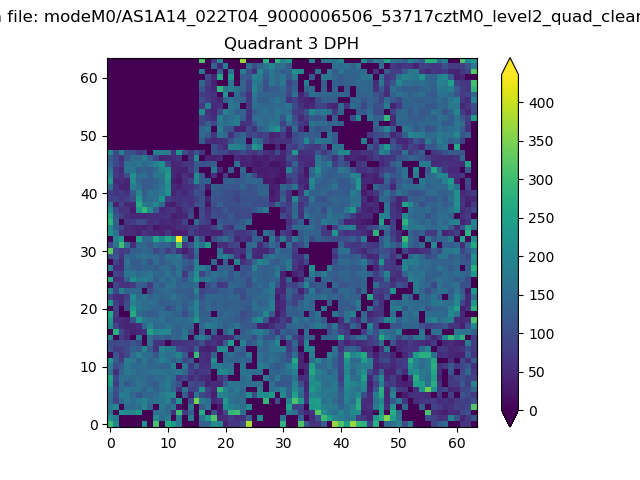 |
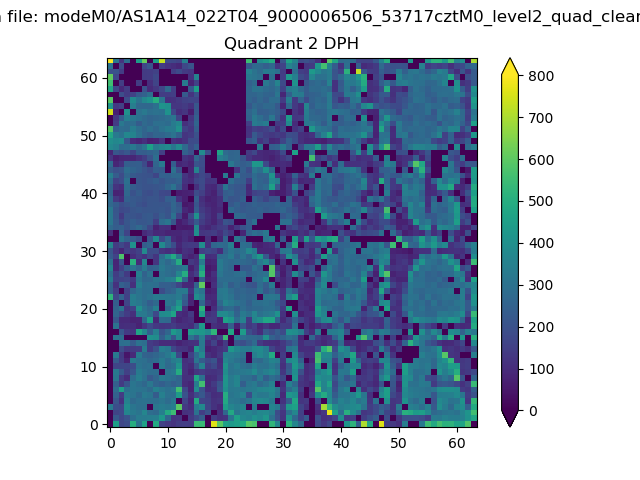 |
Quadrant C |
| Plot type | Count rate plots | Images |
|---|---|---|
| Comparison with Poisson distribution Blue bars denote a histogram of data divided into 1 sec bins. Red curve is a Poisson curve with rate = median count rate of data. |
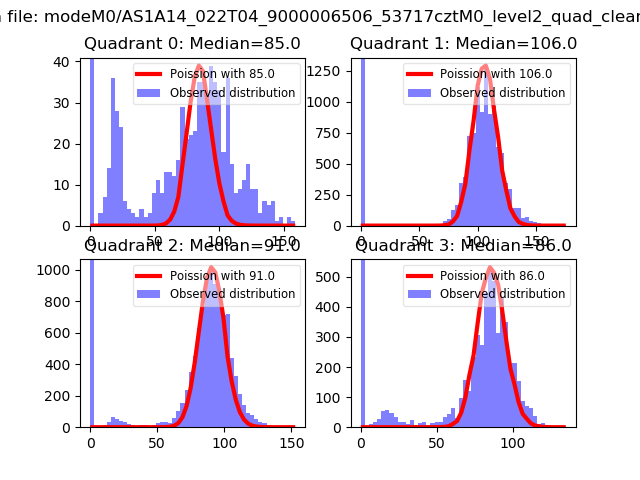 |
 |
| Quadrant-wise count rates Data is divided into 100 sec bins |
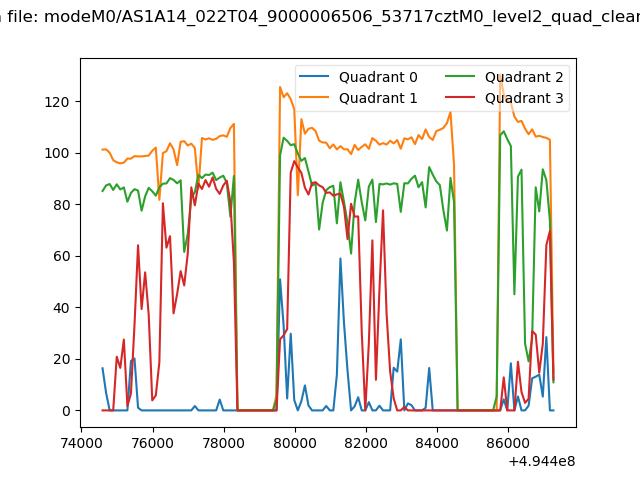 |
|
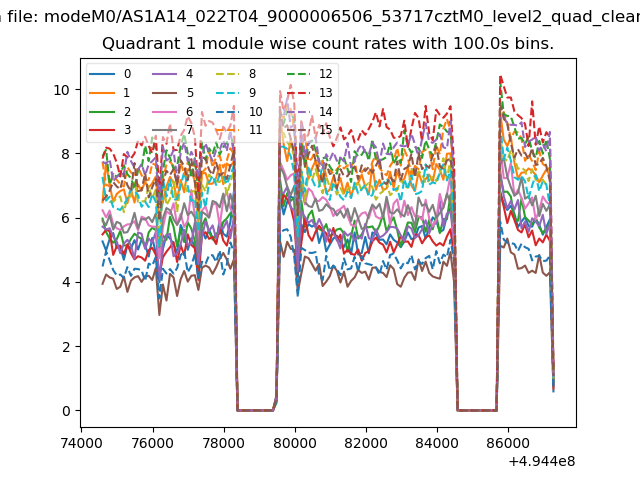
| Module-wise count rates for Quadrant A Data is divided into 100 sec bins |
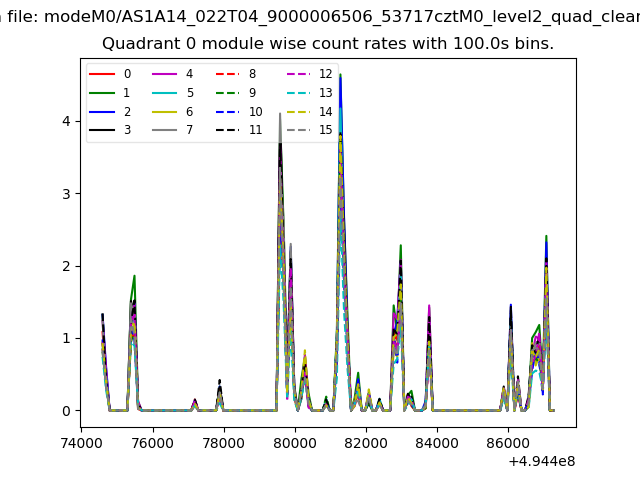 |
 |
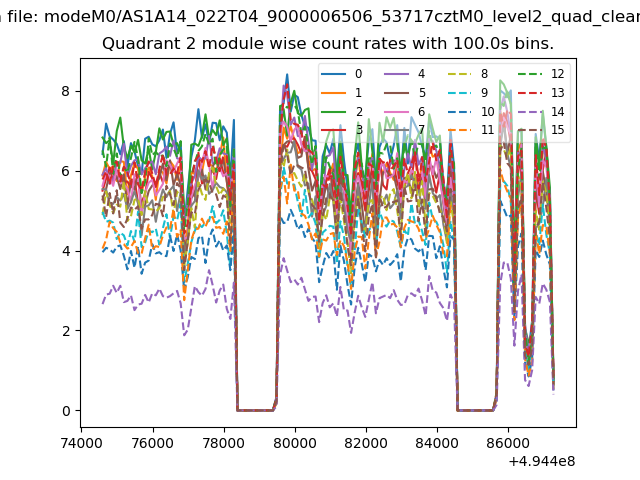
| Module-wise count rates for Quadrant B Data is divided into 100 sec bins |
 |
 |
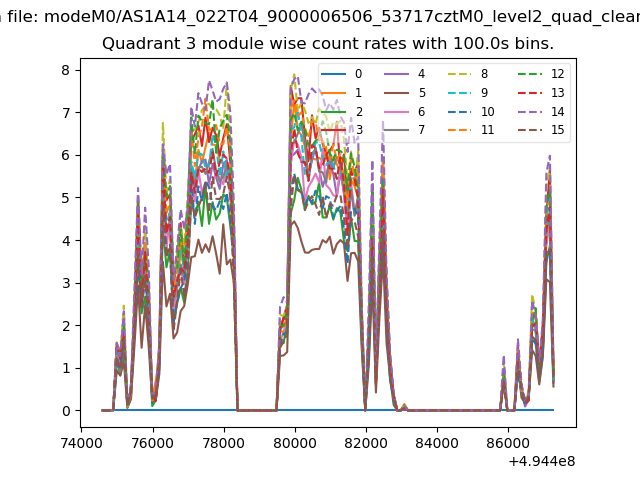
| Module-wise count rates for Quadrant C Data is divided into 100 sec bins |
 |
 |
| Module-wise count rates for Quadrant D Data is divided into 100 sec bins |
 |
 |
| Parameter | Plot |
|---|---|
| CZT HV Monitor | 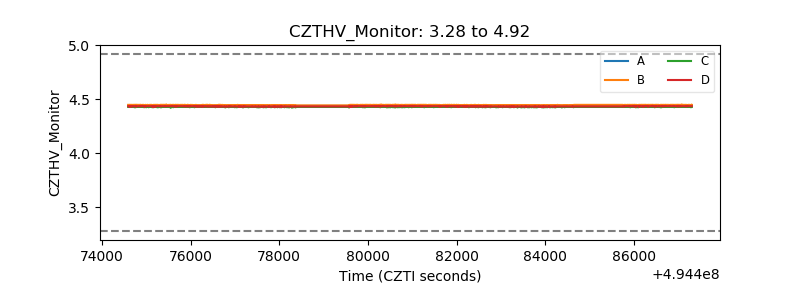 |
| D_VDD | 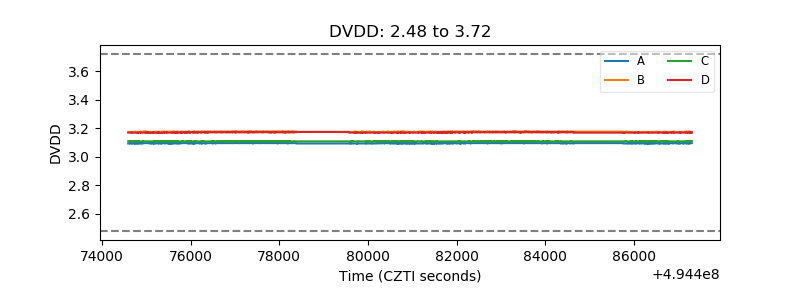 |
| Temperature 1 | 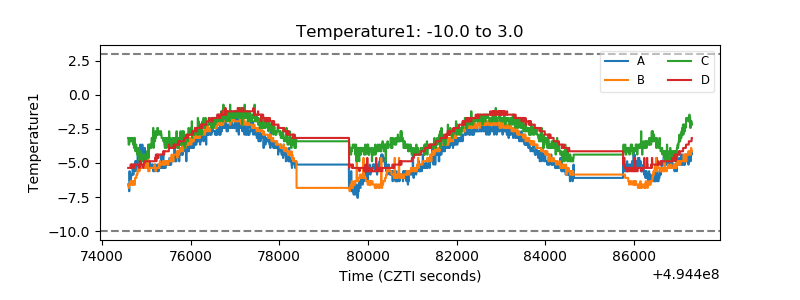 |
| Veto HV Monitor | 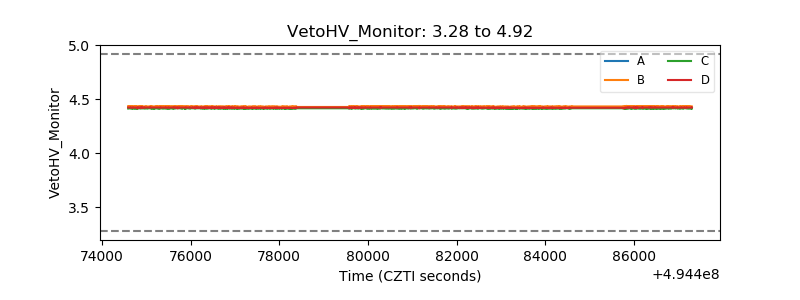 |
| Veto LLD | 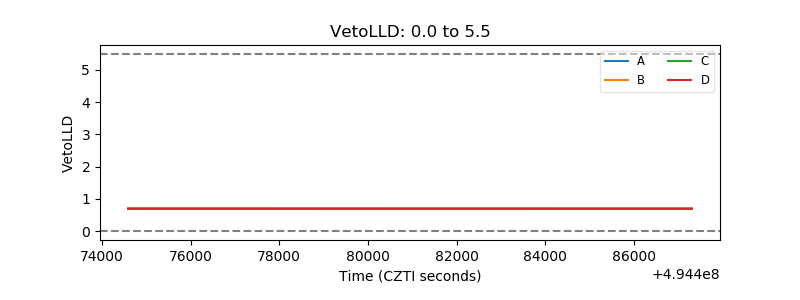 |
| Alpha Counter | 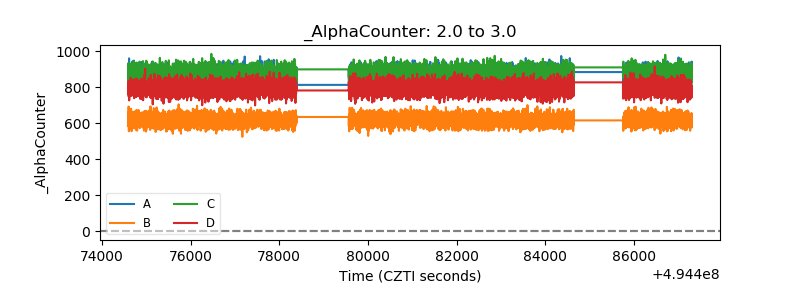 |
| _CPM_Rate | 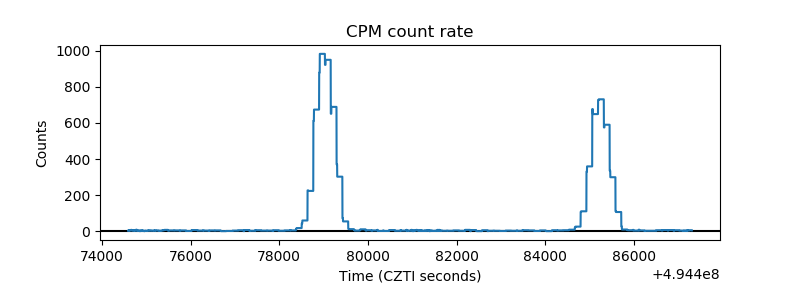 |
| CZT Counter | 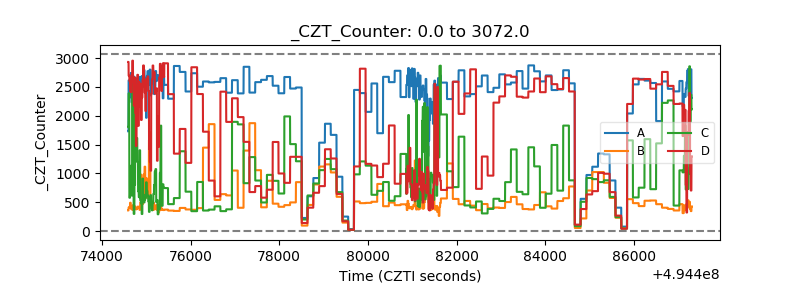 |
| +2.5 Volts monitor | 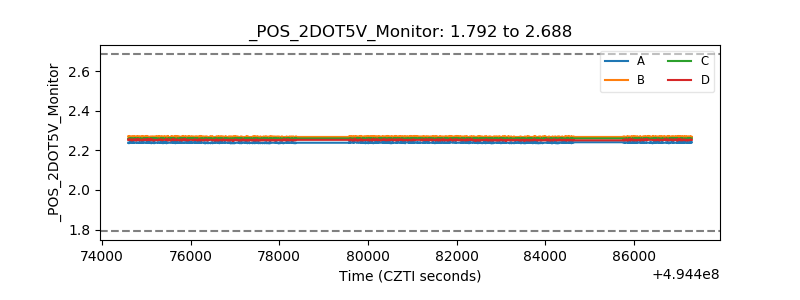 |
| +5 Volts monitor | 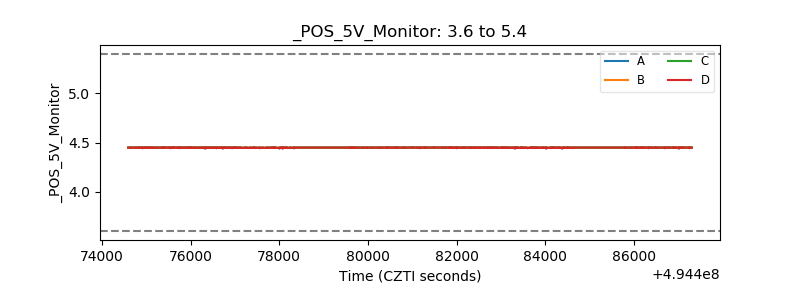 |
| _ROLL_ROT | 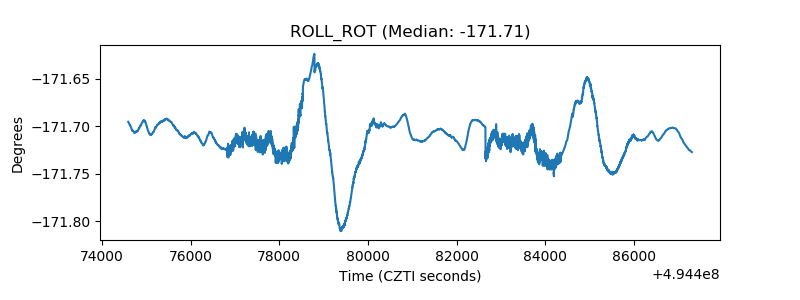 |
| _Roll_DEC | 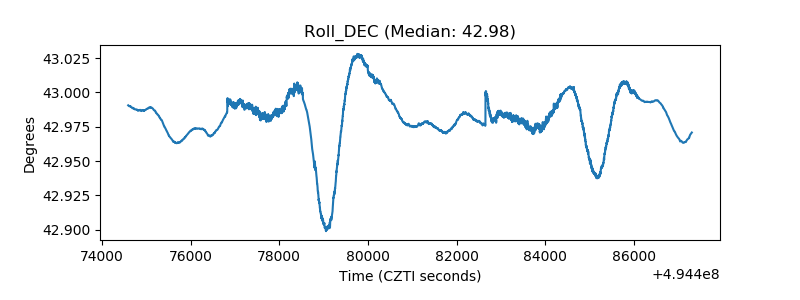 |
| _Roll_RA | 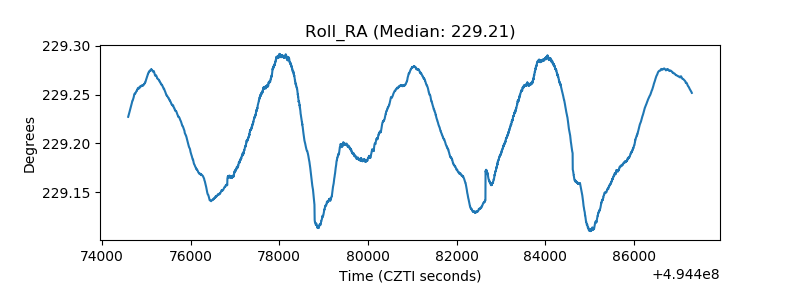 |
| Veto Counter | 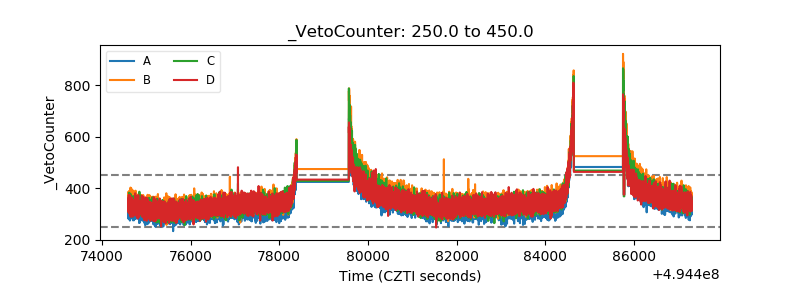 |