| Param | Original file | Final file |
|---|---|---|
| Filename | modeM0/AS1A14_022T04_9000006506_53718cztM0_level2.fits | modeM0/AS1A14_022T04_9000006506_53718cztM0_level2_quad_clean.evt |
| Size (bytes) | 1,009,249,920 | 54,645,120 |
| Size | 962.5 MB | 52.1 MB |
| Events in quadrant A | 14,304,666 | 72,777 |
| Events in quadrant B | 2,894,951 | 619,287 |
| Events in quadrant C | 7,835,696 | 356,415 |
| Events in quadrant D | 11,864,540 | 190,687 |
| Mode M0 | |||
|---|---|---|---|
| Quadrant | BADHDUFLAG | Total packets | Discarded packets |
| A | 0 | 46666 | 3 |
| B | 0 | 12845 | 1 |
| C | 0 | 27430 | 1 |
| D | 0 | 39334 | 1 |
| Mode SS | |||
|---|---|---|---|
| Quadrant | BADHDUFLAG | Total packets | Discarded packets |
| A | 0 | 122 | 0 |
| B | 0 | 122 | 0 |
| C | 0 | 122 | 0 |
| D | 0 | 122 | 0 |
| Mode M9 | |||
|---|---|---|---|
| Quadrant | BADHDUFLAG | Total packets | Discarded packets |
| A | 0 | 10 | 0 |
| B | 0 | 10 | 0 |
| C | 0 | 10 | 0 |
| D | 0 | 10 | 0 |
| Quadrant | Total seconds | Saturated seconds | Saturation percentage |
|---|---|---|---|
| A | 5938 | 5313 | 89.474571% |
| B | 5939 | 159 | 2.677218% |
| C | 5939 | 2386 | 40.175114% |
| D | 5939 | 4041 | 68.041758% |
Noise dominated data is calculated using 1-second bins in cleaned event files. If a bin has >2000 counts, and if more than 50% of those come from <1% of pixels, then it is considered to be noise-dominated and hence unusable.
| Quadrant | # 1 sec bins | Bins with >0 counts | Bins with >2000 counts | High rate bins dominated by noise | Noise dominated (total time) | Noise dominated (detector-on time) | Marked lightcurve |
|---|---|---|---|---|---|---|---|
| A | 7023 | 5937 | 5014 | 5014 | 71.39% | 84.45% | 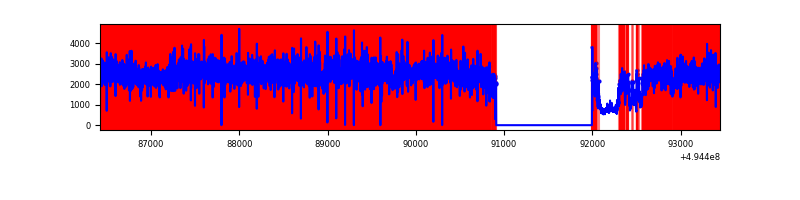 |
| B | 7024 | 5940 | 11 | 11 | 0.16% | 0.19% | 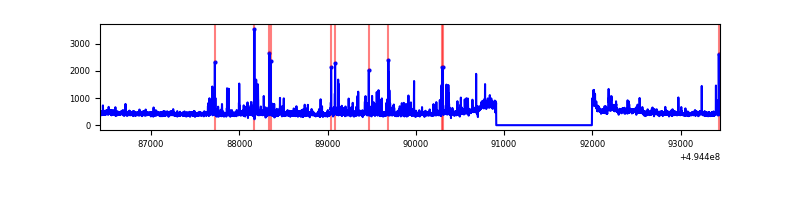 |
| C | 7024 | 5937 | 1148 | 1148 | 16.34% | 19.34% | 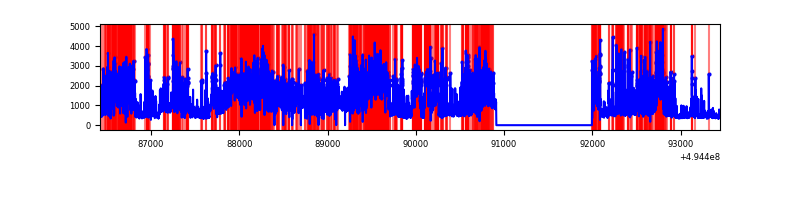 |
| D | 7024 | 5940 | 3277 | 3277 | 46.65% | 55.17% | 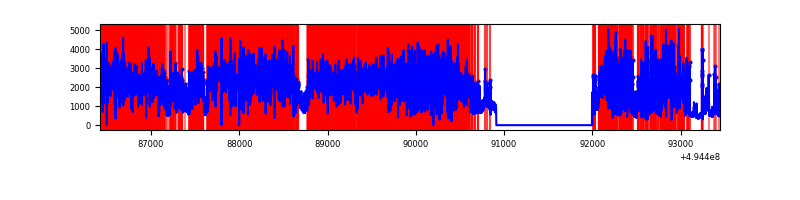 |
Top three noisy pixels from each quadrant. If the there are fewer than three noisy pixels in the level2.evt file, extra rows are filled as -1
| Pixel properties | Quadrant properties | ||||||
|---|---|---|---|---|---|---|---|
| Quadrant | DetID | PixID | Counts | Sigma | Mean | Median | Sigma |
| A | 3 | 63 | 10611742 | 127790.34 | 329 | 322 | 83.0 |
| A | 3 | 78 | 1846956 | 22238.49 | 329 | 322 | 83.0 |
| A | 8 | 245 | 246759 | 2967.77 | 329 | 322 | 83.0 |
| B | 1 | 223 | 107441 | 773.2 | 640 | 619 | 138.2 |
| B | 5 | 185 | 93897 | 675.17 | 640 | 619 | 138.2 |
| B | 5 | 32 | 50071 | 357.94 | 640 | 619 | 138.2 |
| C | 15 | 224 | 2955169 | 21838.61 | 488 | 485 | 135.3 |
| C | 15 | 219 | 1633711 | 12071.47 | 488 | 485 | 135.3 |
| C | 15 | 158 | 402226 | 2969.34 | 488 | 485 | 135.3 |
| D | 2 | 172 | 6211538 | 51246.38 | 413 | 393 | 121.2 |
| D | 8 | 176 | 2999469 | 24744.52 | 413 | 393 | 121.2 |
| D | 1 | 241 | 361507 | 2979.45 | 413 | 393 | 121.2 |
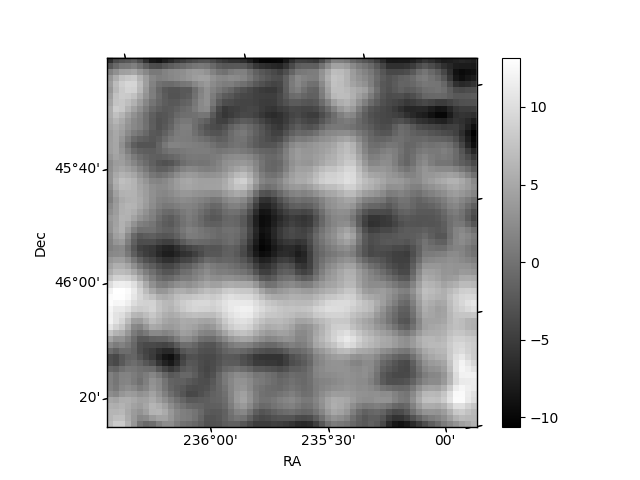
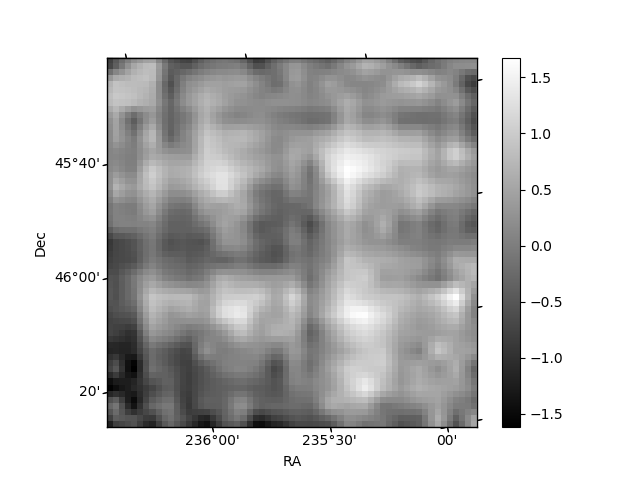
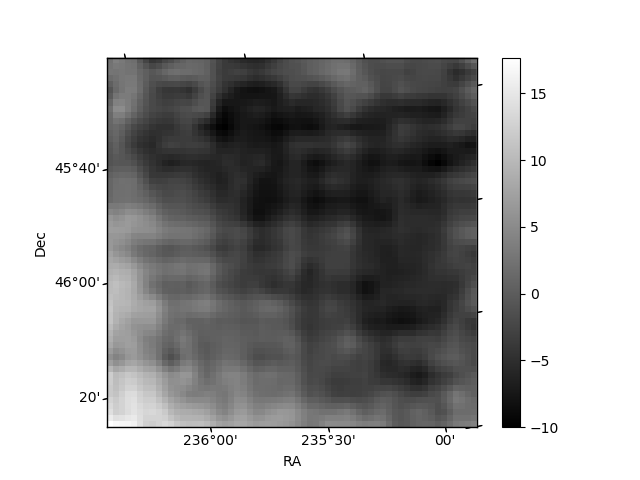
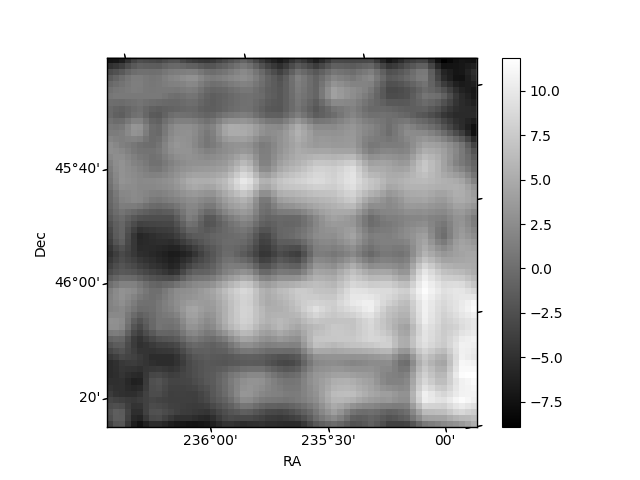
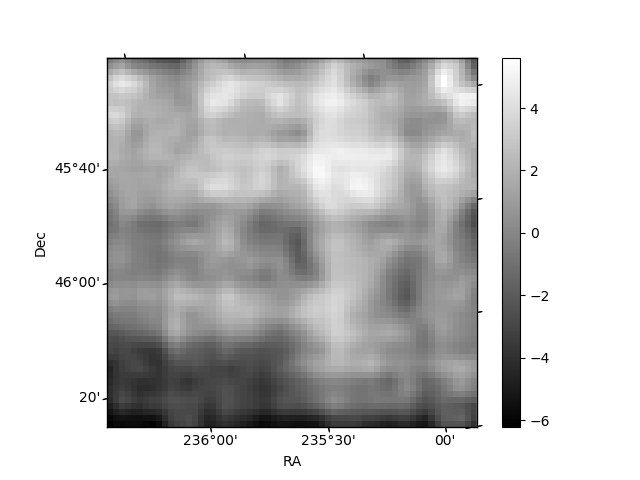
Histogram calculated using DETX and DETY for each event in the final _common_clean file
| Quadrant A | 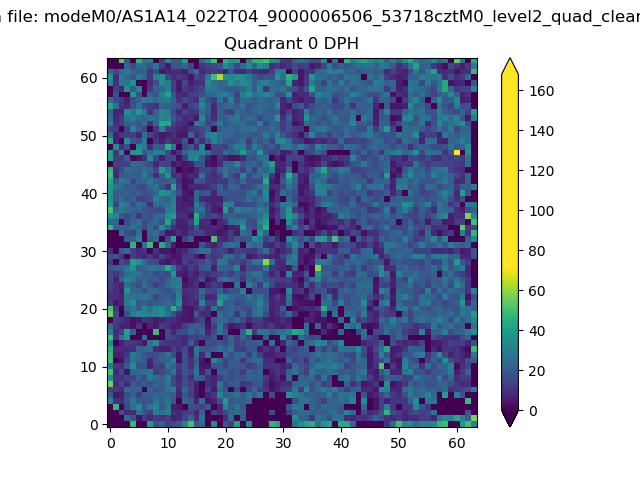 |
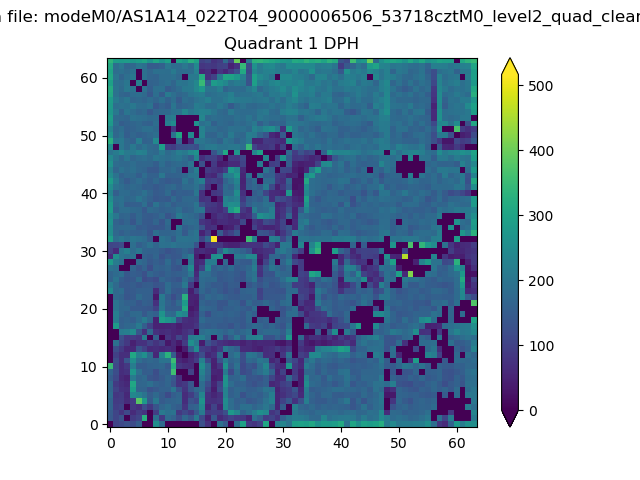 |
Quadrant B |
|---|---|---|---|
| Quadrant D | 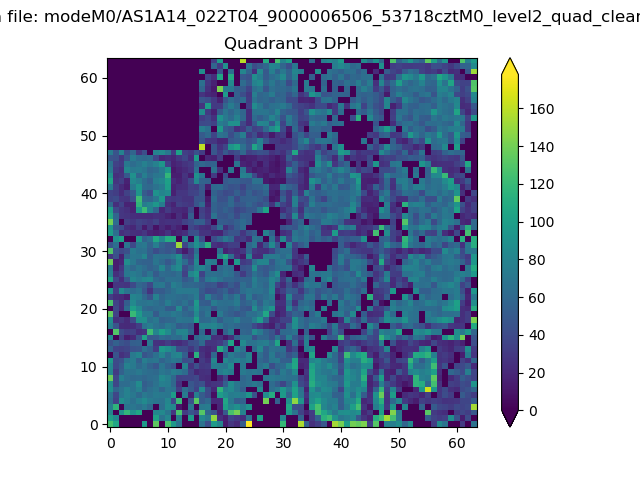 |
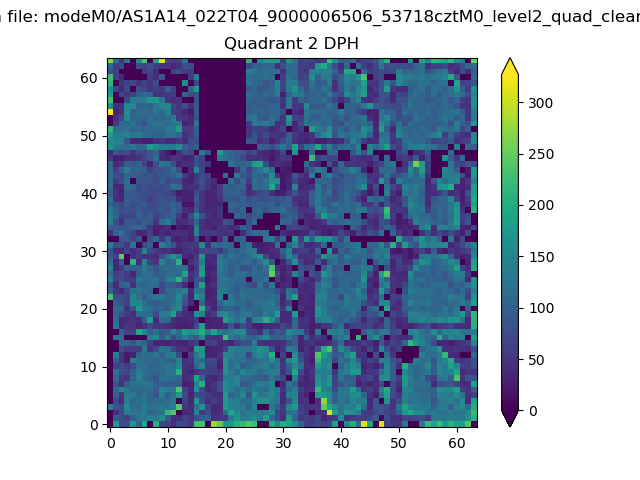 |
Quadrant C |
| Plot type | Count rate plots | Images |
|---|---|---|
| Comparison with Poisson distribution Blue bars denote a histogram of data divided into 1 sec bins. Red curve is a Poisson curve with rate = median count rate of data. |
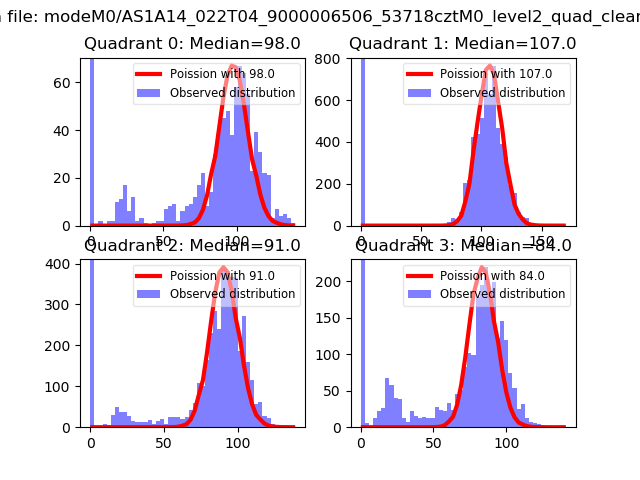 |
 |
| Quadrant-wise count rates Data is divided into 100 sec bins |
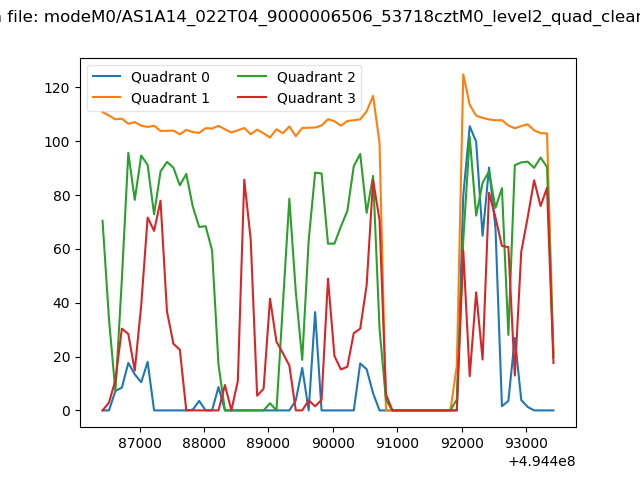 |
|
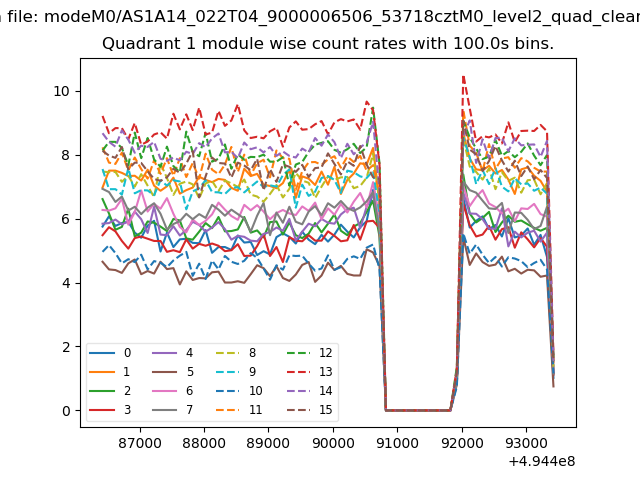
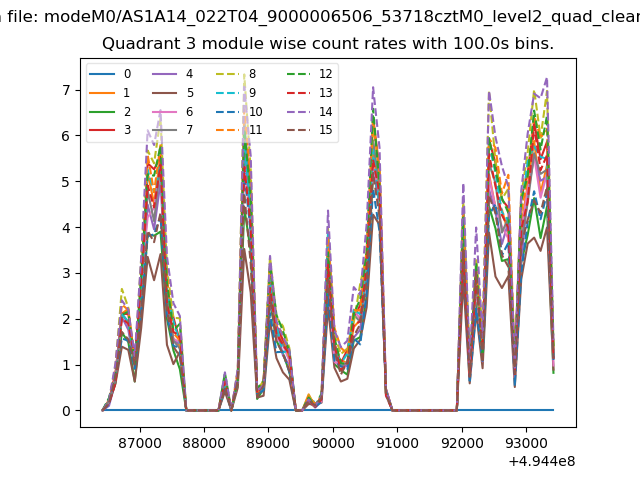
| Module-wise count rates for Quadrant A Data is divided into 100 sec bins |
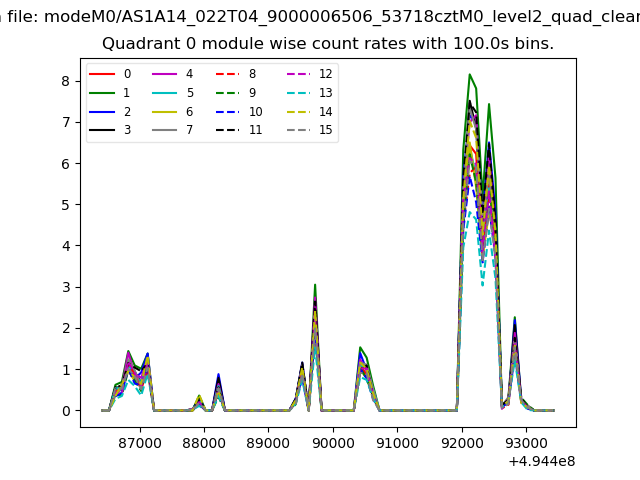 |
 |
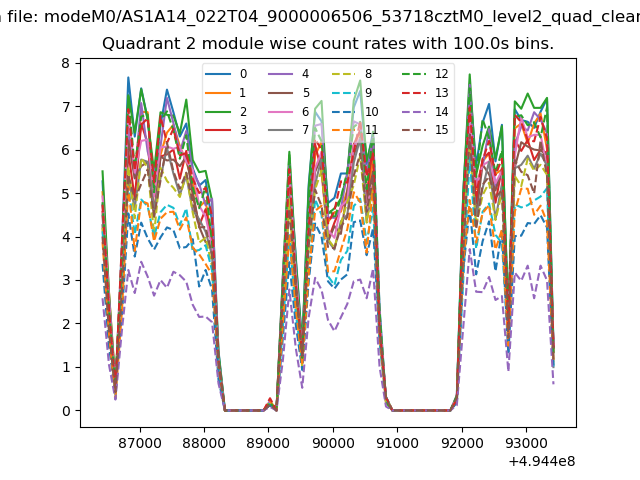
| Module-wise count rates for Quadrant B Data is divided into 100 sec bins |
 |
 |
| Module-wise count rates for Quadrant C Data is divided into 100 sec bins |
 |
 |
| Module-wise count rates for Quadrant D Data is divided into 100 sec bins |
 |
 |
| Parameter | Plot |
|---|---|
| CZT HV Monitor | 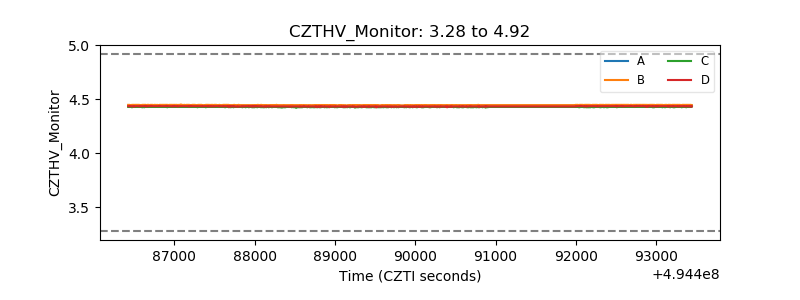 |
| D_VDD | 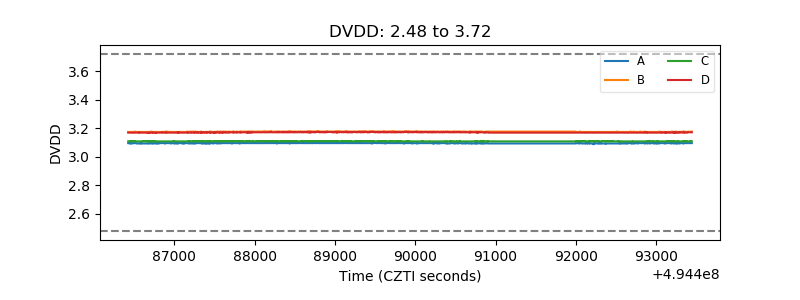 |
| Temperature 1 | 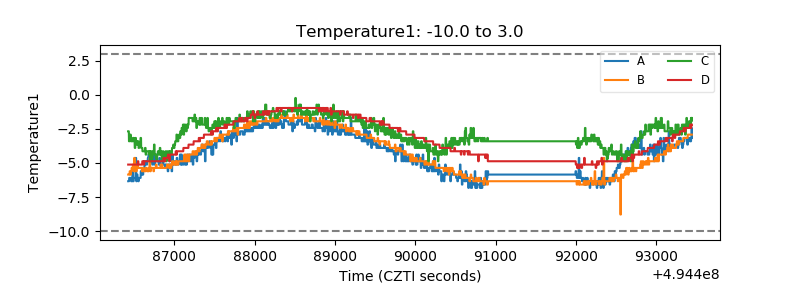 |
| Veto HV Monitor | 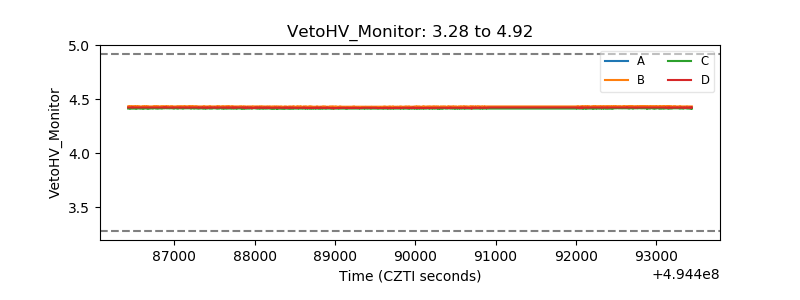 |
| Veto LLD | 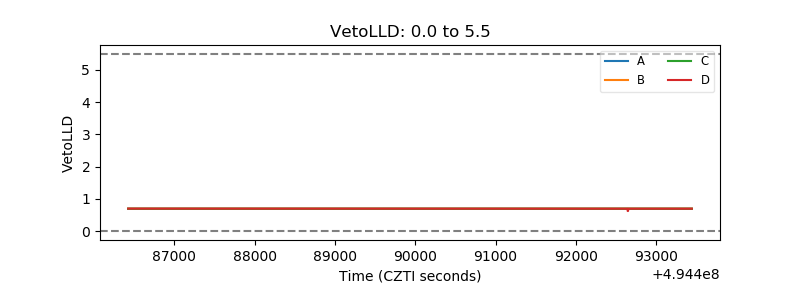 |
| Alpha Counter | 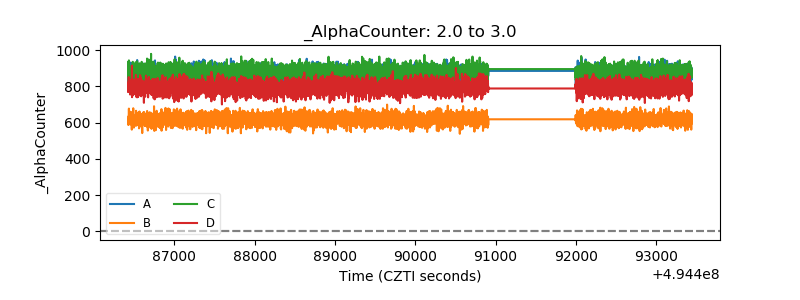 |
| _CPM_Rate | 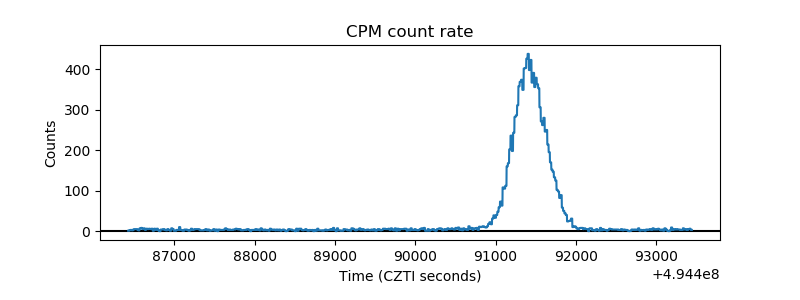 |
| CZT Counter | 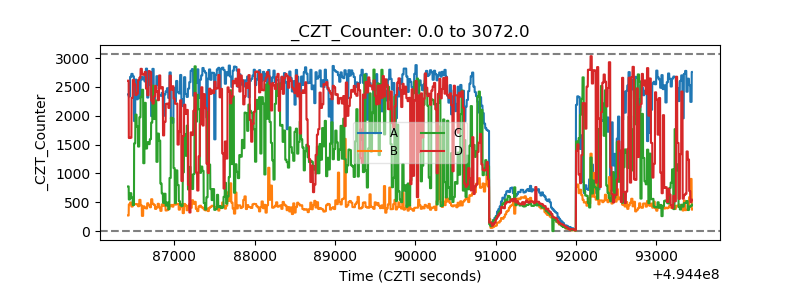 |
| +2.5 Volts monitor |  |
| +5 Volts monitor | 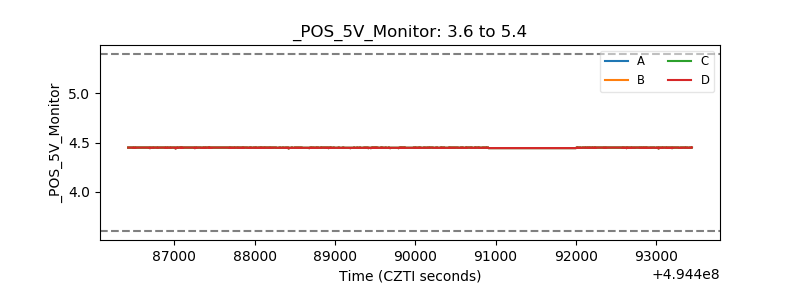 |
| _ROLL_ROT | 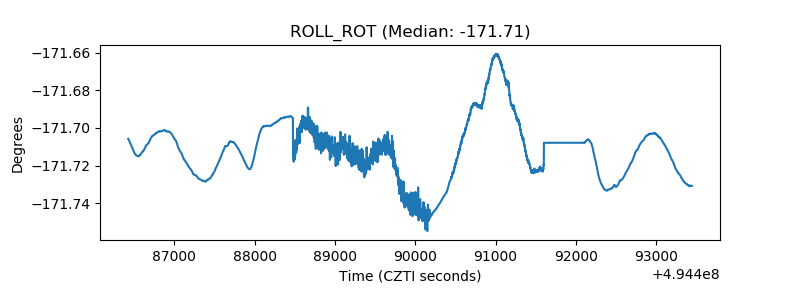 |
| _Roll_DEC | 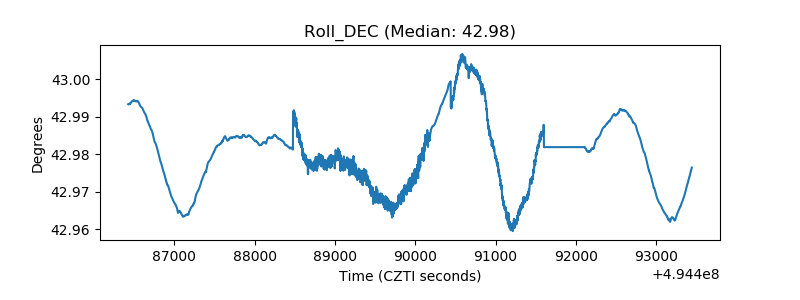 |
| _Roll_RA | 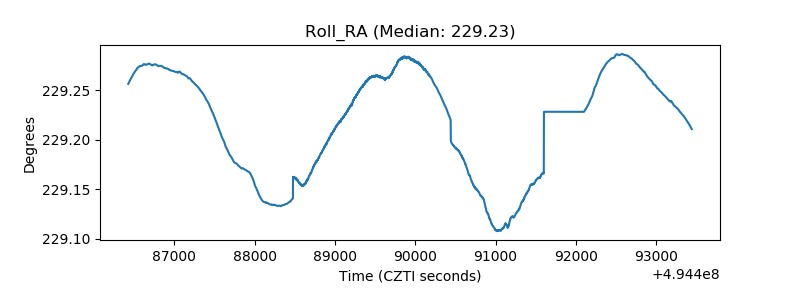 |
| Veto Counter | 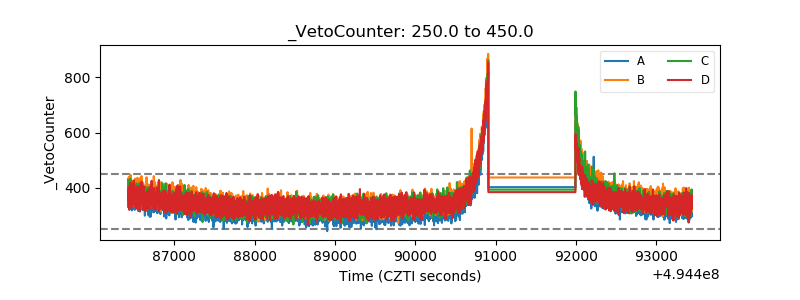 |