| Param | Original file | Final file |
|---|---|---|
| Filename | modeM0/AS1A14_022T04_9000006506_53719cztM0_level2.fits | modeM0/AS1A14_022T04_9000006506_53719cztM0_level2_quad_clean.evt |
| Size (bytes) | 738,328,320 | 46,998,720 |
| Size | 704.1 MB | 44.8 MB |
| Events in quadrant A | 9,530,969 | 142,775 |
| Events in quadrant B | 2,393,176 | 498,170 |
| Events in quadrant C | 5,632,115 | 334,571 |
| Events in quadrant D | 9,409,148 | 113,914 |
| Mode M0 | |||
|---|---|---|---|
| Quadrant | BADHDUFLAG | Total packets | Discarded packets |
| A | 0 | 38554 | 7132 |
| B | 0 | 11839 | 1057 |
| C | 0 | 23300 | 3259 |
| D | 0 | 36686 | 5653 |
| Mode SS | |||
|---|---|---|---|
| Quadrant | BADHDUFLAG | Total packets | Discarded packets |
| A | 0 | 112 | 10 |
| B | 0 | 112 | 0 |
| C | 0 | 112 | 6 |
| D | 0 | 112 | 4 |
| Mode M9 | |||
|---|---|---|---|
| Quadrant | BADHDUFLAG | Total packets | Discarded packets |
| A | 0 | 3 | 0 |
| B | 0 | 3 | 0 |
| C | 0 | 3 | 0 |
| D | 0 | 3 | 0 |
| Quadrant | Total seconds | Saturated seconds | Saturation percentage |
|---|---|---|---|
| A | 4468 | 3085 | 69.046553% |
| B | 4982 | 147 | 2.950622% |
| C | 4782 | 1230 | 25.721455% |
| D | 4602 | 3370 | 73.229031% |
Noise dominated data is calculated using 1-second bins in cleaned event files. If a bin has >2000 counts, and if more than 50% of those come from <1% of pixels, then it is considered to be noise-dominated and hence unusable.
| Quadrant | # 1 sec bins | Bins with >0 counts | Bins with >2000 counts | High rate bins dominated by noise | Noise dominated (total time) | Noise dominated (detector-on time) | Marked lightcurve |
|---|---|---|---|---|---|---|---|
| A | 7607 | 4919 | 2636 | 2636 | 34.65% | 53.59% | 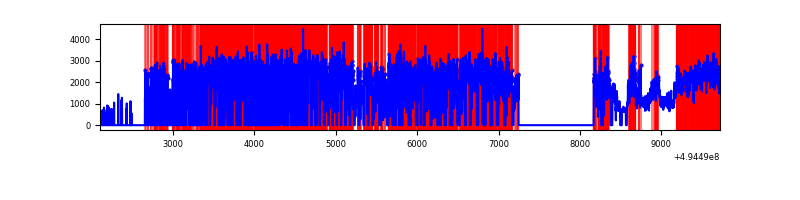 |
| B | 7613 | 5302 | 12 | 12 | 0.16% | 0.23% | 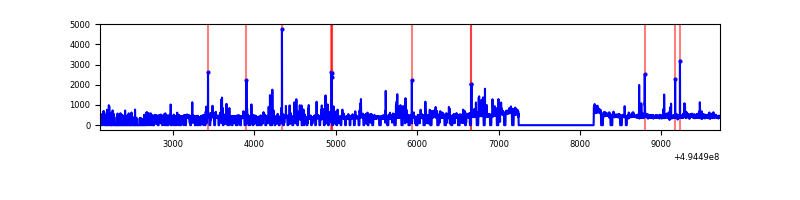 |
| C | 7612 | 5135 | 739 | 739 | 9.71% | 14.39% | 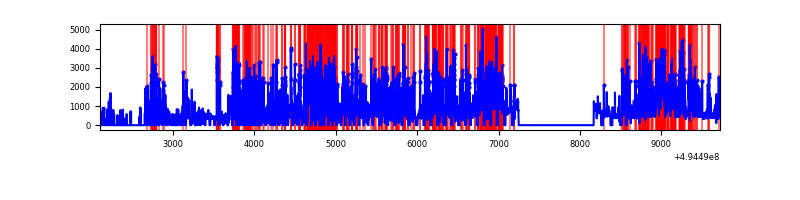 |
| D | 7607 | 4936 | 2692 | 2692 | 35.39% | 54.54% | 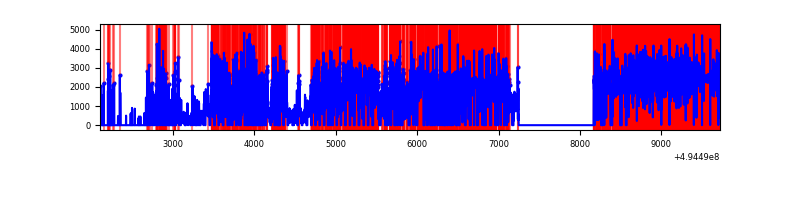 |
Top three noisy pixels from each quadrant. If the there are fewer than three noisy pixels in the level2.evt file, extra rows are filled as -1
| Pixel properties | Quadrant properties | ||||||
|---|---|---|---|---|---|---|---|
| Quadrant | DetID | PixID | Counts | Sigma | Mean | Median | Sigma |
| A | 3 | 63 | 7232573 | 88348.31 | 327 | 318 | 81.9 |
| A | 3 | 78 | 601171 | 7339.94 | 327 | 318 | 81.9 |
| A | 7 | 206 | 213338 | 2602.23 | 327 | 318 | 81.9 |
| B | 5 | 185 | 112002 | 978.12 | 530 | 511 | 114.0 |
| B | 6 | 255 | 36201 | 313.11 | 530 | 511 | 114.0 |
| B | 10 | 247 | 27334 | 235.32 | 530 | 511 | 114.0 |
| C | 15 | 224 | 2006475 | 16484.59 | 443 | 439 | 121.7 |
| C | 15 | 219 | 755406 | 6203.94 | 443 | 439 | 121.7 |
| C | 15 | 158 | 314198 | 2578.31 | 443 | 439 | 121.7 |
| D | 2 | 172 | 7410951 | 98098.0 | 258 | 246 | 75.5 |
| D | 8 | 176 | 366783 | 4851.97 | 258 | 246 | 75.5 |
| D | 1 | 241 | 310242 | 4103.52 | 258 | 246 | 75.5 |
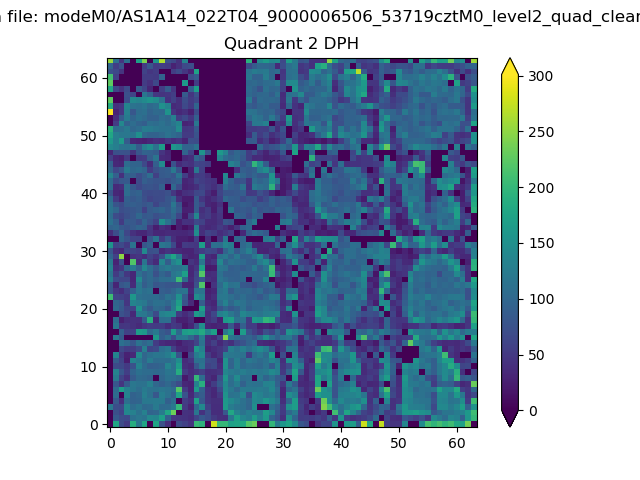
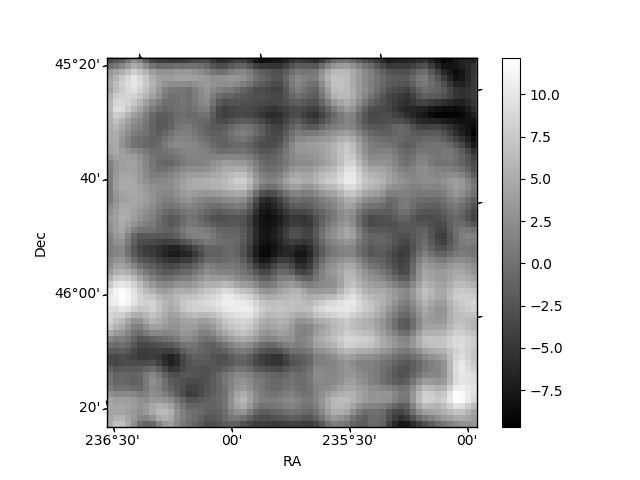
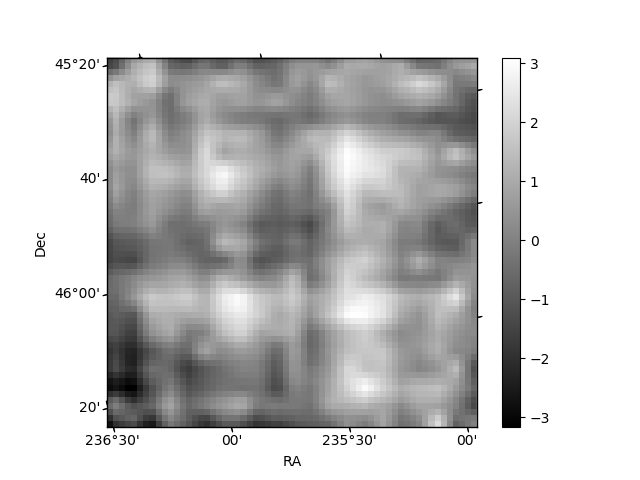
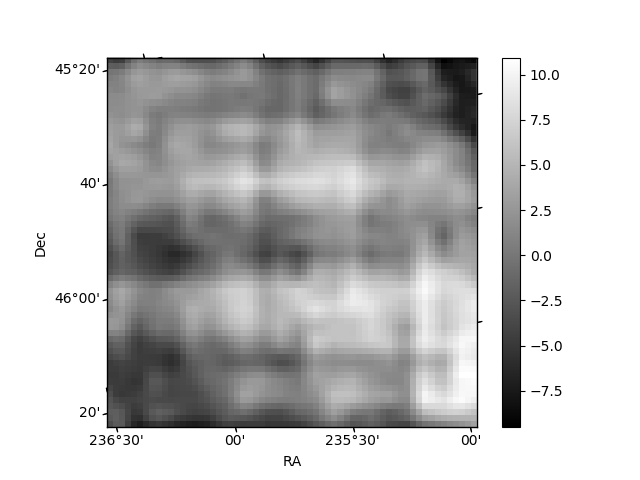
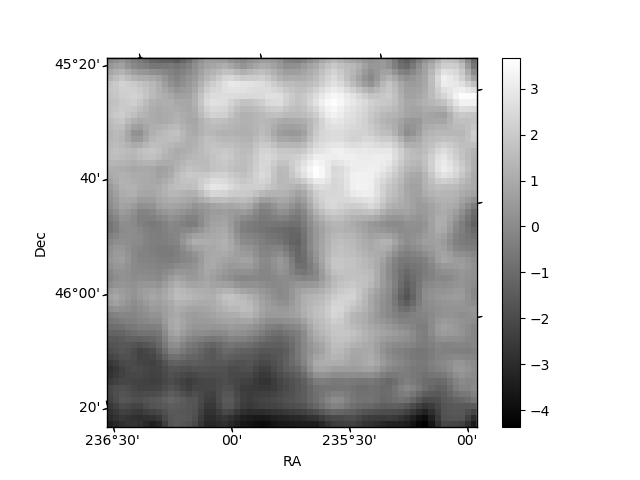
Histogram calculated using DETX and DETY for each event in the final _common_clean file
| Quadrant A | 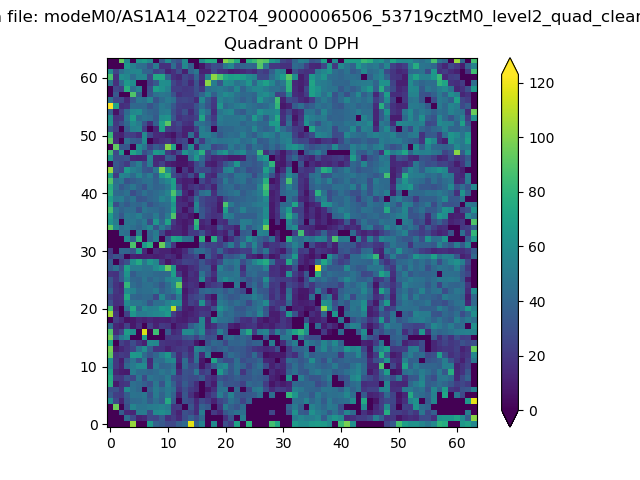 |
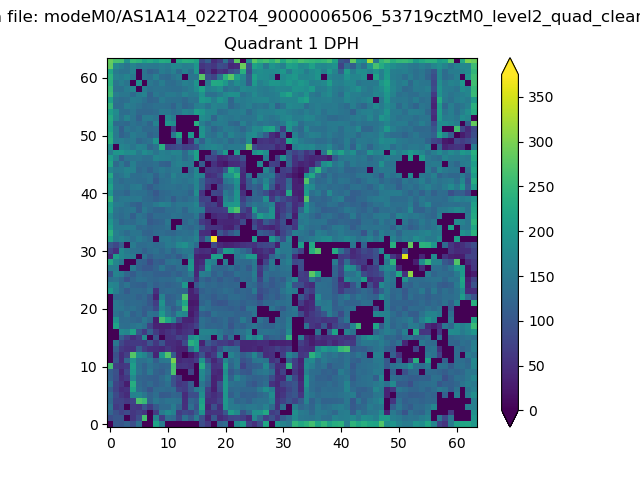 |
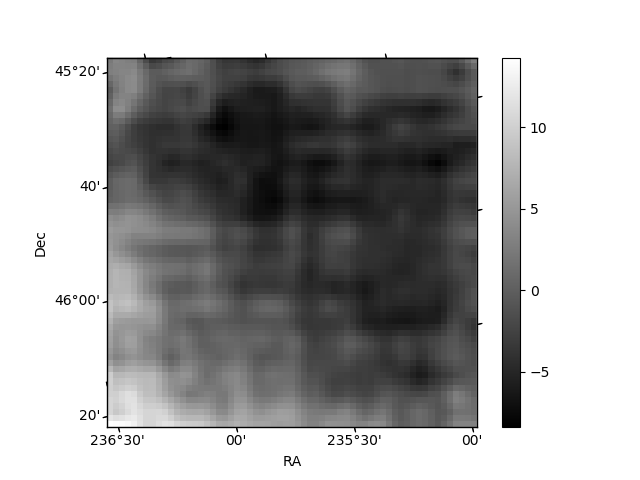
Quadrant B |
|---|---|---|---|
| Quadrant D | 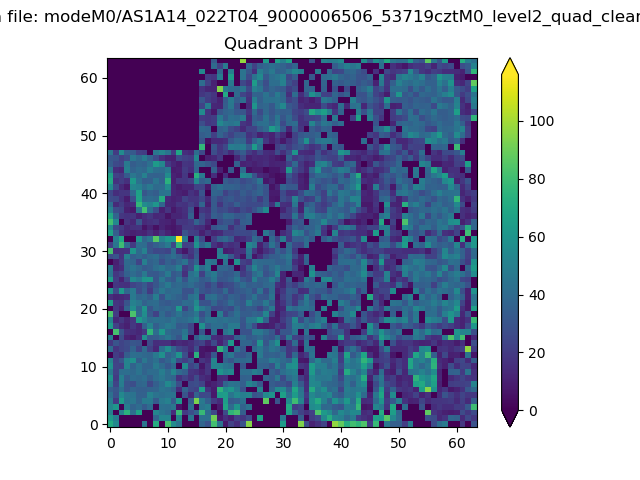 |
 |
Quadrant C |
| Plot type | Count rate plots | Images |
|---|---|---|
| Comparison with Poisson distribution Blue bars denote a histogram of data divided into 1 sec bins. Red curve is a Poisson curve with rate = median count rate of data. |
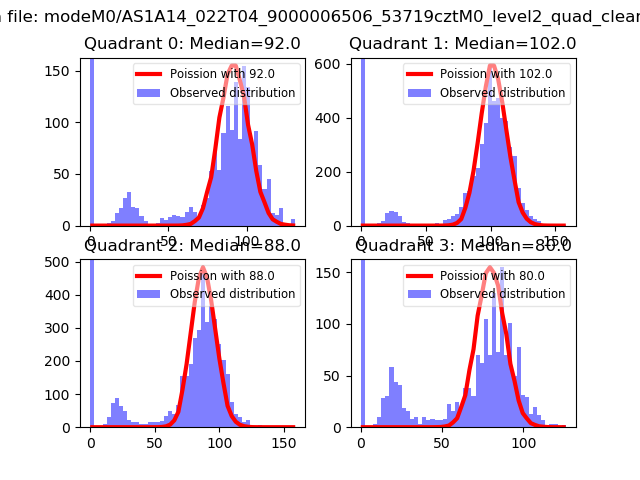 |
 |
| Quadrant-wise count rates Data is divided into 100 sec bins |
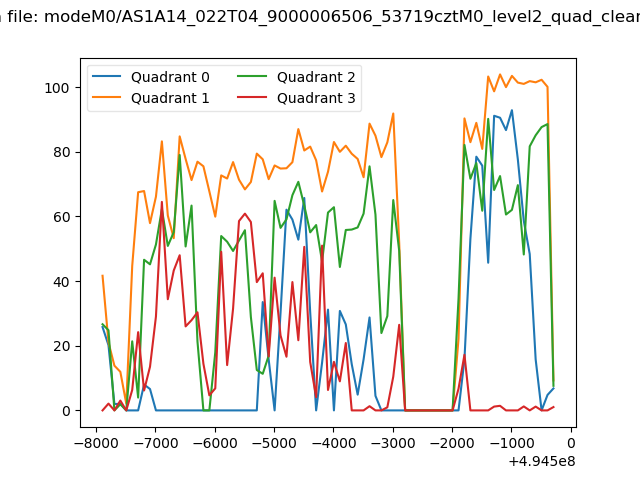 |
|
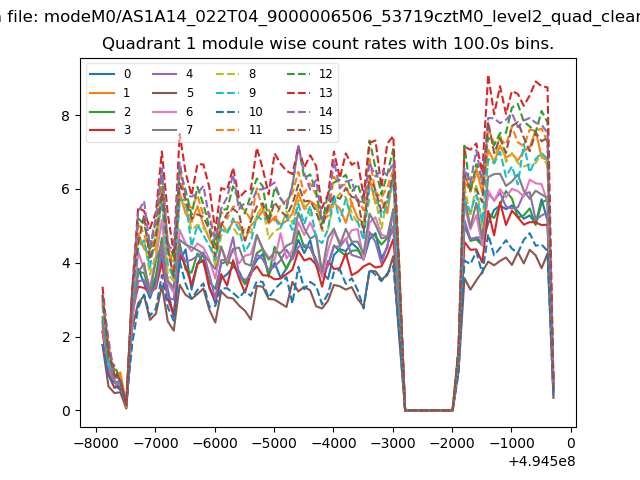
| Module-wise count rates for Quadrant A Data is divided into 100 sec bins |
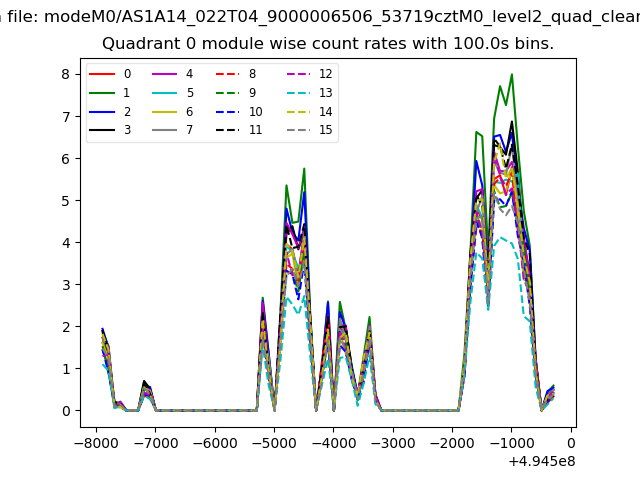 |
 |
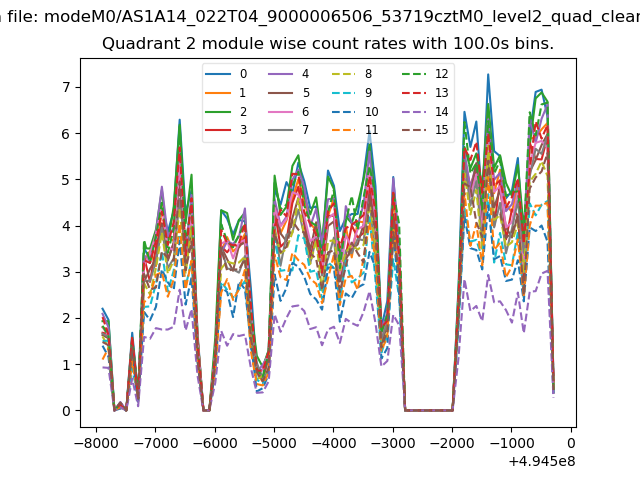
| Module-wise count rates for Quadrant B Data is divided into 100 sec bins |
 |
 |
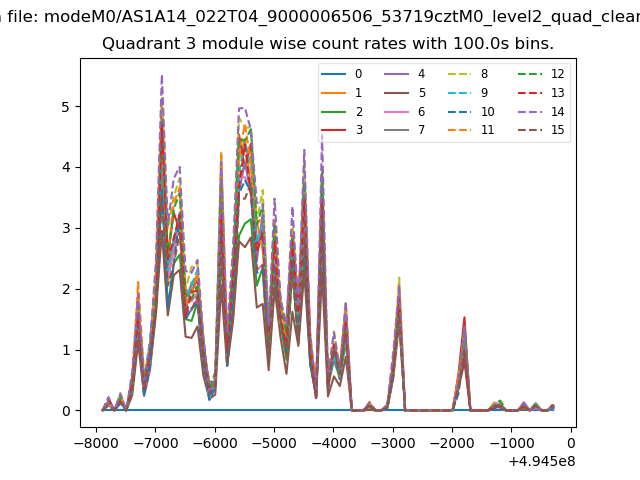
| Module-wise count rates for Quadrant C Data is divided into 100 sec bins |
 |
 |
| Module-wise count rates for Quadrant D Data is divided into 100 sec bins |
 |
 |
| Parameter | Plot |
|---|---|
| CZT HV Monitor | 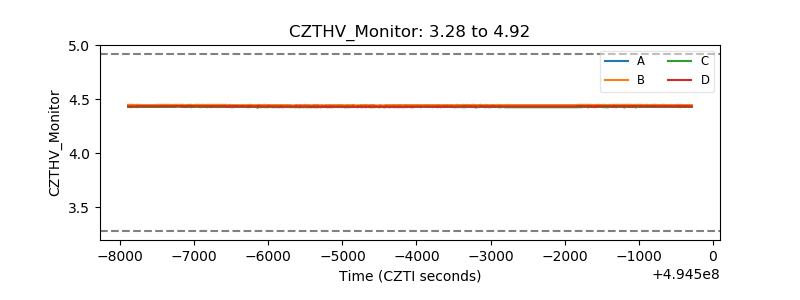 |
| D_VDD | 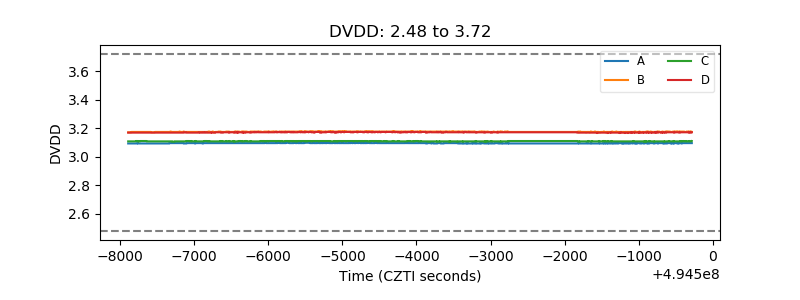 |
| Temperature 1 | 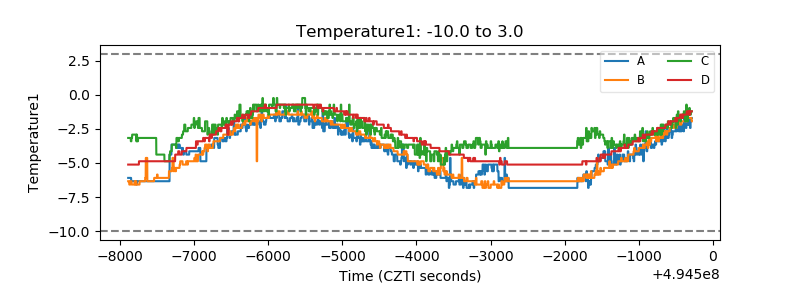 |
| Veto HV Monitor | 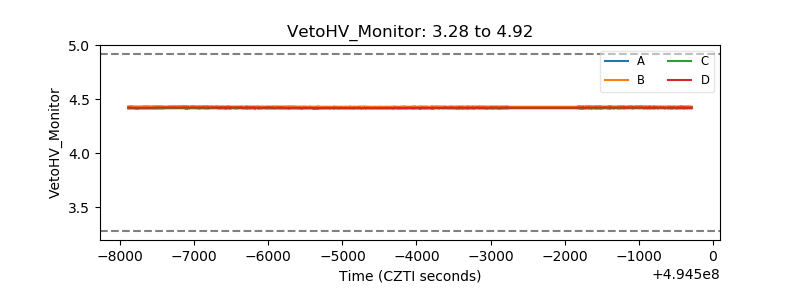 |
| Veto LLD | 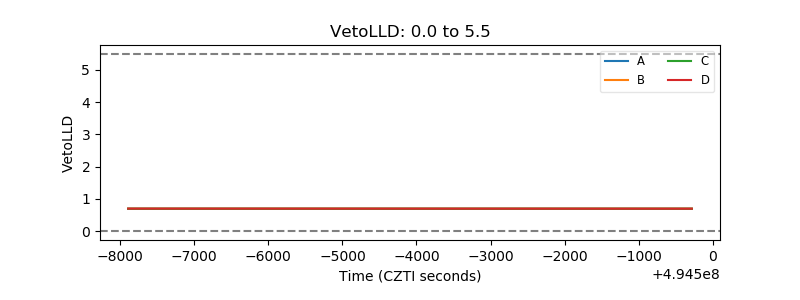 |
| Alpha Counter | 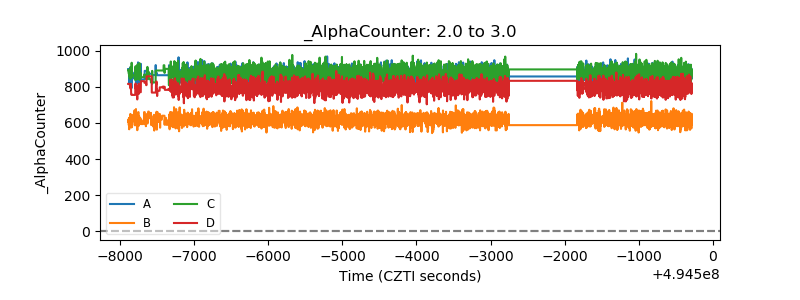 |
| _CPM_Rate | 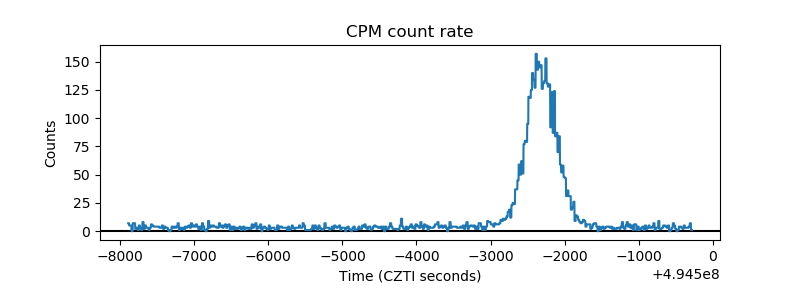 |
| CZT Counter | 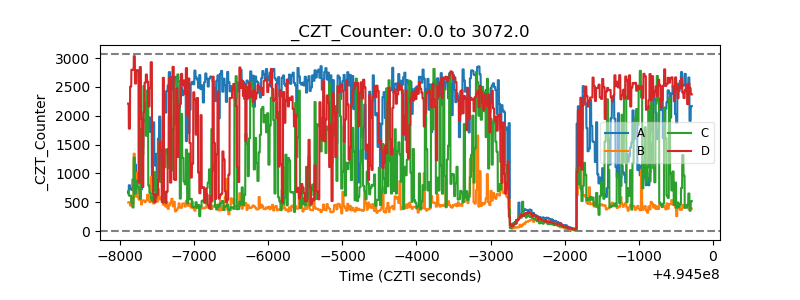 |
| +2.5 Volts monitor |  |
| +5 Volts monitor | 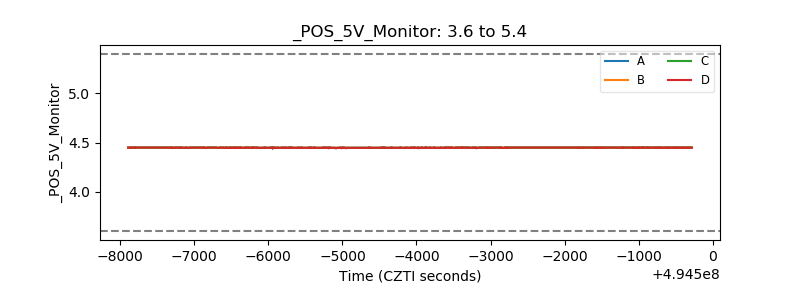 |
| _ROLL_ROT | 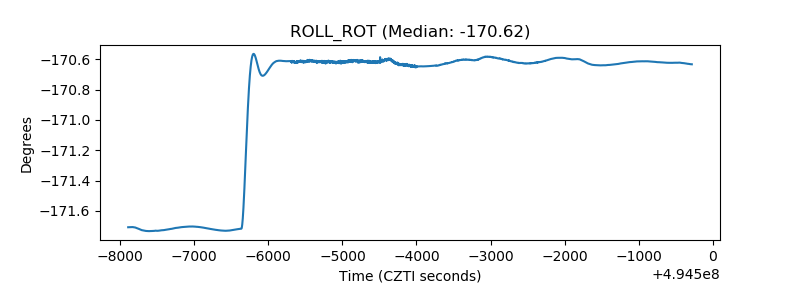 |
| _Roll_DEC | 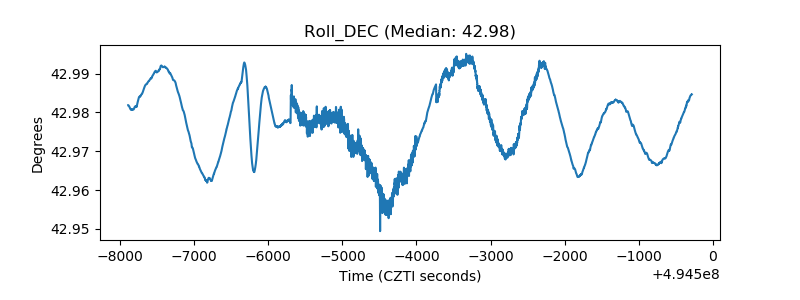 |
| _Roll_RA | 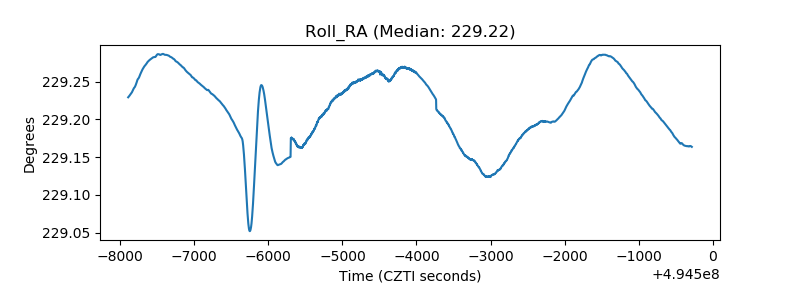 |
| Veto Counter | 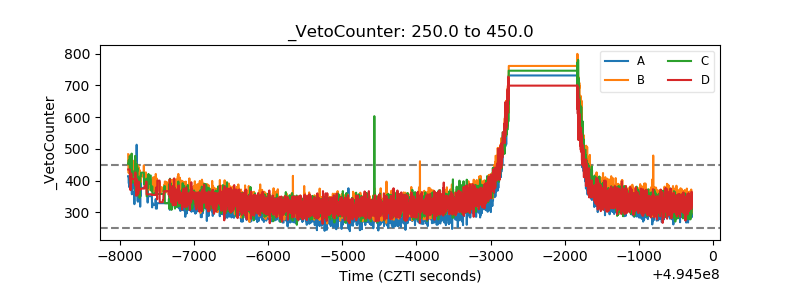 |