| Param | Original file | Final file |
|---|---|---|
| Filename | modeM0/AS1A14_022T04_9000006506_53720cztM0_level2.fits | modeM0/AS1A14_022T04_9000006506_53720cztM0_level2_quad_clean.evt |
| Size (bytes) | 853,263,360 | 73,396,800 |
| Size | 813.7 MB | 70.0 MB |
| Events in quadrant A | 13,401,984 | 224,028 |
| Events in quadrant B | 3,026,766 | 636,737 |
| Events in quadrant C | 6,708,982 | 513,080 |
| Events in quadrant D | 7,953,817 | 402,984 |
| Mode M0 | |||
|---|---|---|---|
| Quadrant | BADHDUFLAG | Total packets | Discarded packets |
| A | 0 | 44196 | 7 |
| B | 0 | 13805 | 2 |
| C | 0 | 24399 | 2 |
| D | 0 | 28018 | 2 |
| Mode SS | |||
|---|---|---|---|
| Quadrant | BADHDUFLAG | Total packets | Discarded packets |
| A | 0 | 132 | 0 |
| B | 0 | 132 | 0 |
| C | 0 | 132 | 0 |
| D | 0 | 132 | 0 |
| Mode M9 | |||
|---|---|---|---|
| Quadrant | BADHDUFLAG | Total packets | Discarded packets |
| A | 0 | 5 | 0 |
| B | 0 | 5 | 0 |
| C | 0 | 5 | 0 |
| D | 0 | 5 | 0 |
| Quadrant | Total seconds | Saturated seconds | Saturation percentage |
|---|---|---|---|
| A | 6374 | 4351 | 68.261688% |
| B | 6374 | 161 | 2.525886% |
| C | 6374 | 859 | 13.476624% |
| D | 6374 | 1822 | 28.584876% |
Noise dominated data is calculated using 1-second bins in cleaned event files. If a bin has >2000 counts, and if more than 50% of those come from <1% of pixels, then it is considered to be noise-dominated and hence unusable.
| Quadrant | # 1 sec bins | Bins with >0 counts | Bins with >2000 counts | High rate bins dominated by noise | Noise dominated (total time) | Noise dominated (detector-on time) | Marked lightcurve |
|---|---|---|---|---|---|---|---|
| A | 6989 | 6376 | 4152 | 4152 | 59.41% | 65.12% | 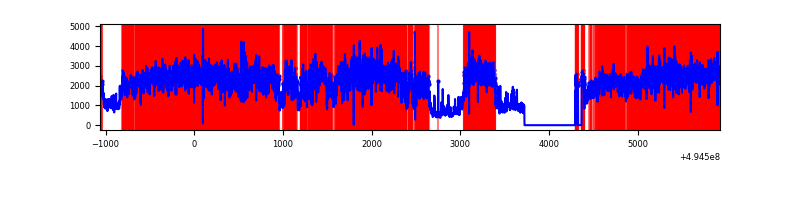 |
| B | 6989 | 6376 | 21 | 21 | 0.30% | 0.33% | 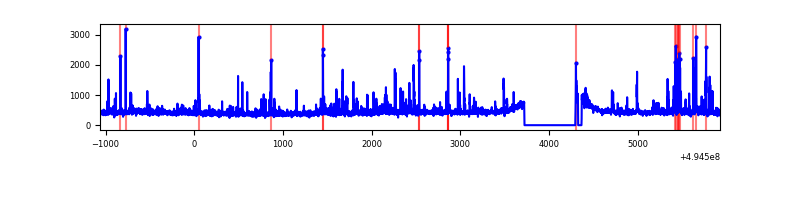 |
| C | 6989 | 6376 | 635 | 635 | 9.09% | 9.96% | 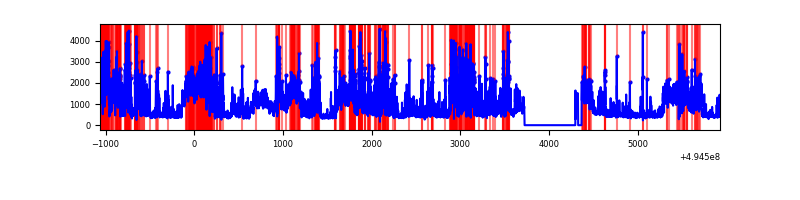 |
| D | 6989 | 6376 | 1488 | 1488 | 21.29% | 23.34% | 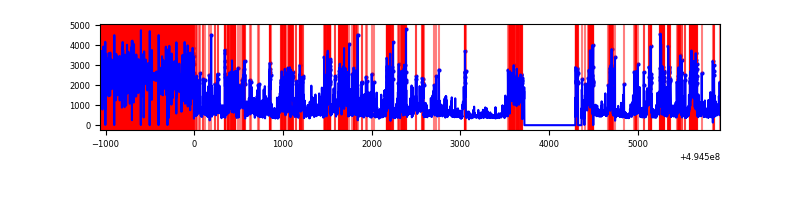 |
Top three noisy pixels from each quadrant. If the there are fewer than three noisy pixels in the level2.evt file, extra rows are filled as -1
| Pixel properties | Quadrant properties | ||||||
|---|---|---|---|---|---|---|---|
| Quadrant | DetID | PixID | Counts | Sigma | Mean | Median | Sigma |
| A | 3 | 63 | 8681283 | 70100.64 | 489 | 476 | 123.8 |
| A | 3 | 78 | 2183098 | 17625.46 | 489 | 476 | 123.8 |
| A | 7 | 206 | 237232 | 1911.89 | 489 | 476 | 123.8 |
| B | 6 | 255 | 111915 | 783.88 | 662 | 637 | 142.0 |
| B | 5 | 185 | 106581 | 746.3 | 662 | 637 | 142.0 |
| B | 10 | 247 | 26426 | 181.67 | 662 | 637 | 142.0 |
| C | 15 | 224 | 2076751 | 12202.03 | 618 | 612 | 170.1 |
| C | 15 | 158 | 1361587 | 7998.82 | 618 | 612 | 170.1 |
| C | 13 | 3 | 332405 | 1950.04 | 618 | 612 | 170.1 |
| D | 2 | 172 | 2917541 | 18675.2 | 538 | 513 | 156.2 |
| D | 1 | 241 | 1355341 | 8673.79 | 538 | 513 | 156.2 |
| D | 8 | 176 | 670457 | 4289.07 | 538 | 513 | 156.2 |
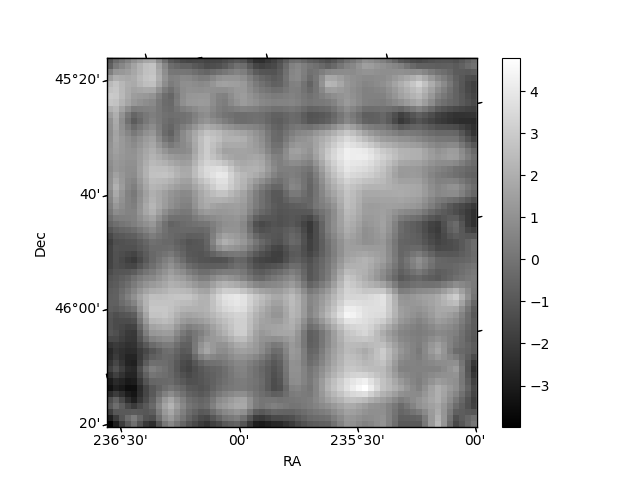
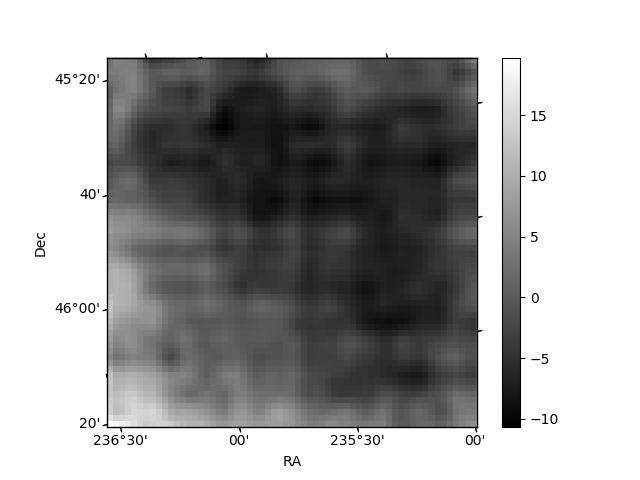
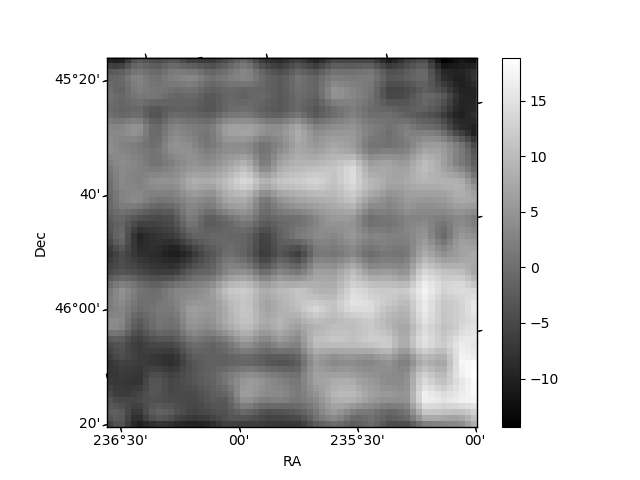
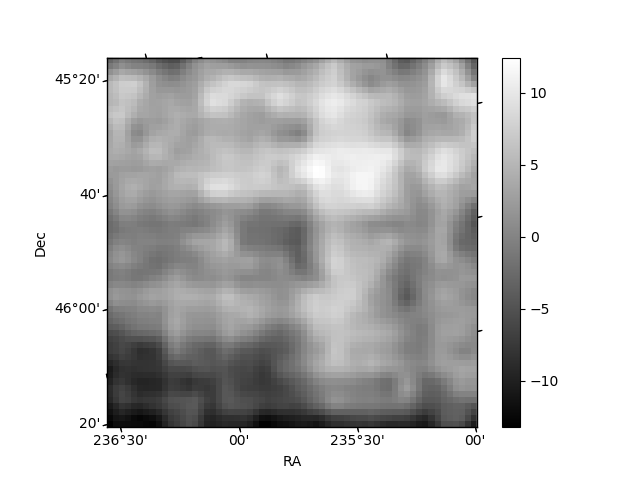
Histogram calculated using DETX and DETY for each event in the final _common_clean file
| Quadrant A | 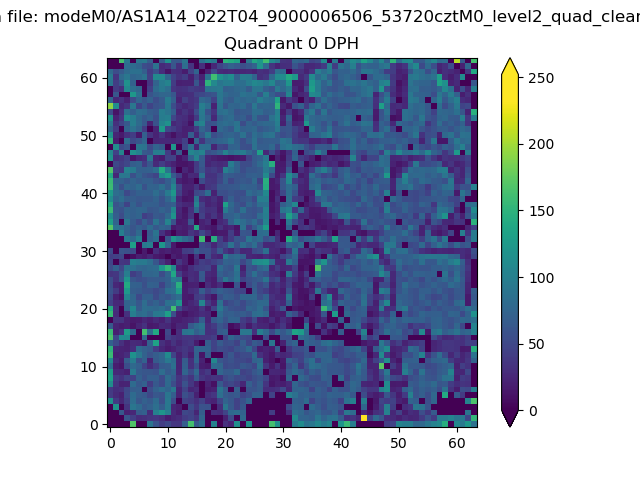 |
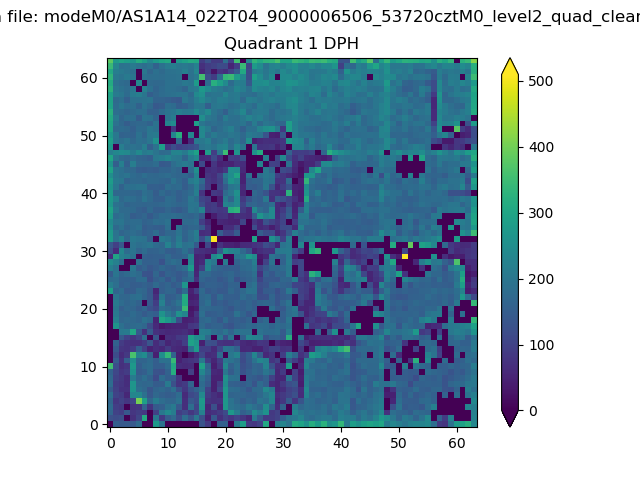 |
Quadrant B |
|---|---|---|---|
| Quadrant D | 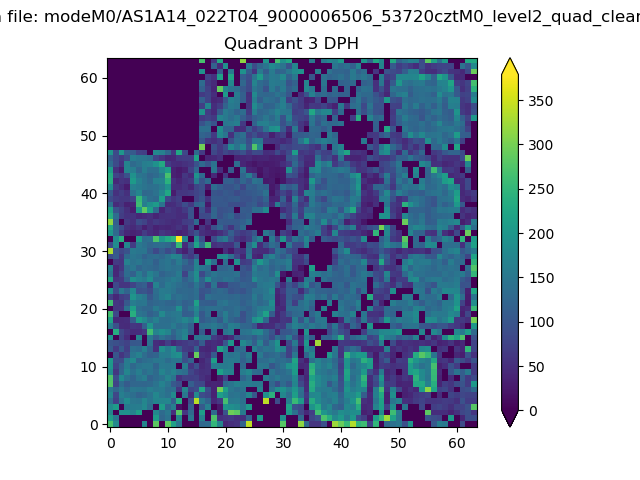 |
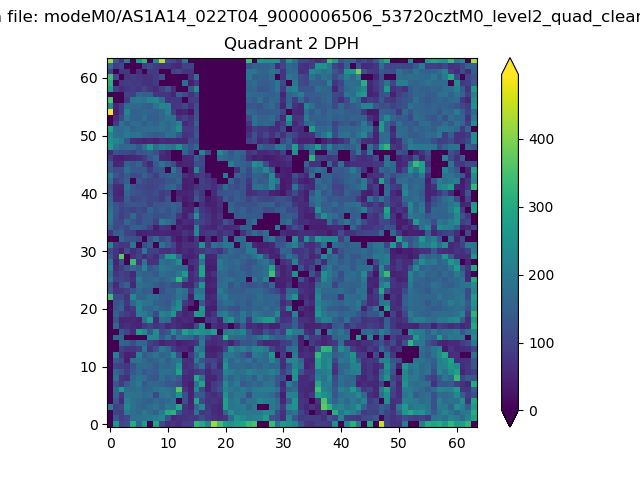 |
Quadrant C |
| Plot type | Count rate plots | Images |
|---|---|---|
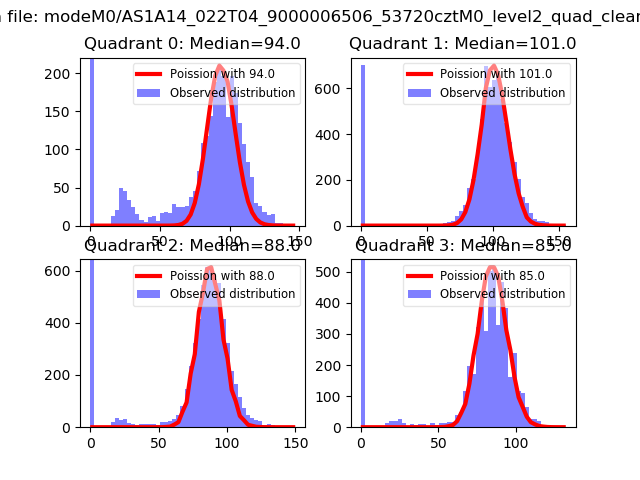
| Comparison with Poisson distribution Blue bars denote a histogram of data divided into 1 sec bins. Red curve is a Poisson curve with rate = median count rate of data. |
 |
 |
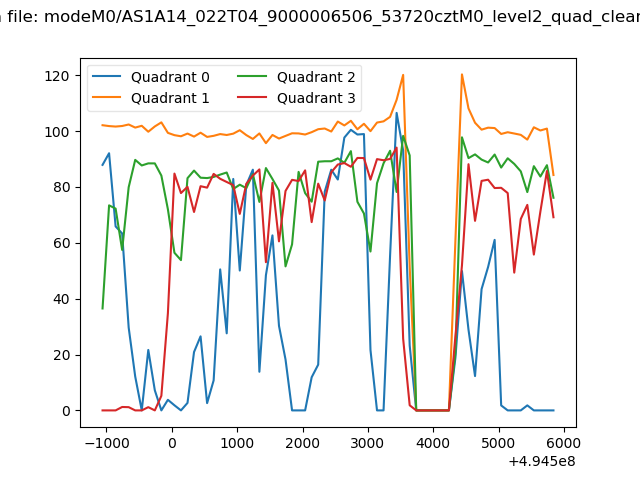
| Quadrant-wise count rates Data is divided into 100 sec bins |
 |
|
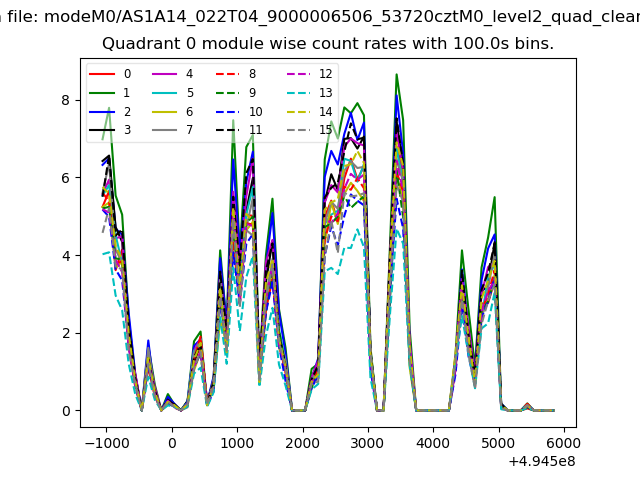
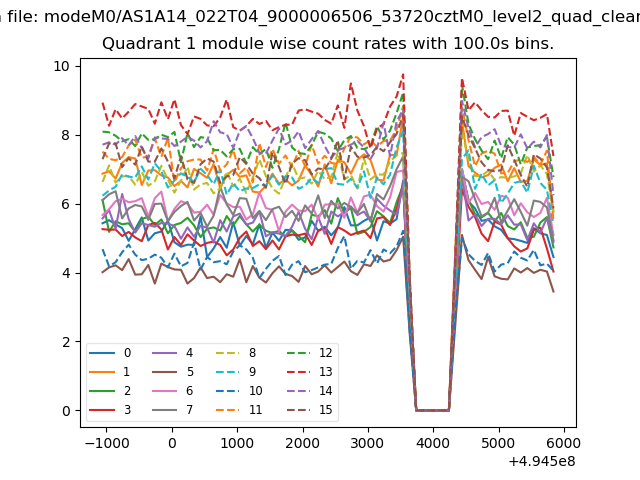
| Module-wise count rates for Quadrant A Data is divided into 100 sec bins |
 |
 |
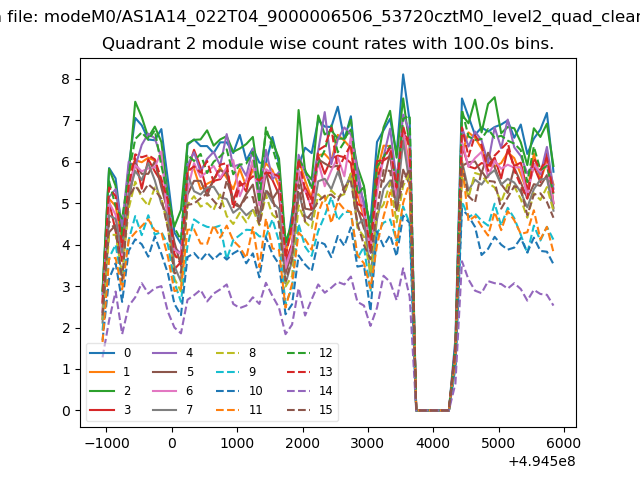
| Module-wise count rates for Quadrant B Data is divided into 100 sec bins |
 |
 |
| Module-wise count rates for Quadrant C Data is divided into 100 sec bins |
 |
 |
| Module-wise count rates for Quadrant D Data is divided into 100 sec bins |
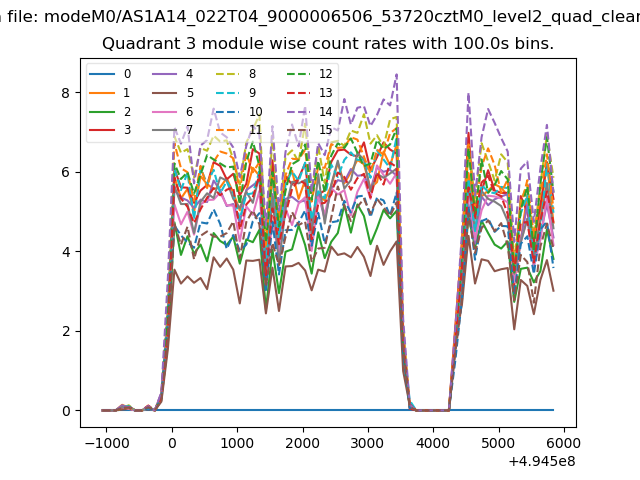 |
 |
| Parameter | Plot |
|---|---|
| CZT HV Monitor | 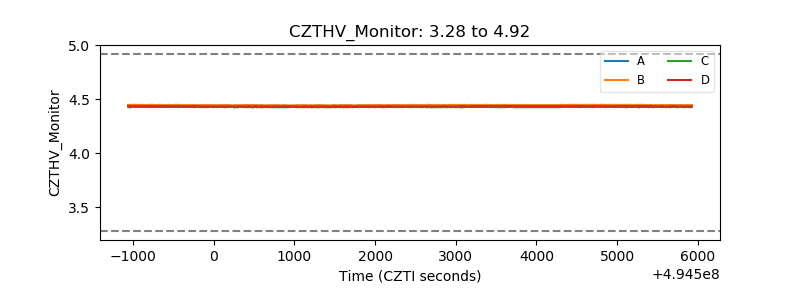 |
| D_VDD | 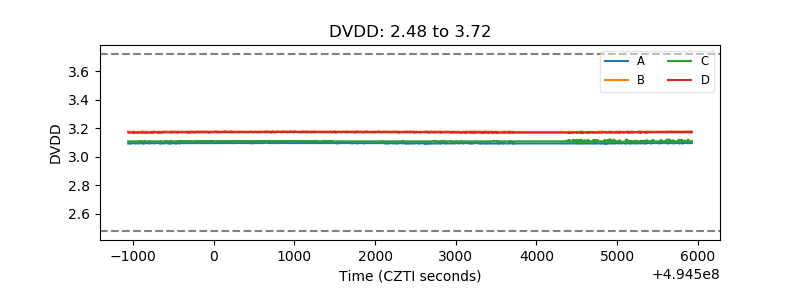 |
| Temperature 1 | 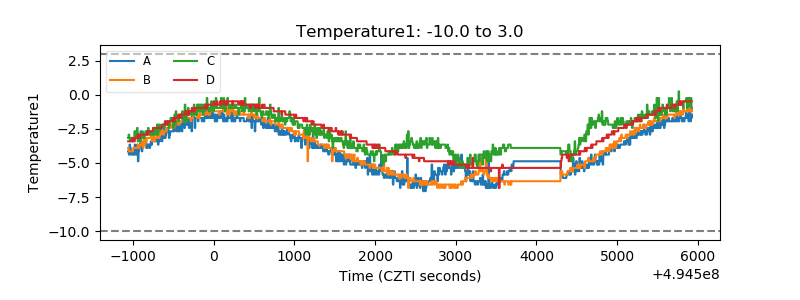 |
| Veto HV Monitor | 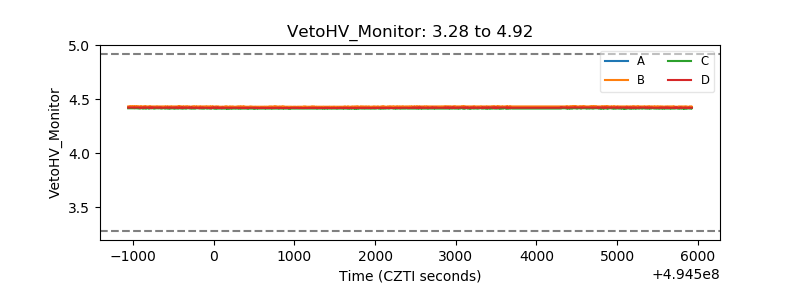 |
| Veto LLD | 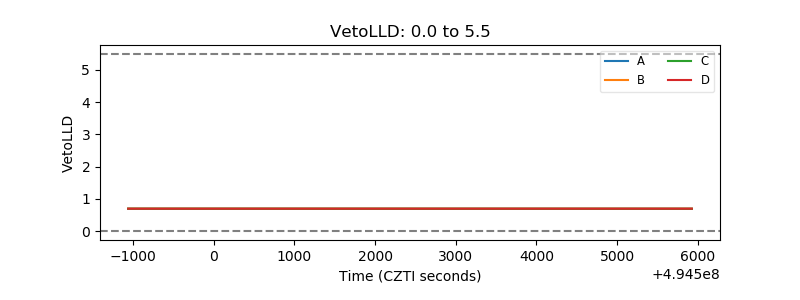 |
| Alpha Counter | 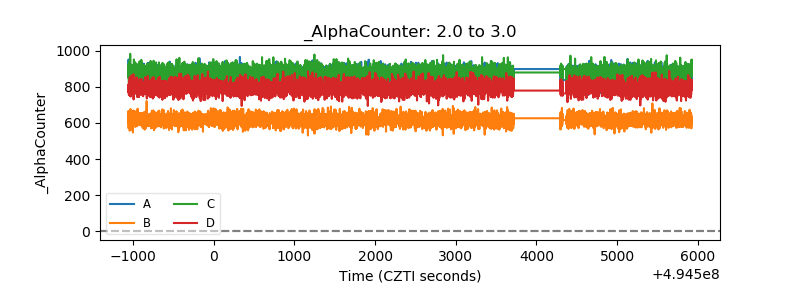 |
| _CPM_Rate | 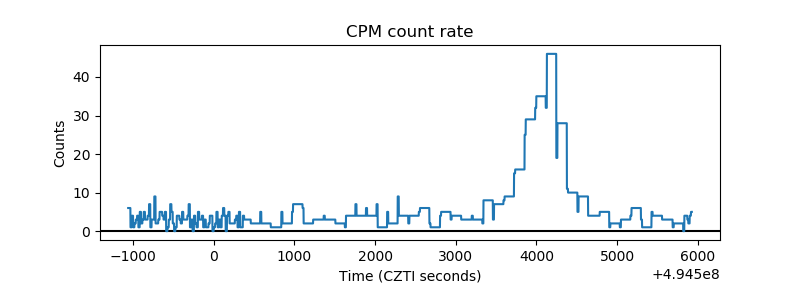 |
| CZT Counter | 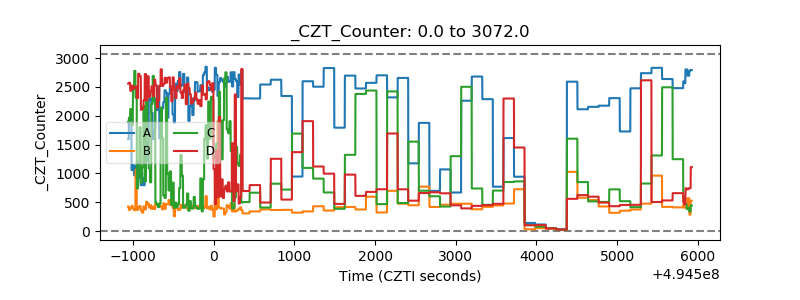 |
| +2.5 Volts monitor |  |
| +5 Volts monitor |  |
| _ROLL_ROT | 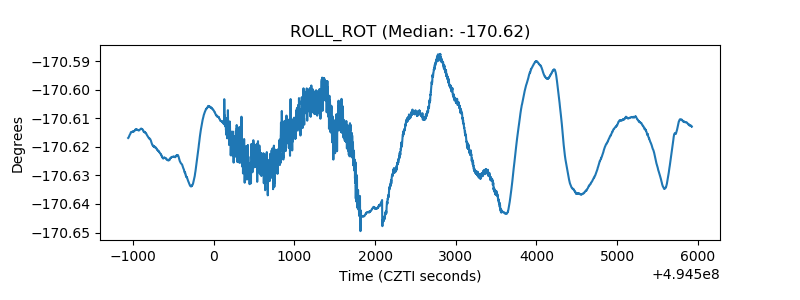 |
| _Roll_DEC | 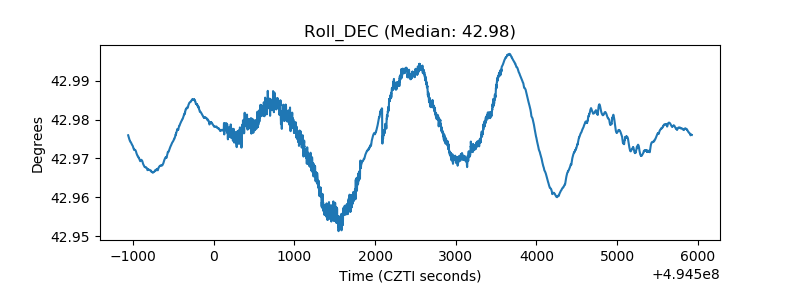 |
| _Roll_RA | 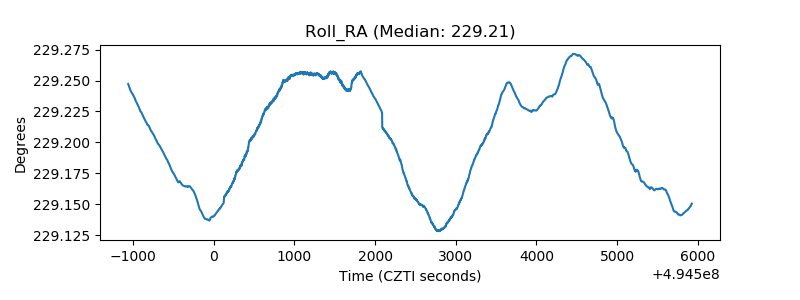 |
| Veto Counter | 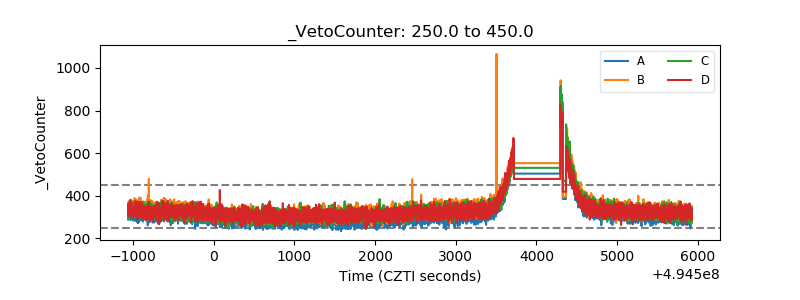 |