| Param | Original file | Final file |
|---|---|---|
| Filename | modeM0/AS1A14_022T04_9000006506_53721cztM0_level2.fits | modeM0/AS1A14_022T04_9000006506_53721cztM0_level2_quad_clean.evt |
| Size (bytes) | 973,595,520 | 79,306,560 |
| Size | 928.5 MB | 75.6 MB |
| Events in quadrant A | 17,244,569 | 66,651 |
| Events in quadrant B | 3,477,752 | 710,241 |
| Events in quadrant C | 7,694,573 | 571,005 |
| Events in quadrant D | 7,072,871 | 558,554 |
| Mode M0 | |||
|---|---|---|---|
| Quadrant | BADHDUFLAG | Total packets | Discarded packets |
| A | 0 | 56129 | 2 |
| B | 0 | 15778 | 0 |
| C | 0 | 27825 | 0 |
| D | 0 | 25863 | 0 |
| Mode SS | |||
|---|---|---|---|
| Quadrant | BADHDUFLAG | Total packets | Discarded packets |
| A | 0 | 142 | 0 |
| B | 0 | 142 | 0 |
| C | 0 | 142 | 0 |
| D | 0 | 142 | 0 |
| Quadrant | Total seconds | Saturated seconds | Saturation percentage |
|---|---|---|---|
| A | 7101 | 6551 | 92.254612% |
| B | 7101 | 177 | 2.492607% |
| C | 7101 | 1013 | 14.265596% |
| D | 7101 | 780 | 10.984368% |
Noise dominated data is calculated using 1-second bins in cleaned event files. If a bin has >2000 counts, and if more than 50% of those come from <1% of pixels, then it is considered to be noise-dominated and hence unusable.
| Quadrant | # 1 sec bins | Bins with >0 counts | Bins with >2000 counts | High rate bins dominated by noise | Noise dominated (total time) | Noise dominated (detector-on time) | Marked lightcurve |
|---|---|---|---|---|---|---|---|
| A | 7100 | 7100 | 5773 | 5773 | 81.31% | 81.31% | 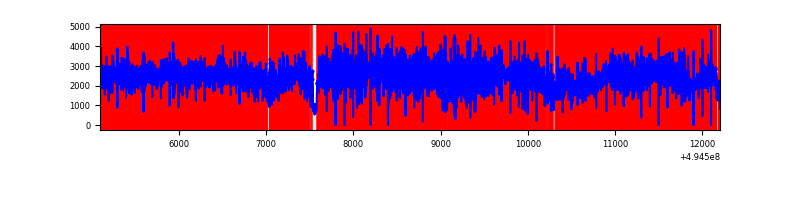 |
| B | 7101 | 7101 | 37 | 37 | 0.52% | 0.52% | 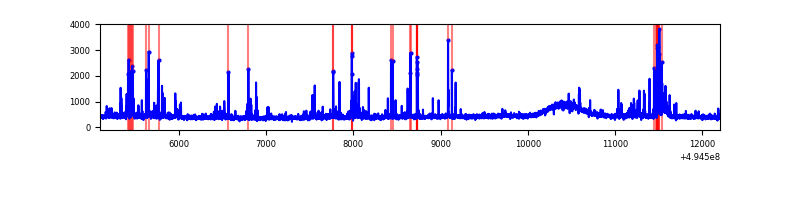 |
| C | 7101 | 7101 | 847 | 847 | 11.93% | 11.93% | 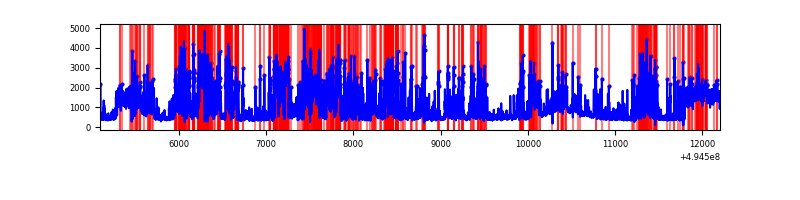 |
| D | 7101 | 7101 | 768 | 768 | 10.82% | 10.82% | 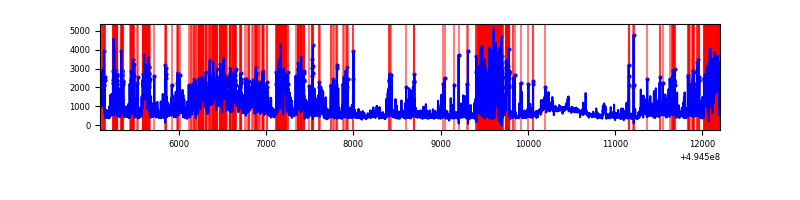 |
Top three noisy pixels from each quadrant. If the there are fewer than three noisy pixels in the level2.evt file, extra rows are filled as -1
| Pixel properties | Quadrant properties | ||||||
|---|---|---|---|---|---|---|---|
| Quadrant | DetID | PixID | Counts | Sigma | Mean | Median | Sigma |
| A | 3 | 63 | 10051923 | 98555.25 | 402 | 392 | 102.0 |
| A | 3 | 78 | 3756885 | 36832.41 | 402 | 392 | 102.0 |
| A | 8 | 245 | 1440414 | 14119.41 | 402 | 392 | 102.0 |
| B | 5 | 185 | 199489 | 1212.45 | 756 | 728 | 163.9 |
| B | 6 | 255 | 46319 | 278.11 | 756 | 728 | 163.9 |
| B | 4 | 216 | 37944 | 227.02 | 756 | 728 | 163.9 |
| C | 15 | 224 | 1972214 | 10136.95 | 703 | 696 | 194.5 |
| C | 15 | 158 | 1131564 | 5814.58 | 703 | 696 | 194.5 |
| C | 1 | 241 | 658164 | 3380.5 | 703 | 696 | 194.5 |
| D | 1 | 241 | 1731358 | 8366.56 | 725 | 693 | 206.9 |
| D | 8 | 176 | 959083 | 4633.15 | 725 | 693 | 206.9 |
| D | 2 | 172 | 707623 | 3417.51 | 725 | 693 | 206.9 |
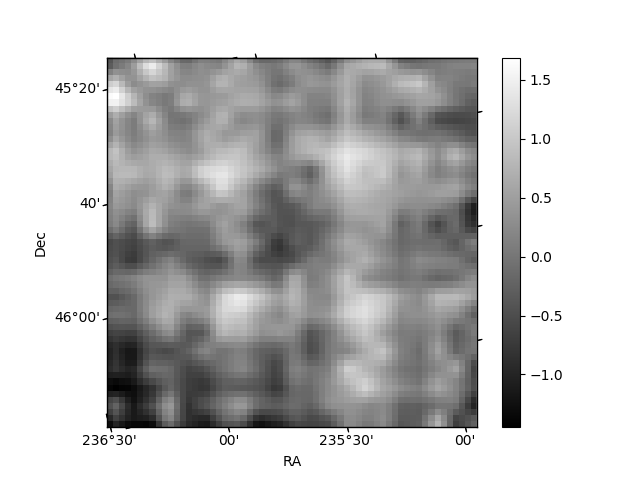
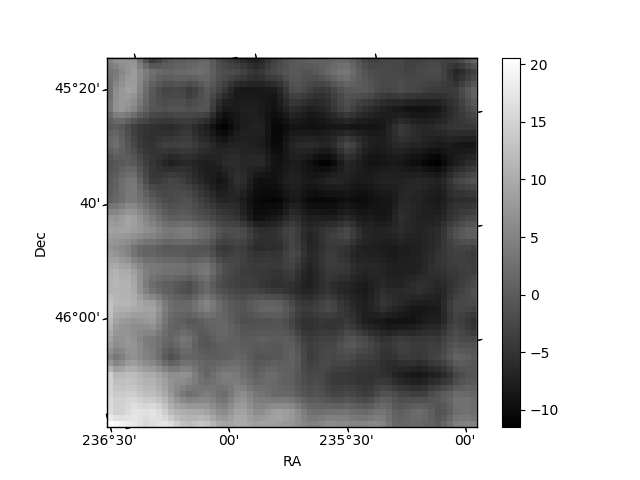
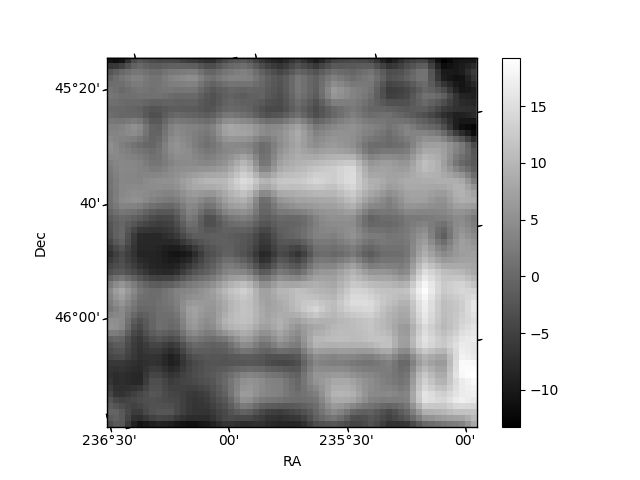
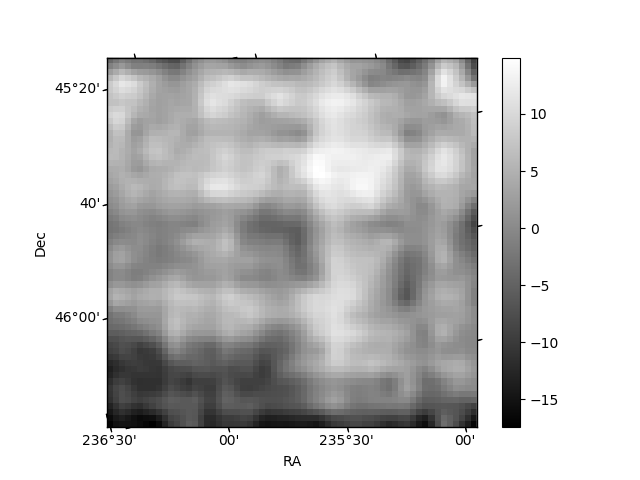
Histogram calculated using DETX and DETY for each event in the final _common_clean file
| Quadrant A | 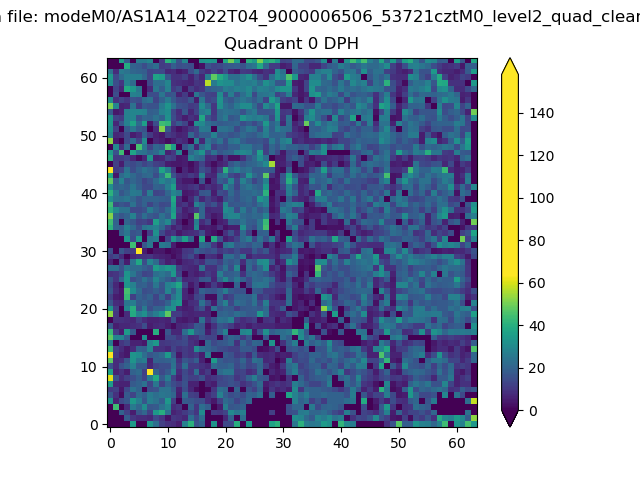 |
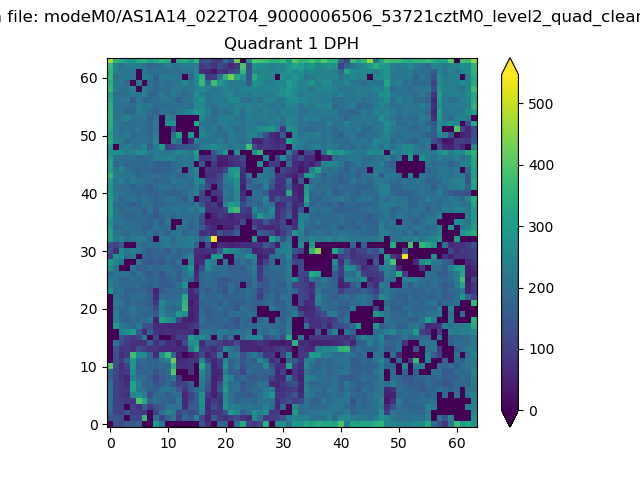 |
Quadrant B |
|---|---|---|---|
| Quadrant D | 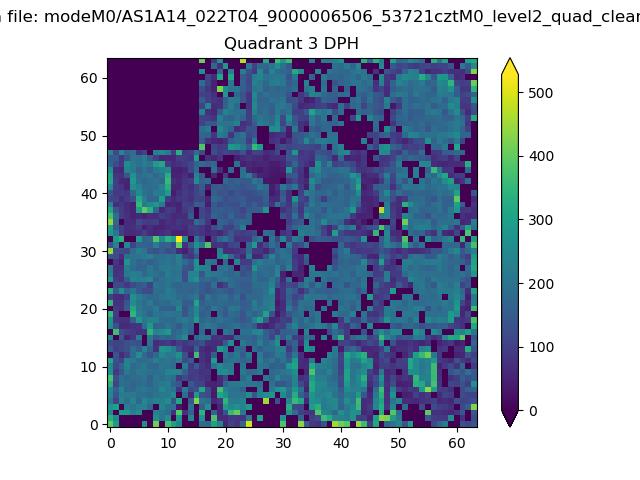 |
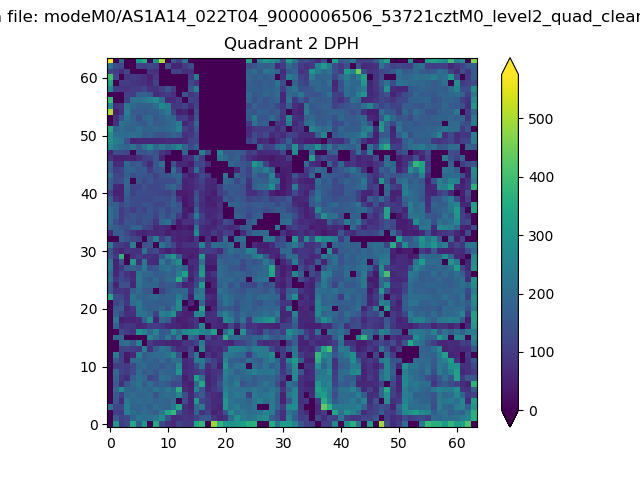 |
Quadrant C |
| Plot type | Count rate plots | Images |
|---|---|---|
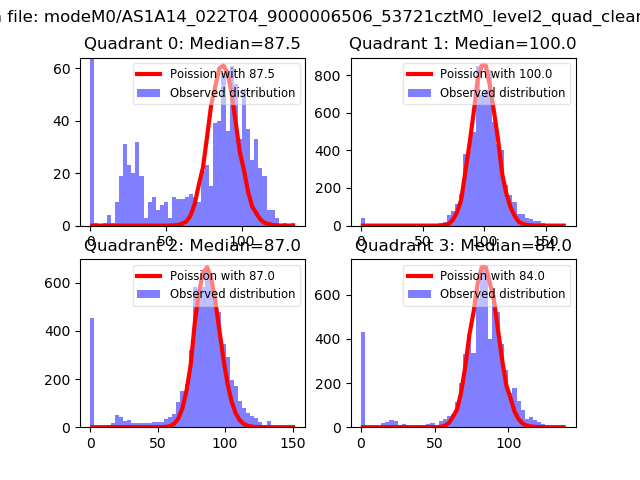
| Comparison with Poisson distribution Blue bars denote a histogram of data divided into 1 sec bins. Red curve is a Poisson curve with rate = median count rate of data. |
 |
 |
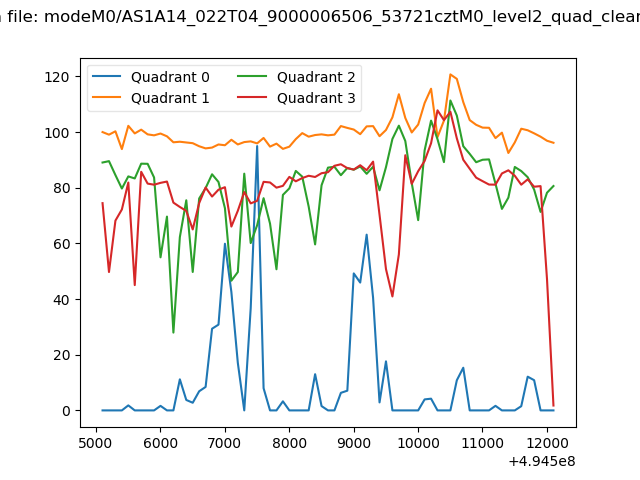
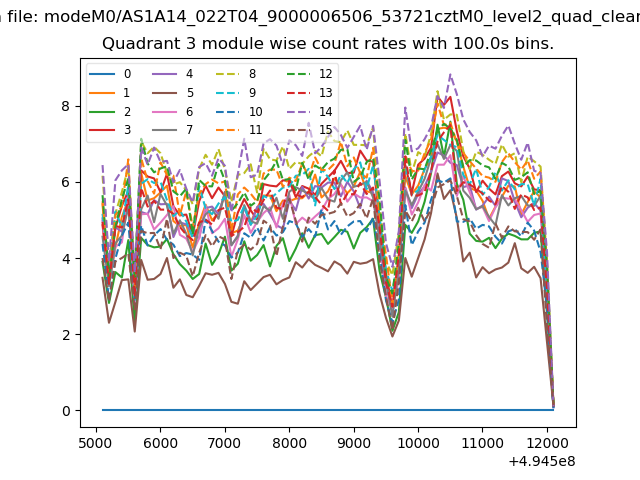
| Quadrant-wise count rates Data is divided into 100 sec bins |
 |
|
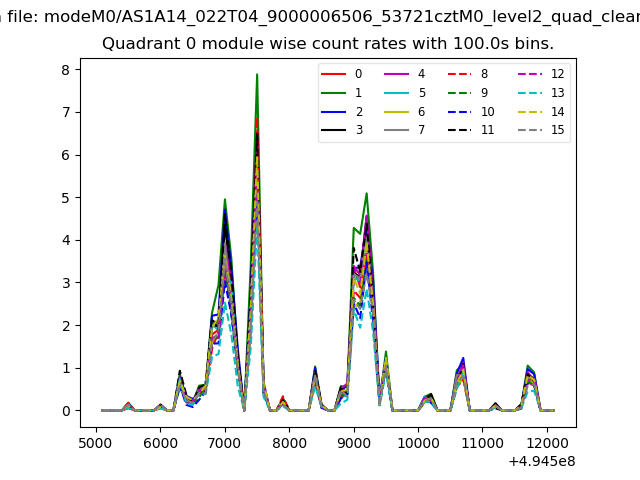
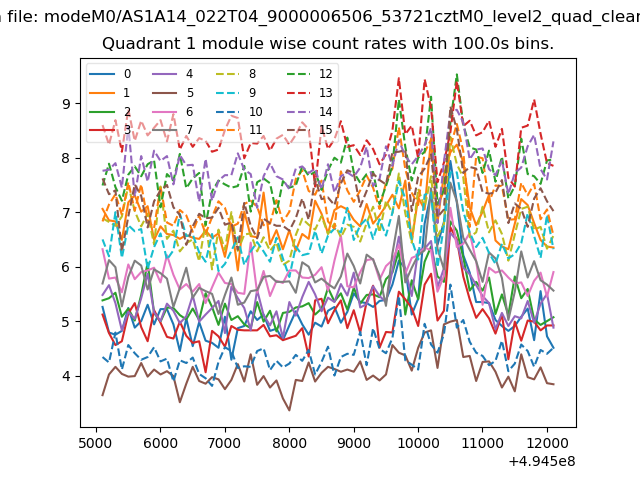
| Module-wise count rates for Quadrant A Data is divided into 100 sec bins |
 |
 |
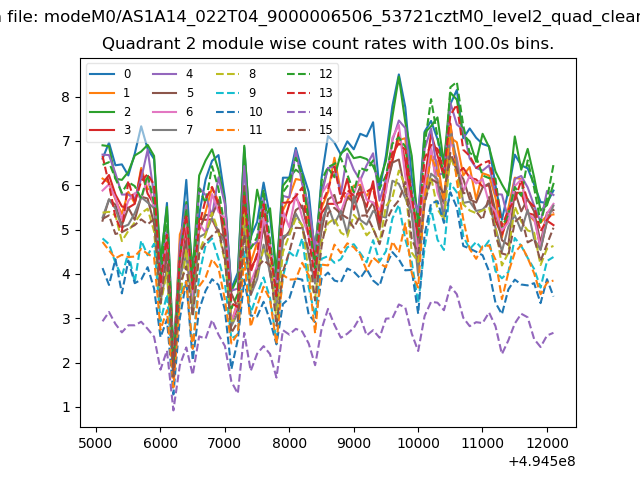
| Module-wise count rates for Quadrant B Data is divided into 100 sec bins |
 |
 |
| Module-wise count rates for Quadrant C Data is divided into 100 sec bins |
 |
 |
| Module-wise count rates for Quadrant D Data is divided into 100 sec bins |
 |
 |
| Parameter | Plot |
|---|---|
| CZT HV Monitor | 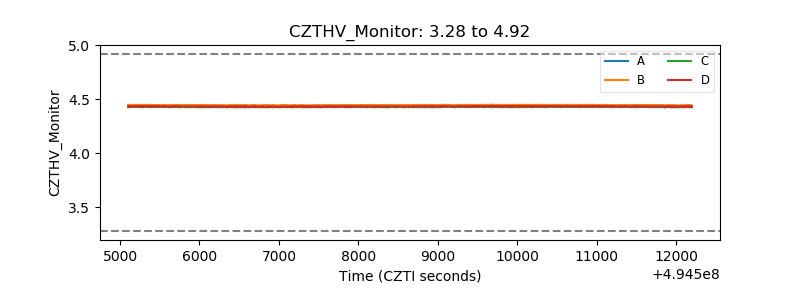 |
| D_VDD | 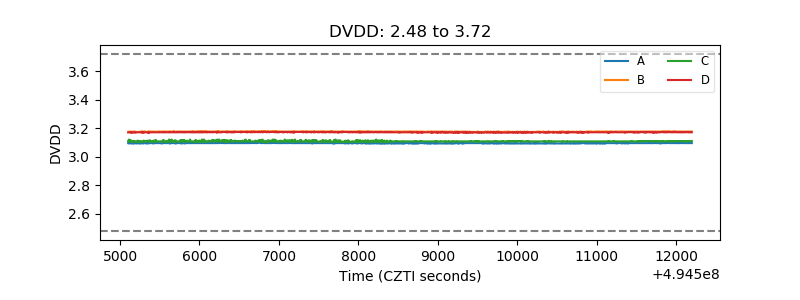 |
| Temperature 1 | 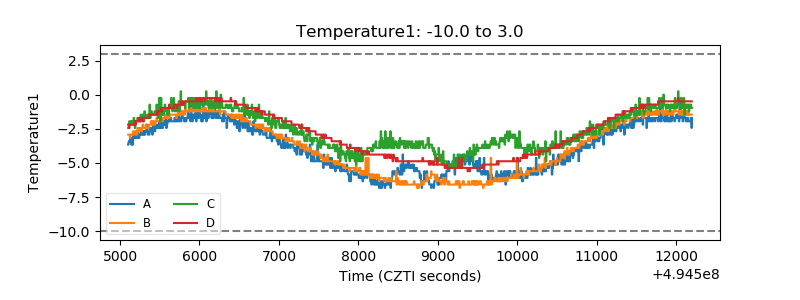 |
| Veto HV Monitor | 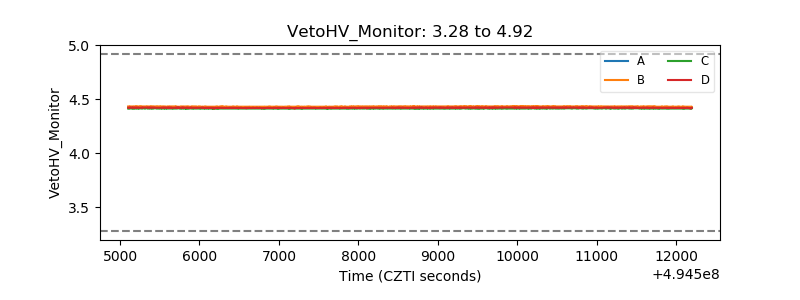 |
| Veto LLD | 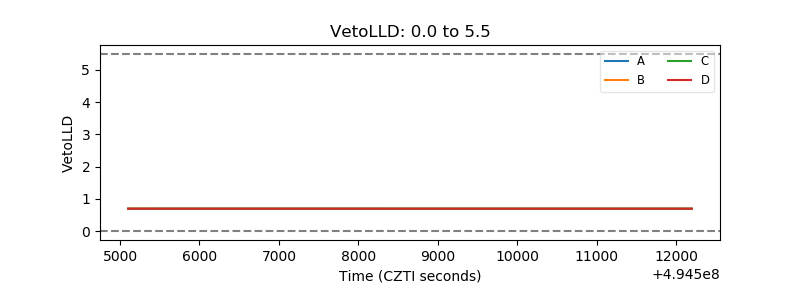 |
| Alpha Counter | 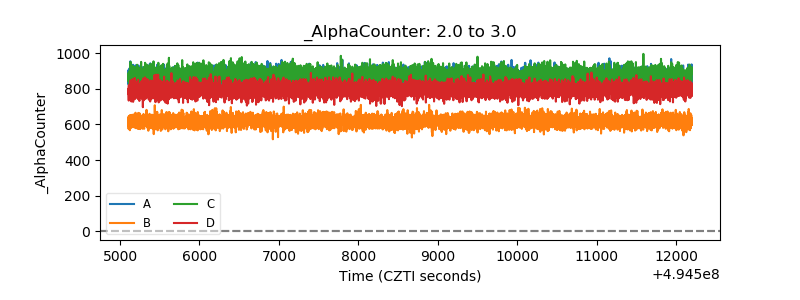 |
| _CPM_Rate | 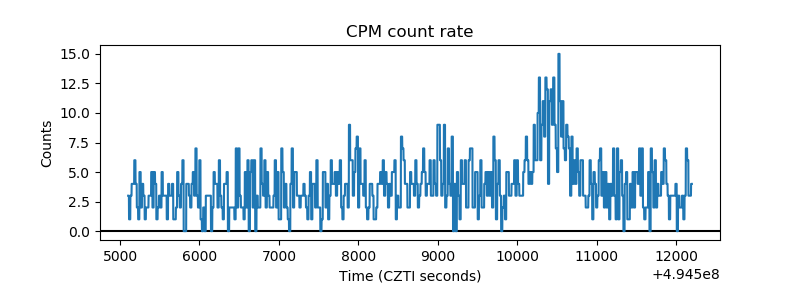 |
| CZT Counter | 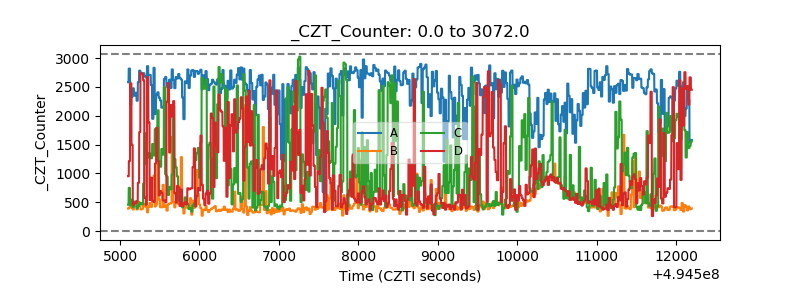 |
| +2.5 Volts monitor |  |
| +5 Volts monitor |  |
| _ROLL_ROT | 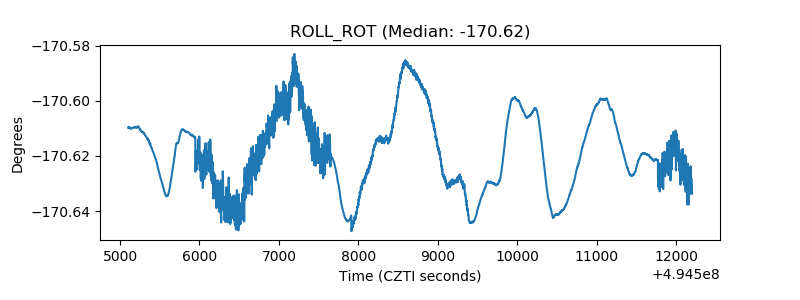 |
| _Roll_DEC | 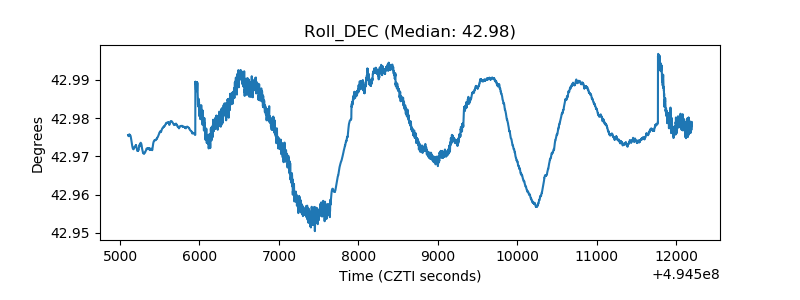 |
| _Roll_RA | 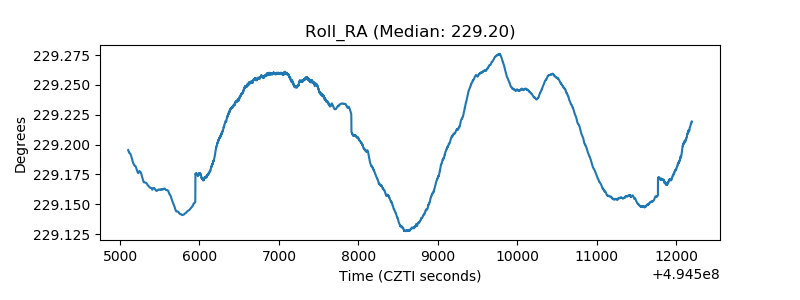 |
| Veto Counter | 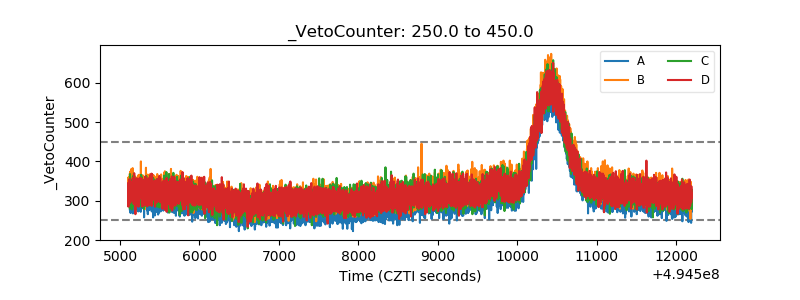 |