| Param | Original file | Final file |
|---|---|---|
| Filename | modeM0/AS1A14_022T04_9000006506_53722cztM0_level2.fits | modeM0/AS1A14_022T04_9000006506_53722cztM0_level2_quad_clean.evt |
| Size (bytes) | 1,088,000,640 | 82,074,240 |
| Size | 1.0 GB | 78.3 MB |
| Events in quadrant A | 18,201,416 | 75,961 |
| Events in quadrant B | 3,842,248 | 762,581 |
| Events in quadrant C | 10,032,986 | 533,025 |
| Events in quadrant D | 7,602,605 | 577,927 |
| Mode M0 | |||
|---|---|---|---|
| Quadrant | BADHDUFLAG | Total packets | Discarded packets |
| A | 0 | 59355 | 0 |
| B | 0 | 17346 | 0 |
| C | 0 | 35219 | 0 |
| D | 0 | 28035 | 0 |
| Mode SS | |||
|---|---|---|---|
| Quadrant | BADHDUFLAG | Total packets | Discarded packets |
| A | 0 | 154 | 0 |
| B | 0 | 154 | 0 |
| C | 0 | 154 | 0 |
| D | 0 | 154 | 0 |
| Quadrant | Total seconds | Saturated seconds | Saturation percentage |
|---|---|---|---|
| A | 7693 | 6987 | 90.822826% |
| B | 7693 | 97 | 1.260887% |
| C | 7694 | 1961 | 25.487393% |
| D | 7694 | 997 | 12.958149% |
Noise dominated data is calculated using 1-second bins in cleaned event files. If a bin has >2000 counts, and if more than 50% of those come from <1% of pixels, then it is considered to be noise-dominated and hence unusable.
| Quadrant | # 1 sec bins | Bins with >0 counts | Bins with >2000 counts | High rate bins dominated by noise | Noise dominated (total time) | Noise dominated (detector-on time) | Marked lightcurve |
|---|---|---|---|---|---|---|---|
| A | 7693 | 7693 | 6123 | 6123 | 79.59% | 79.59% | 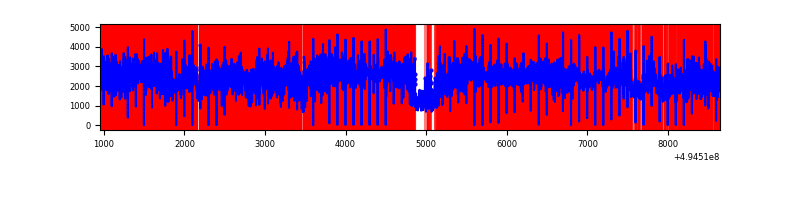 |
| B | 7693 | 7693 | 59 | 59 | 0.77% | 0.77% | 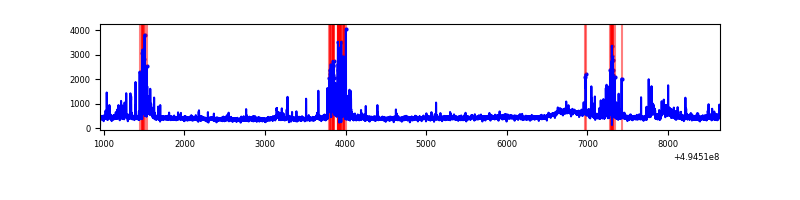 |
| C | 7694 | 7694 | 1647 | 1647 | 21.41% | 21.41% | 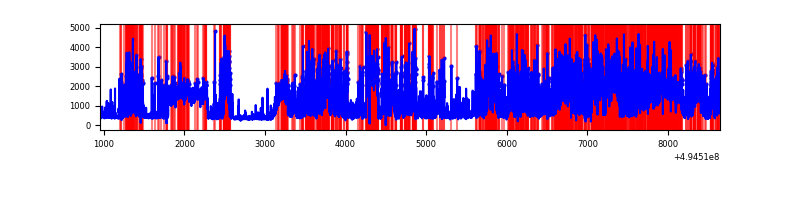 |
| D | 7694 | 7694 | 845 | 845 | 10.98% | 10.98% | 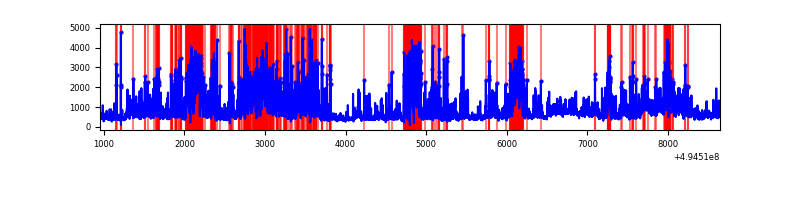 |
Top three noisy pixels from each quadrant. If the there are fewer than three noisy pixels in the level2.evt file, extra rows are filled as -1
| Pixel properties | Quadrant properties | ||||||
|---|---|---|---|---|---|---|---|
| Quadrant | DetID | PixID | Counts | Sigma | Mean | Median | Sigma |
| A | 3 | 78 | 10029390 | 116402.93 | 330 | 320 | 86.2 |
| A | 3 | 63 | 6133479 | 71184.83 | 330 | 320 | 86.2 |
| A | 8 | 245 | 308741 | 3579.7 | 330 | 320 | 86.2 |
| B | 5 | 185 | 423279 | 2498.11 | 788 | 760 | 169.1 |
| B | 7 | 0 | 138859 | 816.5 | 788 | 760 | 169.1 |
| B | 0 | 213 | 49433 | 287.77 | 788 | 760 | 169.1 |
| C | 15 | 224 | 3357354 | 17856.1 | 685 | 681 | 188.0 |
| C | 1 | 241 | 1712963 | 9108.63 | 685 | 681 | 188.0 |
| C | 15 | 158 | 1425821 | 7581.15 | 685 | 681 | 188.0 |
| D | 1 | 241 | 1216934 | 5744.88 | 738 | 704 | 211.7 |
| D | 2 | 172 | 1068597 | 5044.21 | 738 | 704 | 211.7 |
| D | 7 | 110 | 896349 | 4230.59 | 738 | 704 | 211.7 |
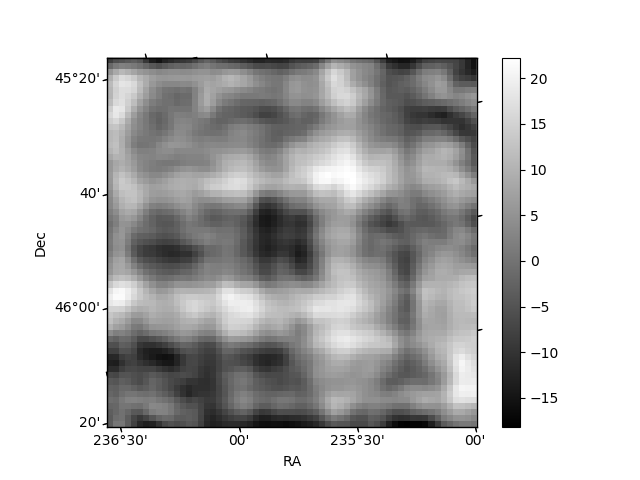
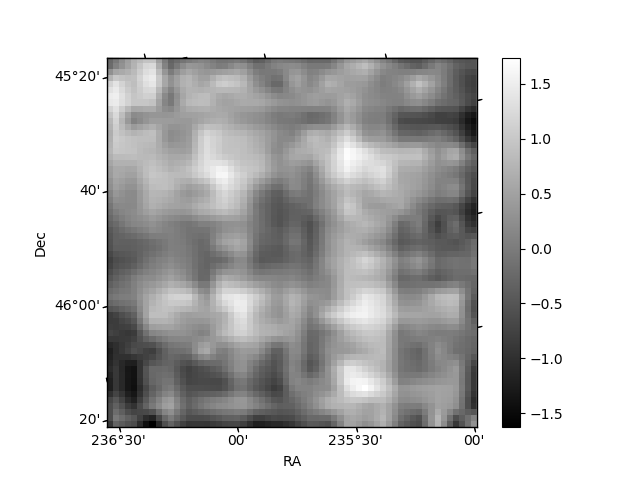
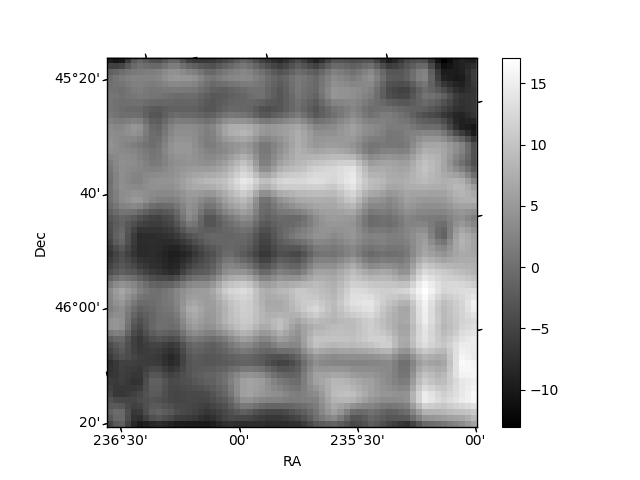
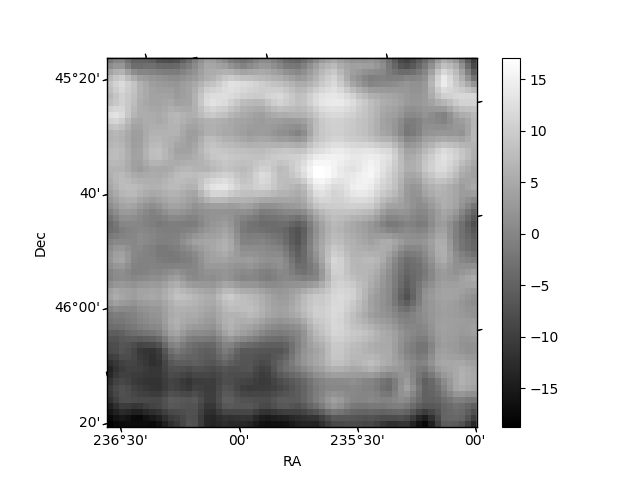
Histogram calculated using DETX and DETY for each event in the final _common_clean file
| Quadrant A | 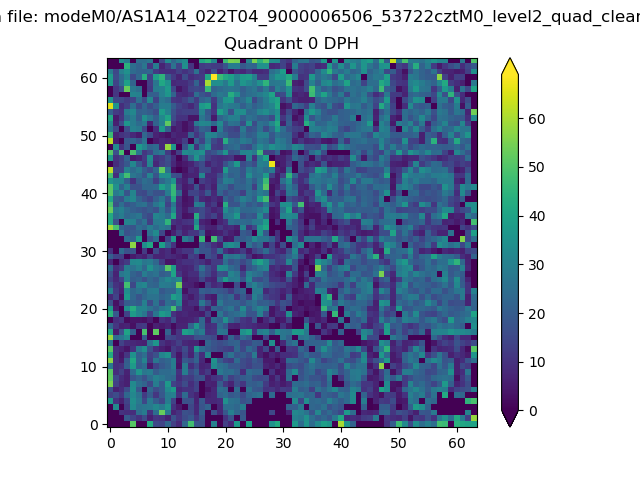 |
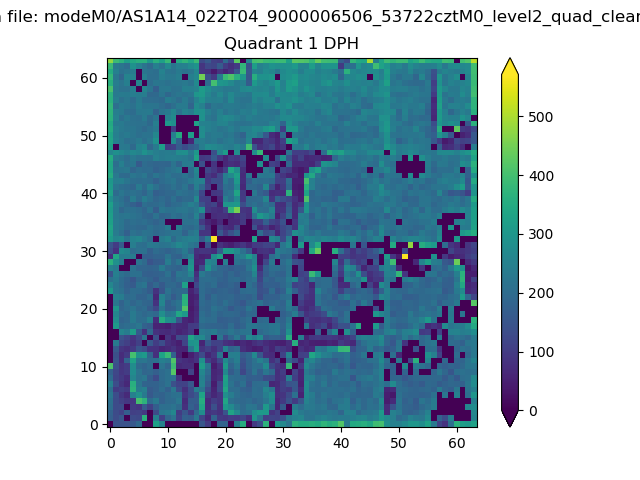 |
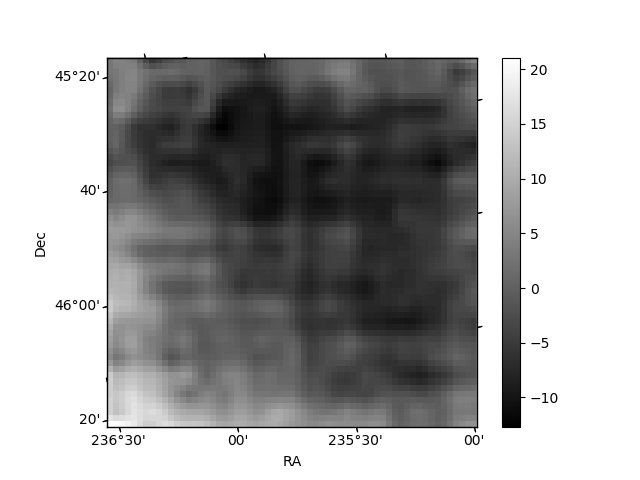
Quadrant B |
|---|---|---|---|
| Quadrant D | 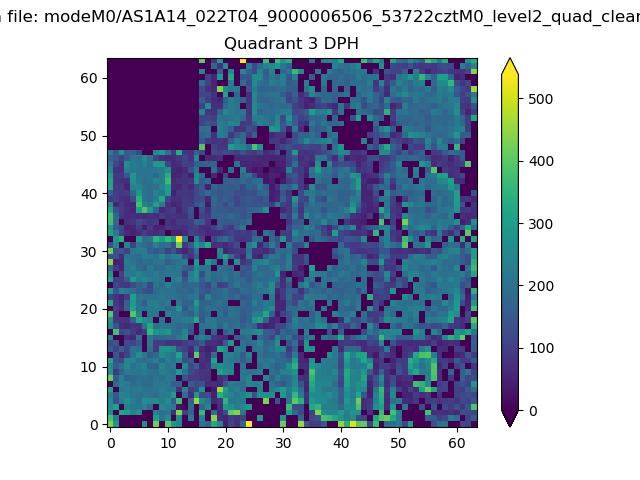 |
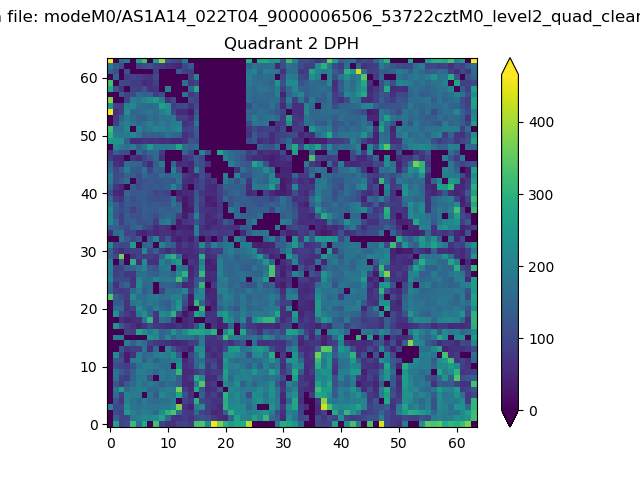 |
Quadrant C |
| Plot type | Count rate plots | Images |
|---|---|---|
| Comparison with Poisson distribution Blue bars denote a histogram of data divided into 1 sec bins. Red curve is a Poisson curve with rate = median count rate of data. |
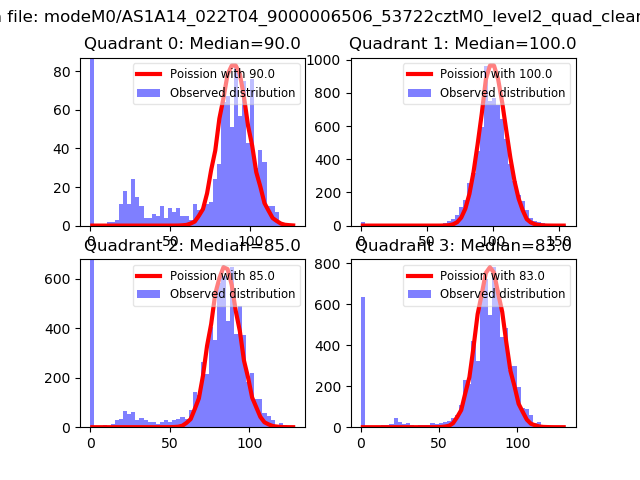 |
 |
| Quadrant-wise count rates Data is divided into 100 sec bins |
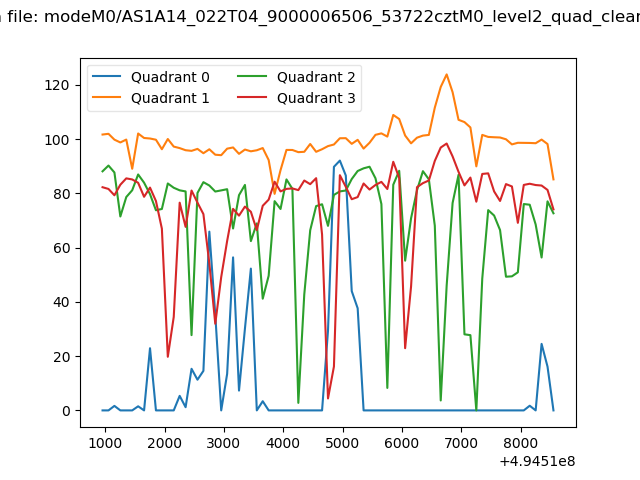 |
|
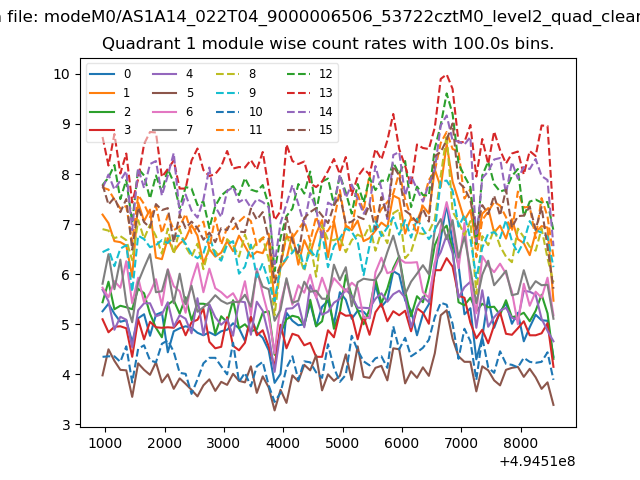
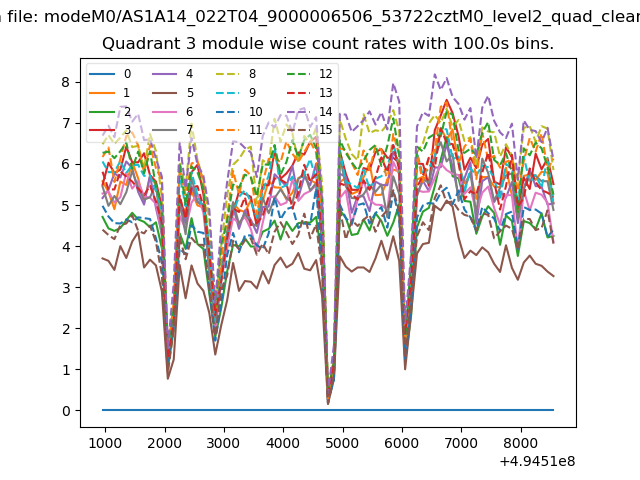
| Module-wise count rates for Quadrant A Data is divided into 100 sec bins |
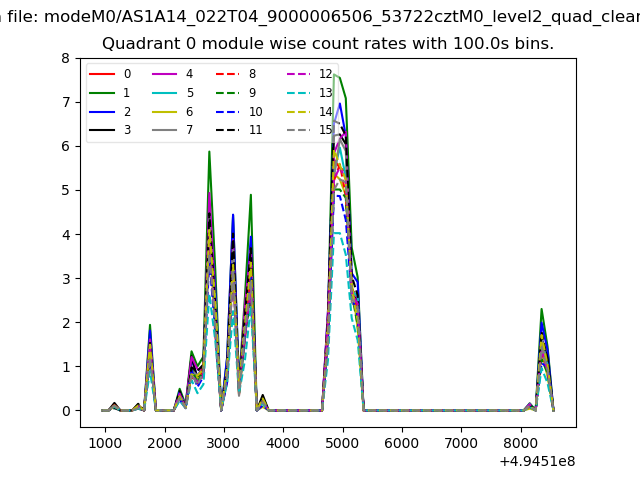 |
 |
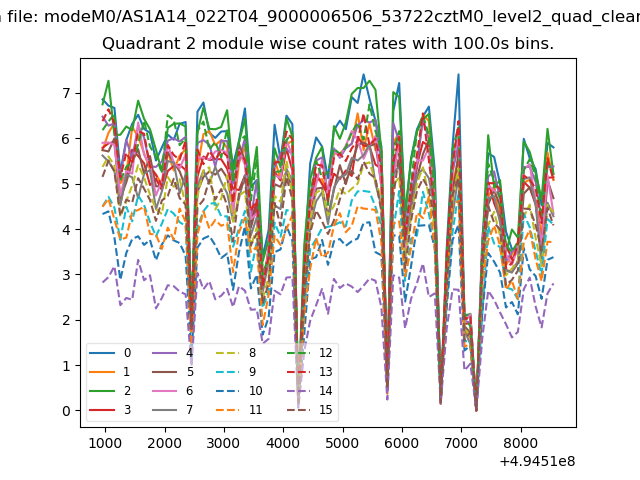
| Module-wise count rates for Quadrant B Data is divided into 100 sec bins |
 |
 |
| Module-wise count rates for Quadrant C Data is divided into 100 sec bins |
 |
 |
| Module-wise count rates for Quadrant D Data is divided into 100 sec bins |
 |
 |
| Parameter | Plot |
|---|---|
| CZT HV Monitor | 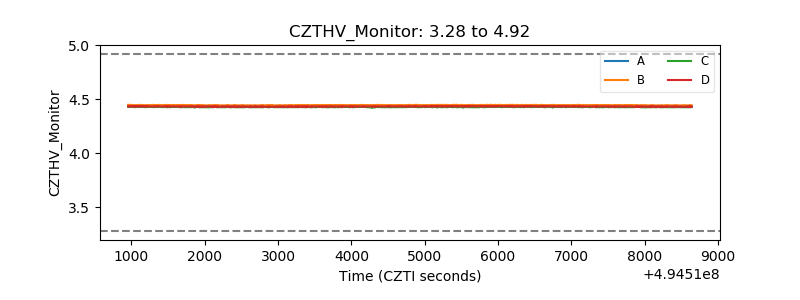 |
| D_VDD | 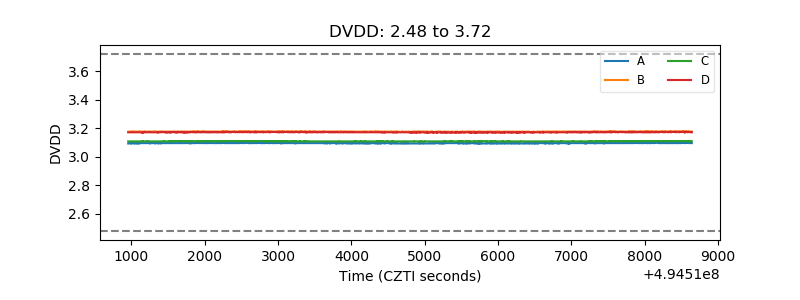 |
| Temperature 1 | 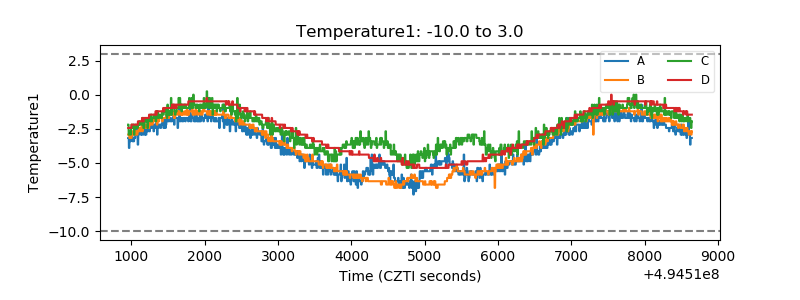 |
| Veto HV Monitor | 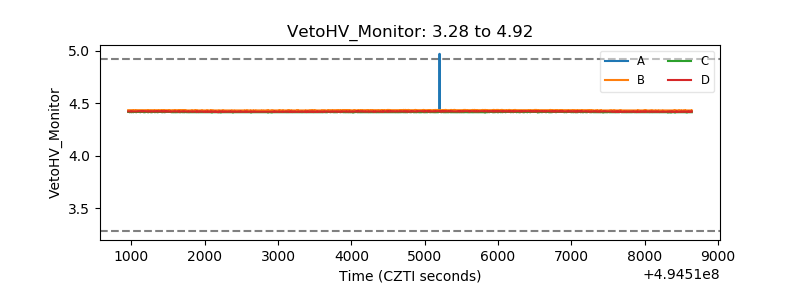 |
| Veto LLD | 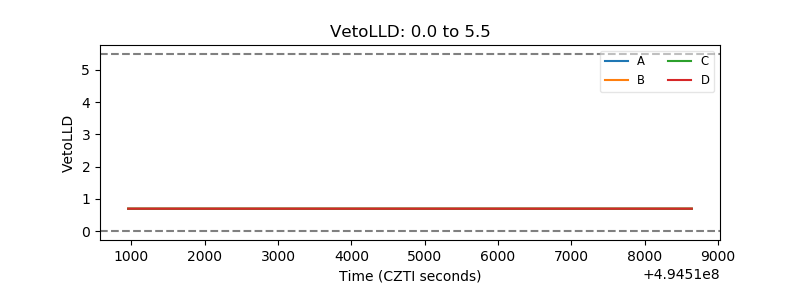 |
| Alpha Counter | 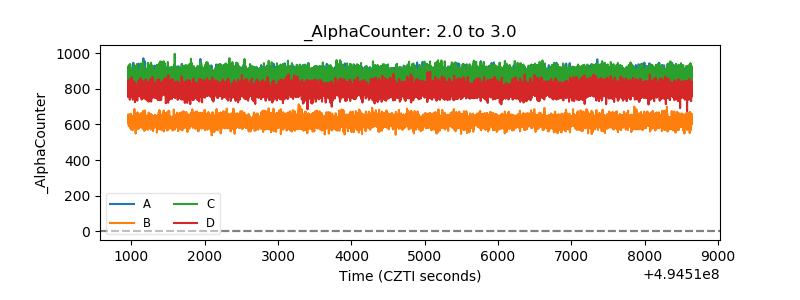 |
| _CPM_Rate | 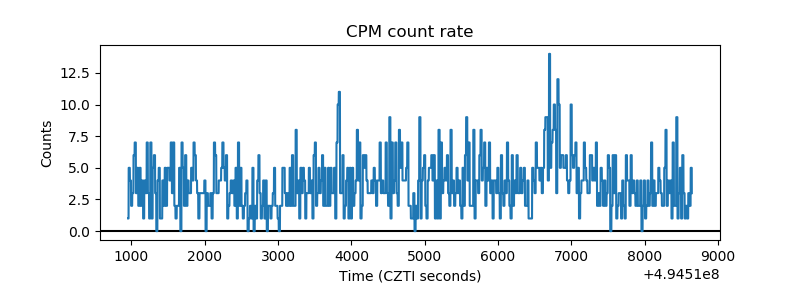 |
| CZT Counter | 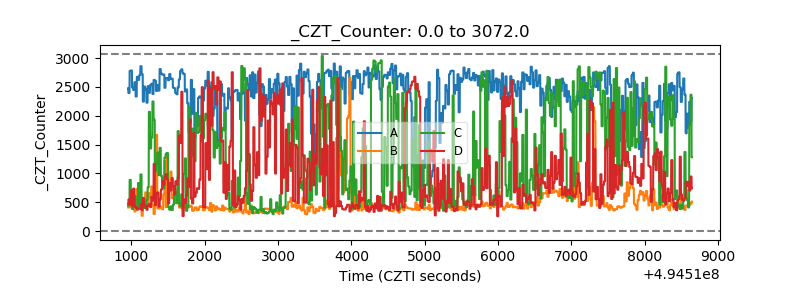 |
| +2.5 Volts monitor |  |
| +5 Volts monitor |  |
| _ROLL_ROT | 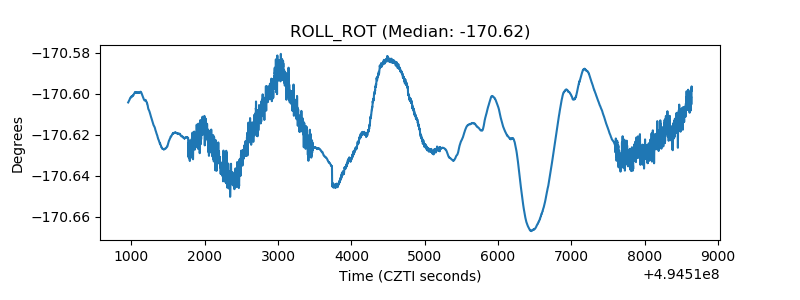 |
| _Roll_DEC | 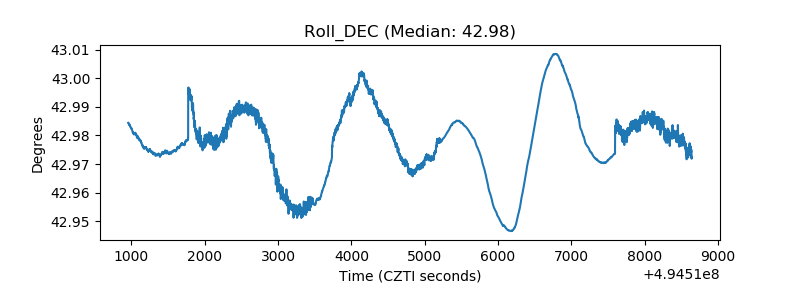 |
| _Roll_RA | 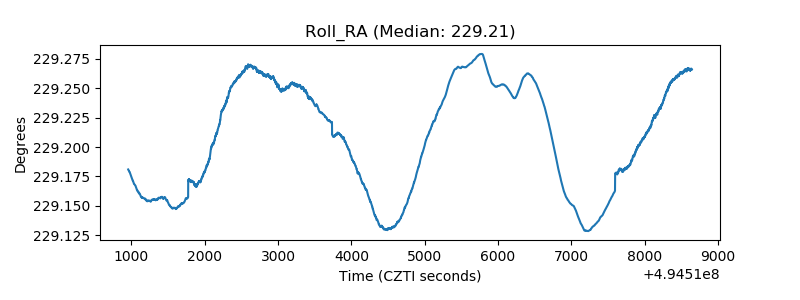 |
| Veto Counter | 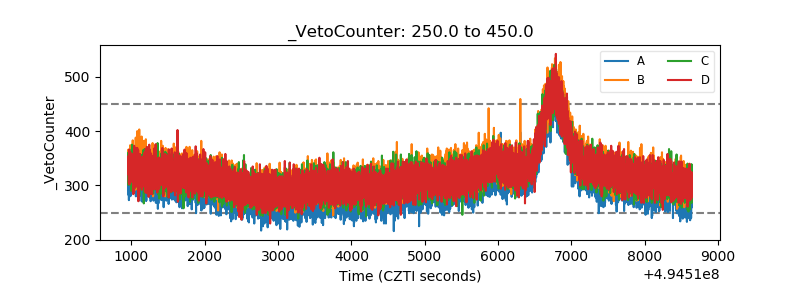 |