| Param | Original file | Final file |
|---|---|---|
| Filename | modeM0/AS1A14_022T04_9000006506_53723cztM0_level2.fits | modeM0/AS1A14_022T04_9000006506_53723cztM0_level2_quad_clean.evt |
| Size (bytes) | 981,930,240 | 88,804,800 |
| Size | 936.4 MB | 84.7 MB |
| Events in quadrant A | 13,518,541 | 324,900 |
| Events in quadrant B | 3,754,558 | 750,956 |
| Events in quadrant C | 11,042,683 | 493,716 |
| Events in quadrant D | 7,451,400 | 595,767 |
| Mode M0 | |||
|---|---|---|---|
| Quadrant | BADHDUFLAG | Total packets | Discarded packets |
| A | 0 | 45358 | 6 |
| B | 0 | 16727 | 0 |
| C | 0 | 38052 | 0 |
| D | 0 | 27444 | 0 |
| Mode SS | |||
|---|---|---|---|
| Quadrant | BADHDUFLAG | Total packets | Discarded packets |
| A | 0 | 150 | 0 |
| B | 0 | 150 | 0 |
| C | 0 | 150 | 0 |
| D | 0 | 150 | 0 |
| Quadrant | Total seconds | Saturated seconds | Saturation percentage |
|---|---|---|---|
| A | 7516 | 4320 | 57.477382% |
| B | 7516 | 77 | 1.024481% |
| C | 7517 | 2419 | 32.180391% |
| D | 7517 | 778 | 10.349874% |
Noise dominated data is calculated using 1-second bins in cleaned event files. If a bin has >2000 counts, and if more than 50% of those come from <1% of pixels, then it is considered to be noise-dominated and hence unusable.
| Quadrant | # 1 sec bins | Bins with >0 counts | Bins with >2000 counts | High rate bins dominated by noise | Noise dominated (total time) | Noise dominated (detector-on time) | Marked lightcurve |
|---|---|---|---|---|---|---|---|
| A | 7516 | 7516 | 3460 | 3460 | 46.04% | 46.04% | 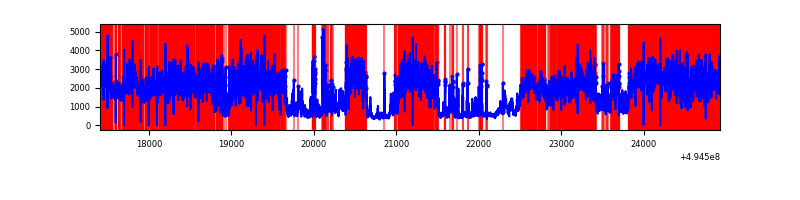 |
| B | 7516 | 7516 | 35 | 35 | 0.47% | 0.47% | 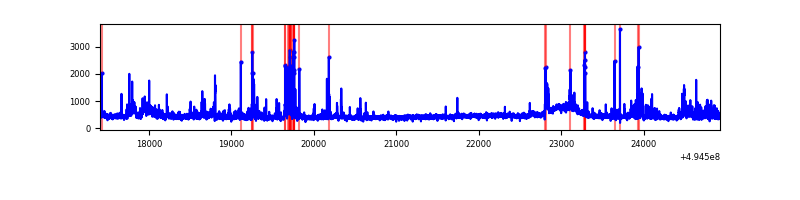 |
| C | 7517 | 7517 | 1789 | 1789 | 23.80% | 23.80% | 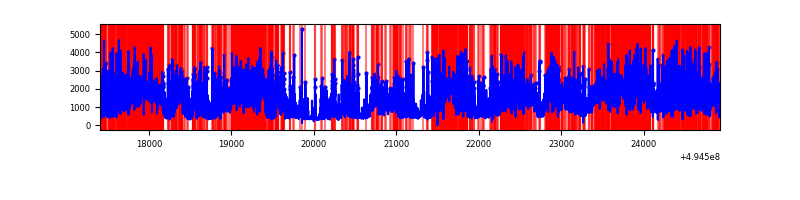 |
| D | 7517 | 7517 | 723 | 723 | 9.62% | 9.62% | 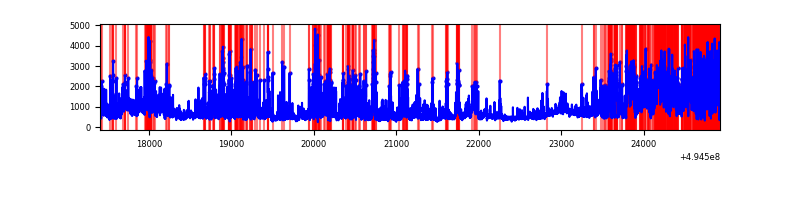 |
Top three noisy pixels from each quadrant. If the there are fewer than three noisy pixels in the level2.evt file, extra rows are filled as -1
| Pixel properties | Quadrant properties | ||||||
|---|---|---|---|---|---|---|---|
| Quadrant | DetID | PixID | Counts | Sigma | Mean | Median | Sigma |
| A | 3 | 63 | 6538116 | 47577.75 | 548 | 535 | 137.4 |
| A | 3 | 78 | 4200264 | 30563.85 | 548 | 535 | 137.4 |
| A | 8 | 245 | 132363 | 959.39 | 548 | 535 | 137.4 |
| B | 7 | 0 | 200697 | 1203.97 | 776 | 750 | 166.1 |
| B | 5 | 185 | 150958 | 904.47 | 776 | 750 | 166.1 |
| B | 10 | 247 | 77835 | 464.16 | 776 | 750 | 166.1 |
| C | 15 | 224 | 4390132 | 23521.8 | 677 | 671 | 186.6 |
| C | 15 | 158 | 3205688 | 17174.72 | 677 | 671 | 186.6 |
| C | 5 | 10 | 167276 | 892.78 | 677 | 671 | 186.6 |
| D | 1 | 241 | 1209477 | 5663.57 | 747 | 716 | 213.4 |
| D | 2 | 172 | 958873 | 4489.38 | 747 | 716 | 213.4 |
| D | 7 | 110 | 806377 | 3774.87 | 747 | 716 | 213.4 |
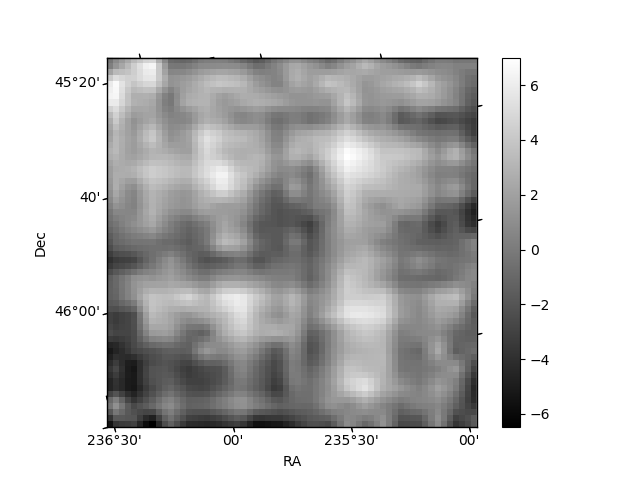
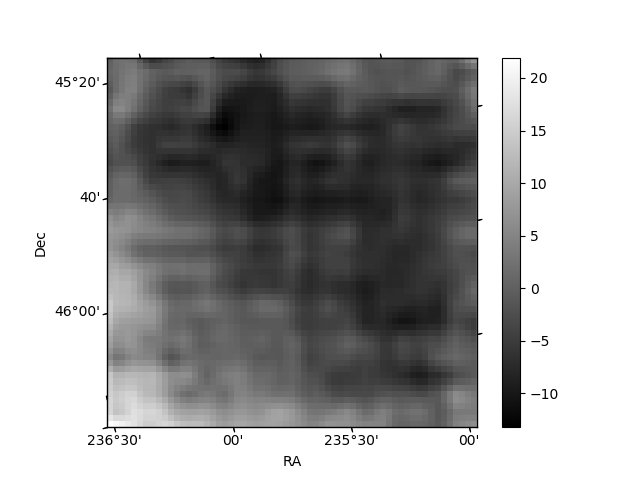
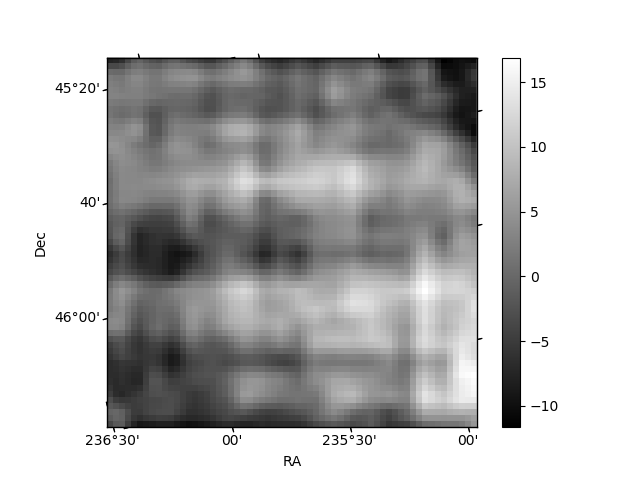
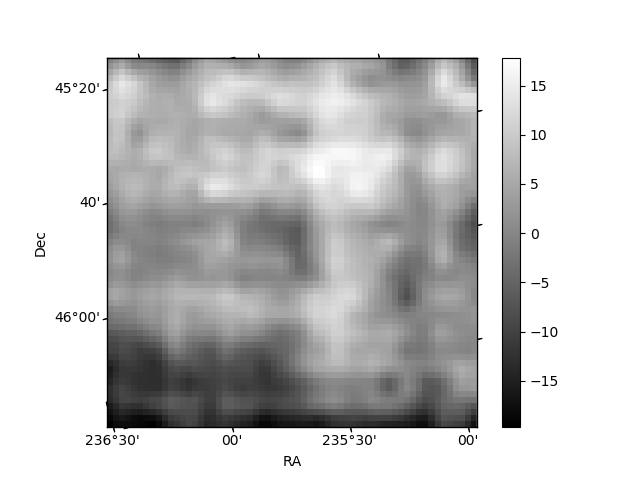
Histogram calculated using DETX and DETY for each event in the final _common_clean file
| Quadrant A | 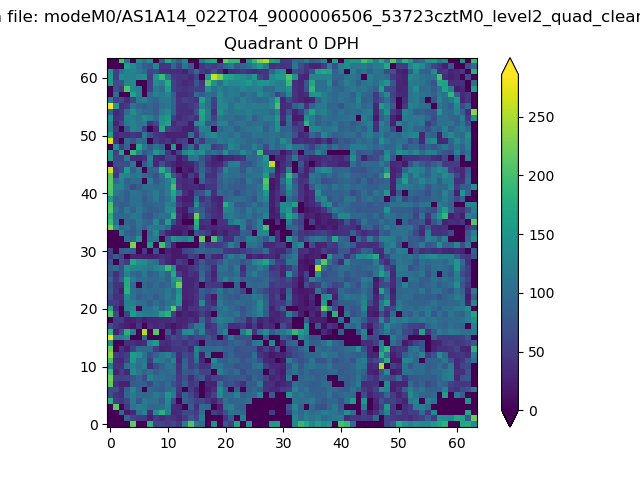 |
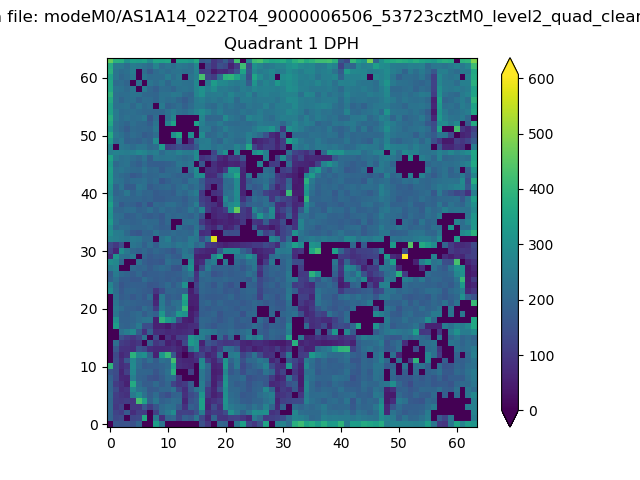 |
Quadrant B |
|---|---|---|---|
| Quadrant D | 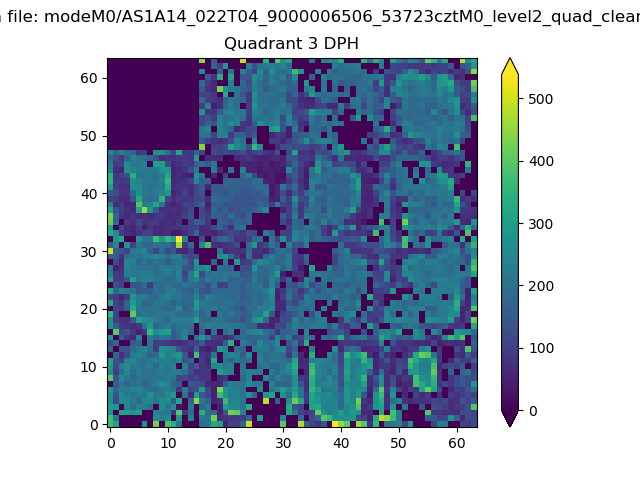 |
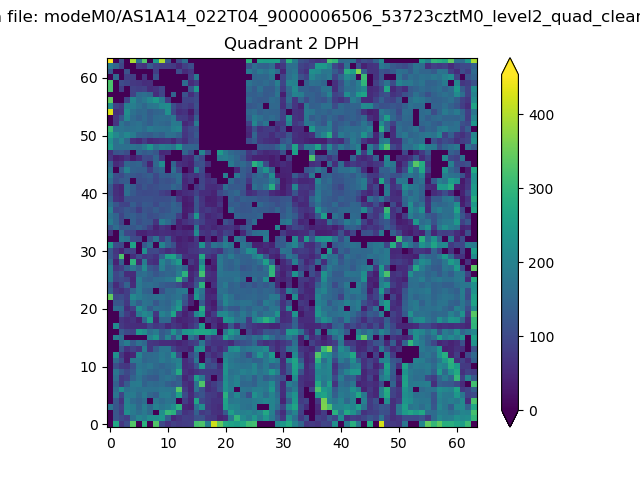 |
Quadrant C |
| Plot type | Count rate plots | Images |
|---|---|---|
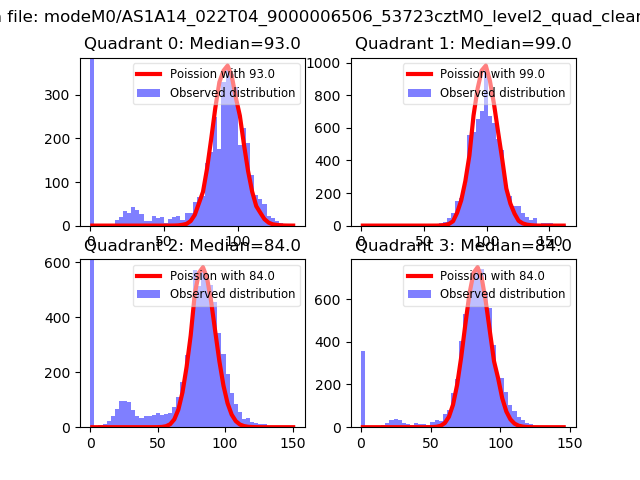
| Comparison with Poisson distribution Blue bars denote a histogram of data divided into 1 sec bins. Red curve is a Poisson curve with rate = median count rate of data. |
 |
 |
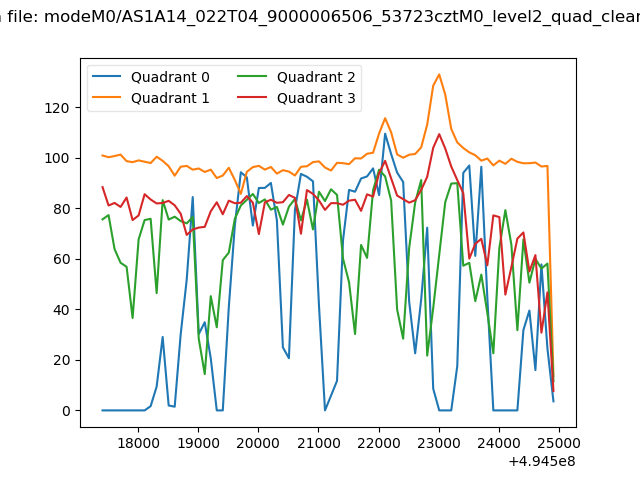
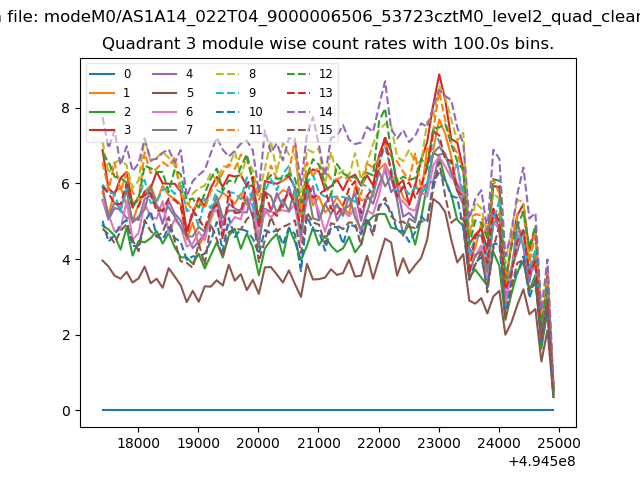
| Quadrant-wise count rates Data is divided into 100 sec bins |
 |
|
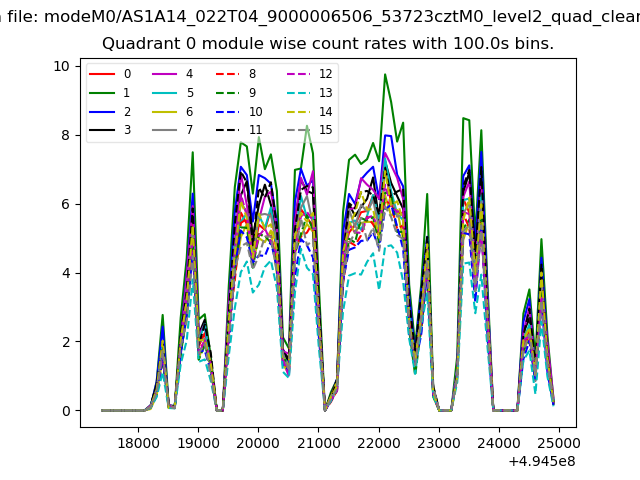
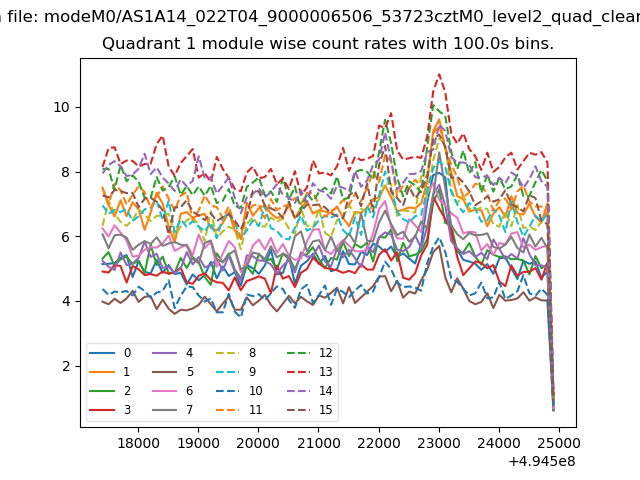
| Module-wise count rates for Quadrant A Data is divided into 100 sec bins |
 |
 |
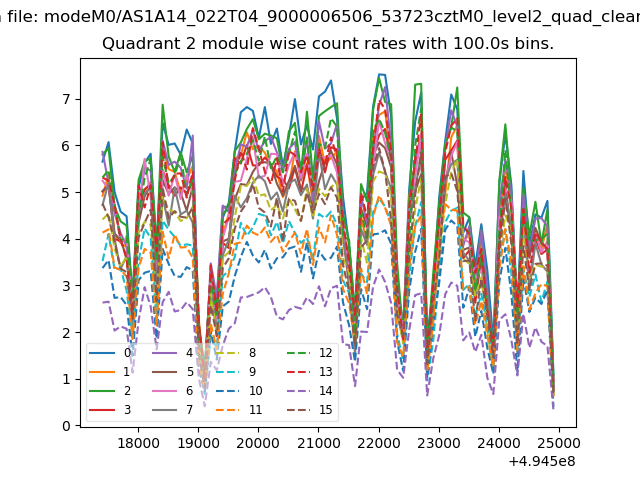
| Module-wise count rates for Quadrant B Data is divided into 100 sec bins |
 |
 |
| Module-wise count rates for Quadrant C Data is divided into 100 sec bins |
 |
 |
| Module-wise count rates for Quadrant D Data is divided into 100 sec bins |
 |
 |
| Parameter | Plot |
|---|---|
| CZT HV Monitor |  |
| D_VDD | 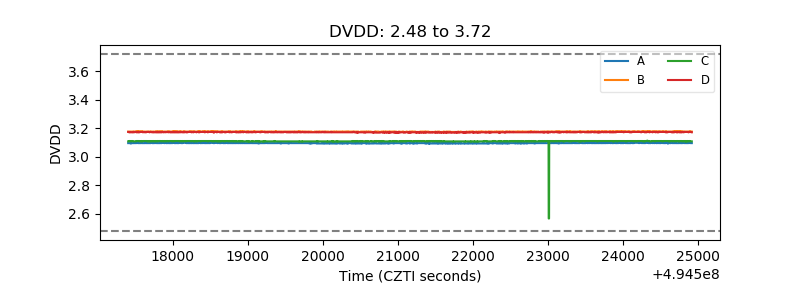 |
| Temperature 1 | 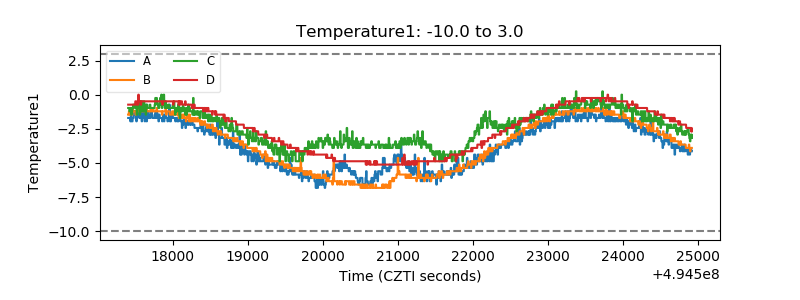 |
| Veto HV Monitor | 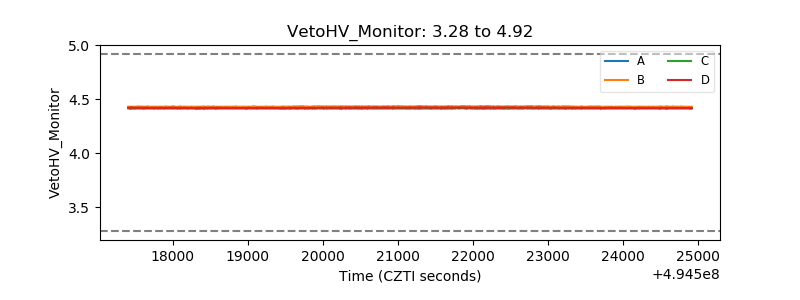 |
| Veto LLD | 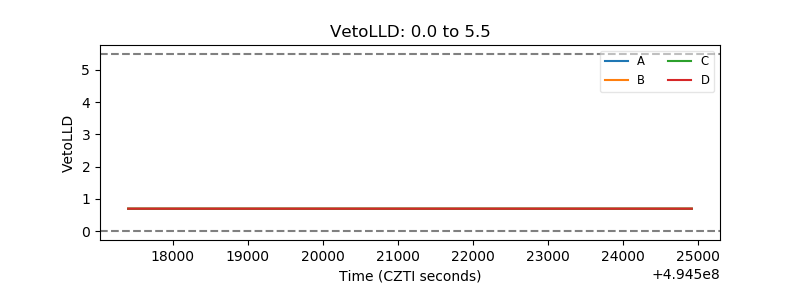 |
| Alpha Counter | 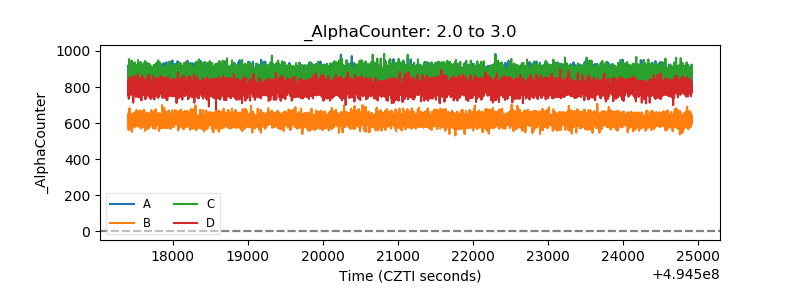 |
| _CPM_Rate | 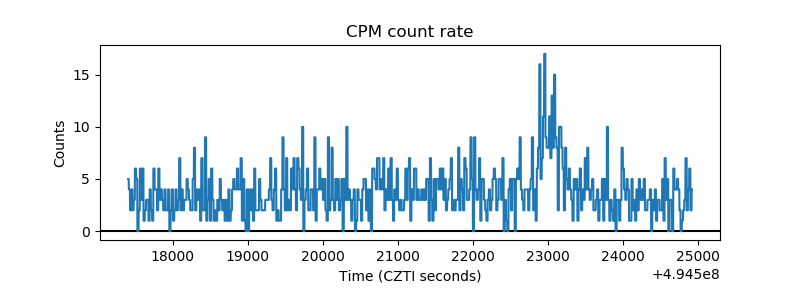 |
| CZT Counter | 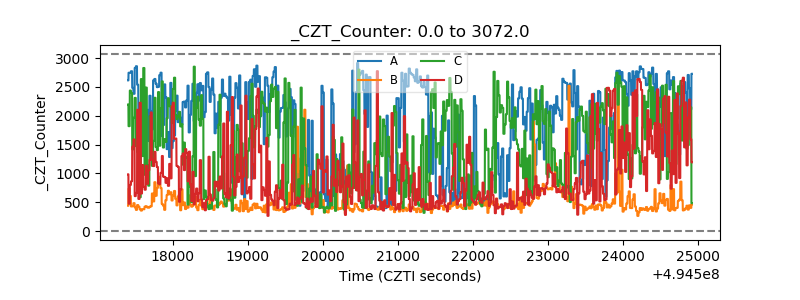 |
| +2.5 Volts monitor |  |
| +5 Volts monitor | 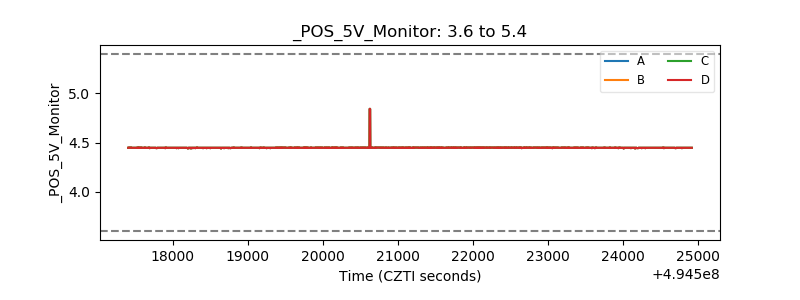 |
| _ROLL_ROT | 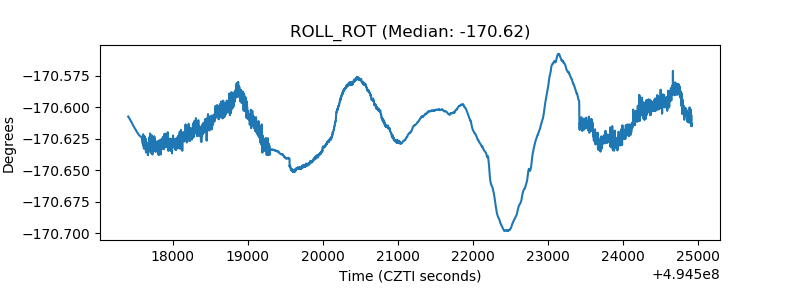 |
| _Roll_DEC | 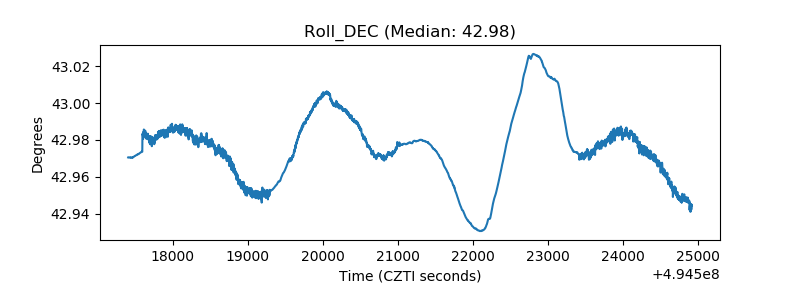 |
| _Roll_RA | 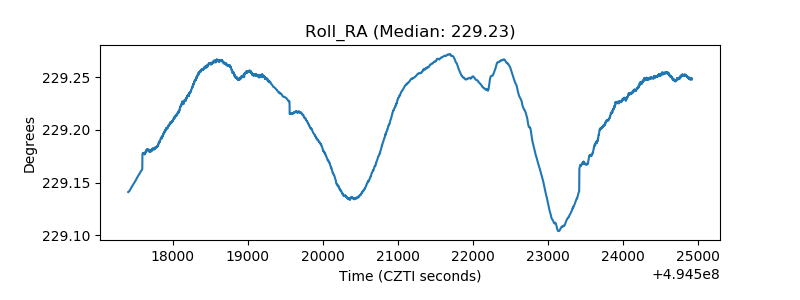 |
| Veto Counter | 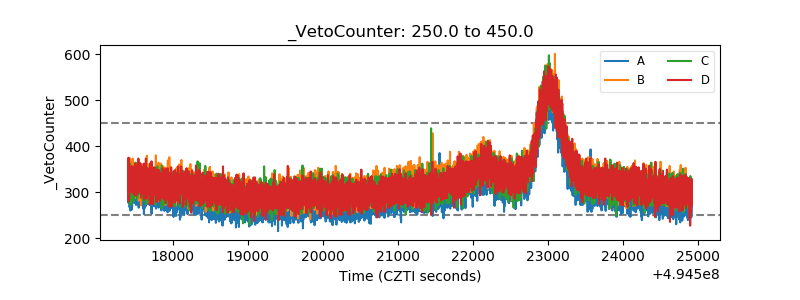 |