| Param | Original file | Final file |
|---|---|---|
| Filename | modeM0/AS1A14_022T04_9000006506_53726cztM0_level2.fits | modeM0/AS1A14_022T04_9000006506_53726cztM0_level2_quad_clean.evt |
| Size (bytes) | 2,086,778,880 | 181,071,360 |
| Size | 1.9 GB | 172.7 MB |
| Events in quadrant A | 31,447,877 | 625,937 |
| Events in quadrant B | 7,666,001 | 1,552,808 |
| Events in quadrant C | 21,465,649 | 1,028,994 |
| Events in quadrant D | 15,437,780 | 1,172,917 |
| Mode M0 | |||
|---|---|---|---|
| Quadrant | BADHDUFLAG | Total packets | Discarded packets |
| A | 0 | 104521 | 4 |
| B | 0 | 34814 | 2 |
| C | 0 | 74885 | 2 |
| D | 0 | 56964 | 2 |
| Mode SS | |||
|---|---|---|---|
| Quadrant | BADHDUFLAG | Total packets | Discarded packets |
| A | 0 | 322 | 0 |
| B | 0 | 322 | 0 |
| C | 0 | 322 | 0 |
| D | 0 | 322 | 0 |
| Mode M9 | |||
|---|---|---|---|
| Quadrant | BADHDUFLAG | Total packets | Discarded packets |
| A | 0 | 8 | 0 |
| B | 0 | 8 | 0 |
| C | 0 | 8 | 0 |
| D | 0 | 8 | 0 |
| Quadrant | Total seconds | Saturated seconds | Saturation percentage |
|---|---|---|---|
| A | 15956 | 9363 | 58.680120% |
| B | 15956 | 143 | 0.896215% |
| C | 15956 | 4547 | 28.497117% |
| D | 15956 | 2009 | 12.590875% |
Noise dominated data is calculated using 1-second bins in cleaned event files. If a bin has >2000 counts, and if more than 50% of those come from <1% of pixels, then it is considered to be noise-dominated and hence unusable.
| Quadrant | # 1 sec bins | Bins with >0 counts | Bins with >2000 counts | High rate bins dominated by noise | Noise dominated (total time) | Noise dominated (detector-on time) | Marked lightcurve |
|---|---|---|---|---|---|---|---|
| A | 16736 | 15957 | 9048 | 9048 | 54.06% | 56.70% | 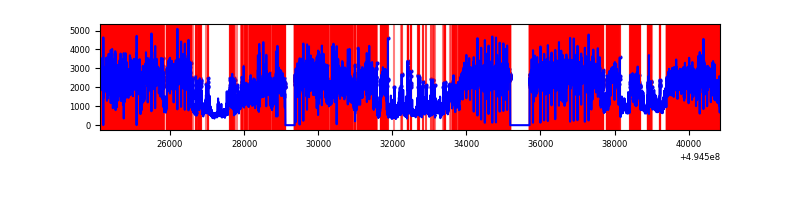 |
| B | 16736 | 15958 | 57 | 57 | 0.34% | 0.36% | 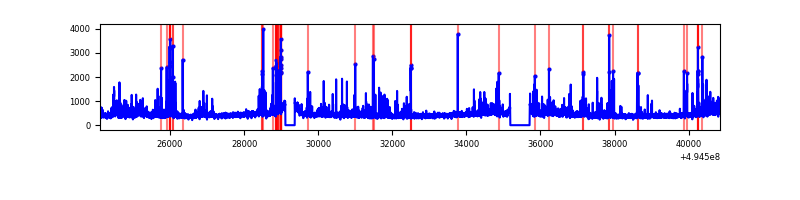 |
| C | 16736 | 15958 | 3503 | 3503 | 20.93% | 21.95% | 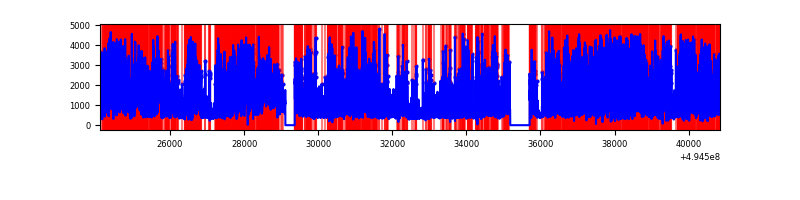 |
| D | 16736 | 15958 | 1948 | 1948 | 11.64% | 12.21% | 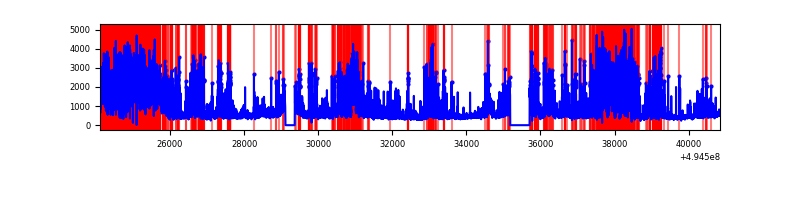 |
Top three noisy pixels from each quadrant. If the there are fewer than three noisy pixels in the level2.evt file, extra rows are filled as -1
| Pixel properties | Quadrant properties | ||||||
|---|---|---|---|---|---|---|---|
| Quadrant | DetID | PixID | Counts | Sigma | Mean | Median | Sigma |
| A | 3 | 63 | 24355866 | 83747.14 | 1145 | 1116 | 290.8 |
| A | 3 | 78 | 1209457 | 4155.05 | 1145 | 1116 | 290.8 |
| A | 0 | 8 | 385950 | 1323.3 | 1145 | 1116 | 290.8 |
| B | 5 | 185 | 391669 | 1127.45 | 1615 | 1556 | 346.0 |
| B | 7 | 0 | 280222 | 805.36 | 1615 | 1556 | 346.0 |
| B | 10 | 247 | 139225 | 397.87 | 1615 | 1556 | 346.0 |
| C | 15 | 224 | 12204108 | 31441.48 | 1400 | 1390 | 388.1 |
| C | 15 | 158 | 1296851 | 3337.88 | 1400 | 1390 | 388.1 |
| C | 7 | 64 | 437741 | 1124.3 | 1400 | 1390 | 388.1 |
| D | 1 | 241 | 3861651 | 8775.93 | 1525 | 1459 | 439.9 |
| D | 2 | 172 | 1518606 | 3449.15 | 1525 | 1459 | 439.9 |
| D | 7 | 110 | 1169080 | 2654.52 | 1525 | 1459 | 439.9 |
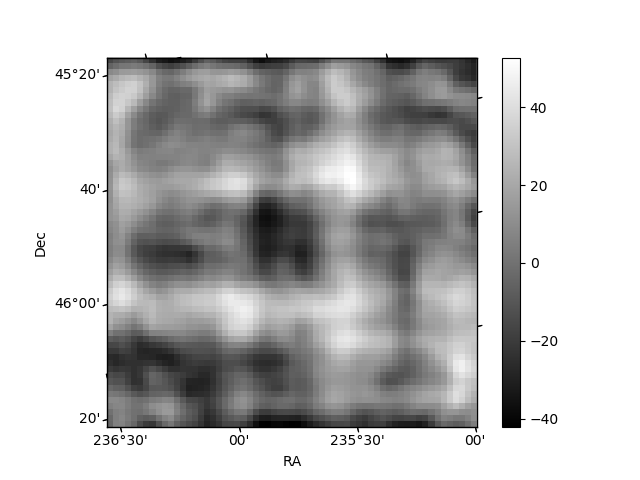
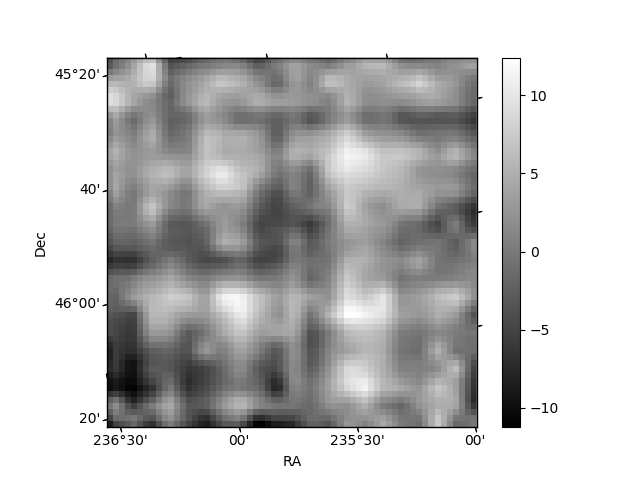
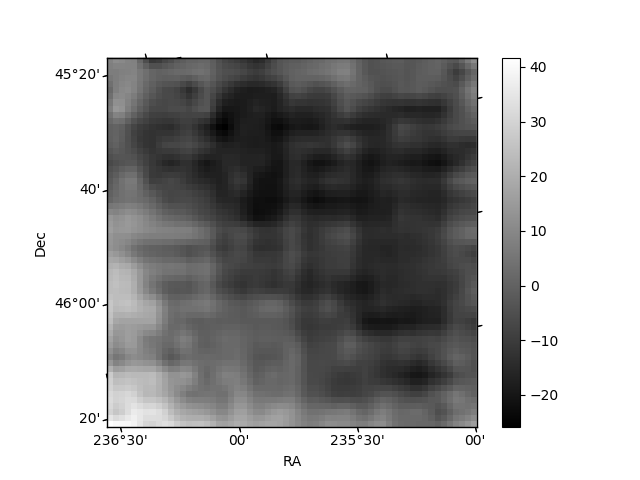
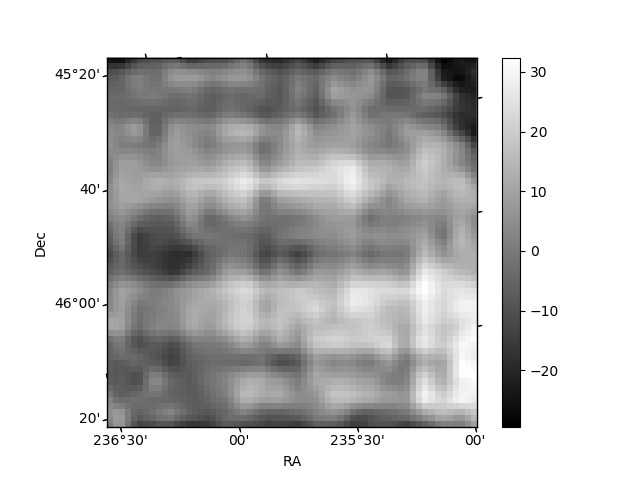
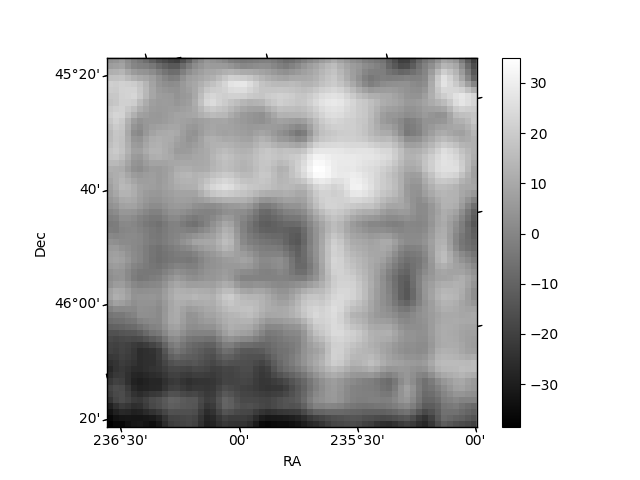
Histogram calculated using DETX and DETY for each event in the final _common_clean file
| Quadrant A | 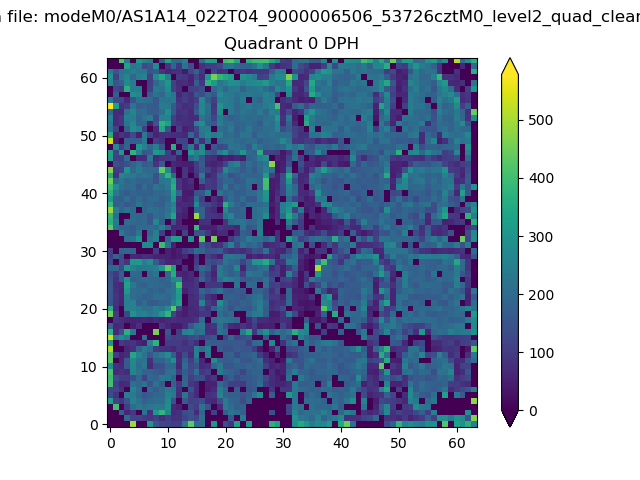 |
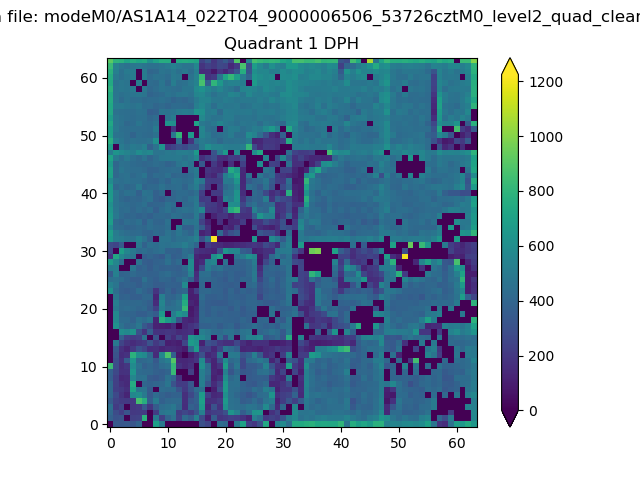 |
Quadrant B |
|---|---|---|---|
| Quadrant D | 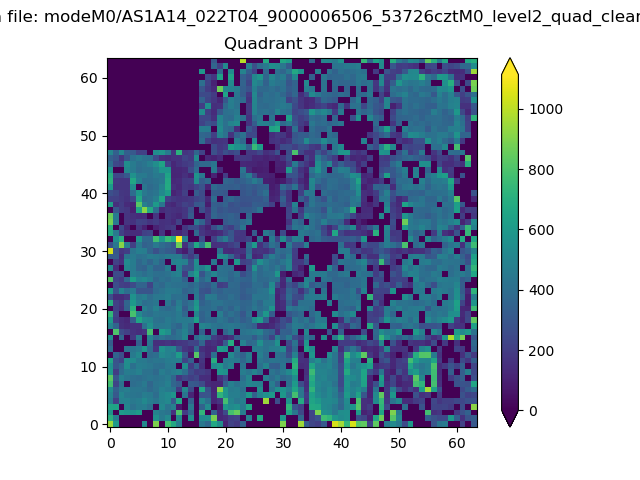 |
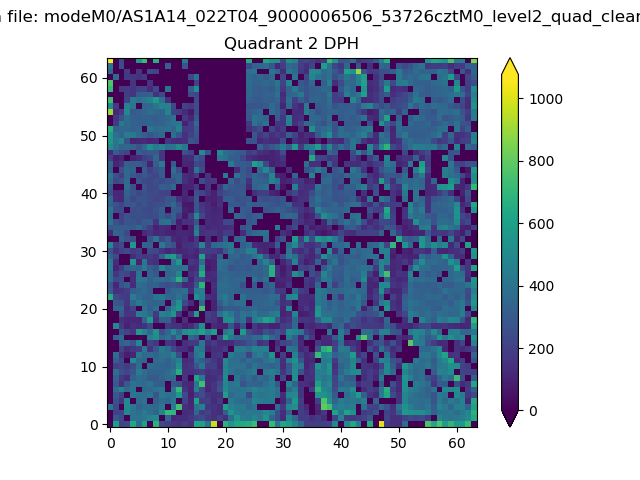 |
Quadrant C |
| Plot type | Count rate plots | Images |
|---|---|---|
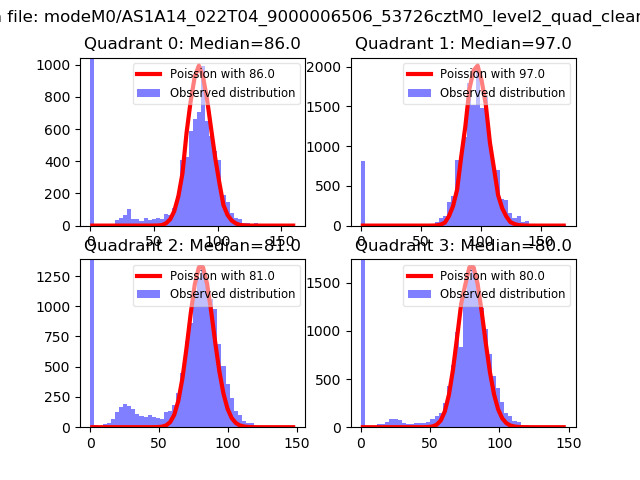
| Comparison with Poisson distribution Blue bars denote a histogram of data divided into 1 sec bins. Red curve is a Poisson curve with rate = median count rate of data. |
 |
 |
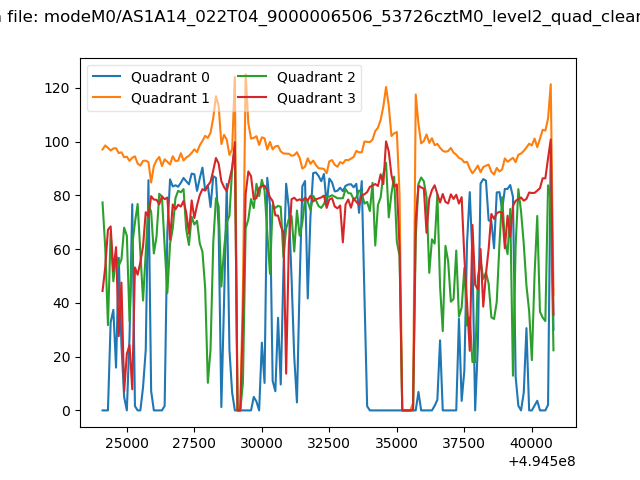
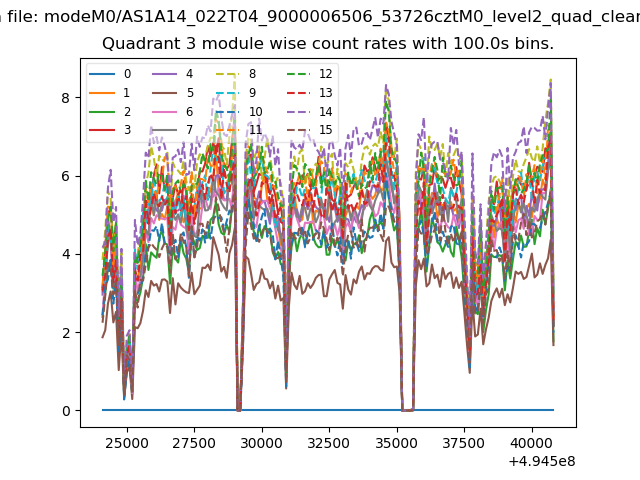
| Quadrant-wise count rates Data is divided into 100 sec bins |
 |
|
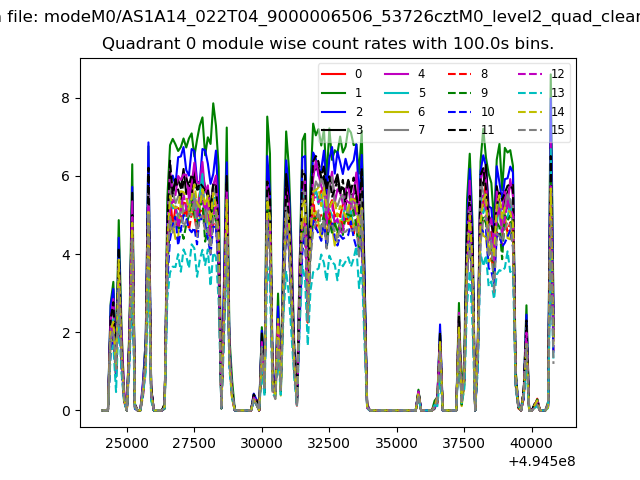
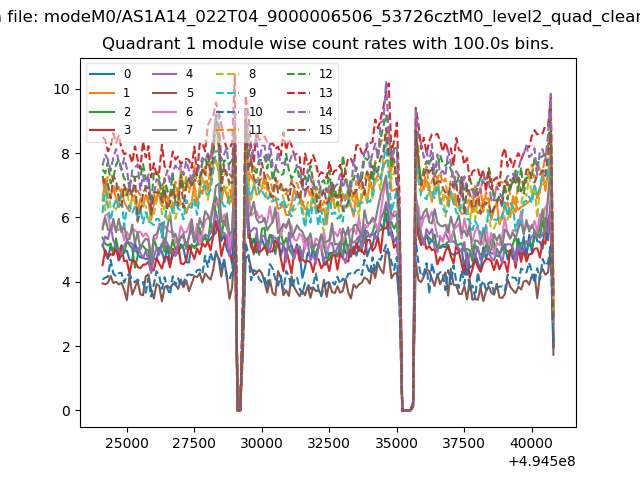
| Module-wise count rates for Quadrant A Data is divided into 100 sec bins |
 |
 |
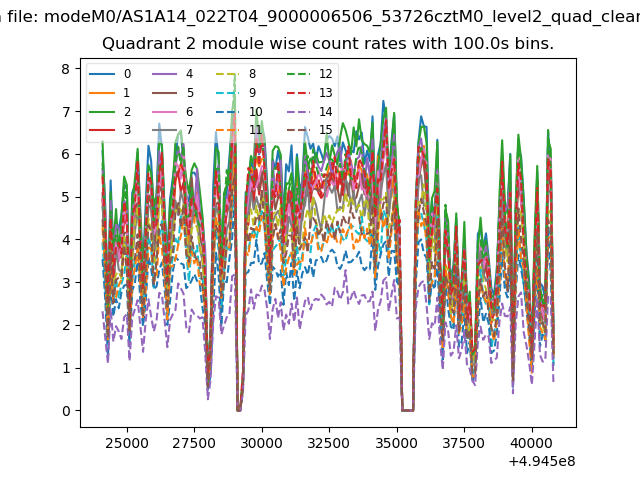
| Module-wise count rates for Quadrant B Data is divided into 100 sec bins |
 |
 |
| Module-wise count rates for Quadrant C Data is divided into 100 sec bins |
 |
 |
| Module-wise count rates for Quadrant D Data is divided into 100 sec bins |
 |
 |
| Parameter | Plot |
|---|---|
| CZT HV Monitor |  |
| D_VDD | 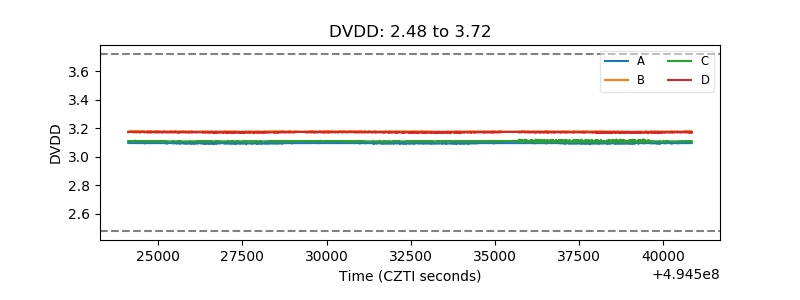 |
| Temperature 1 | 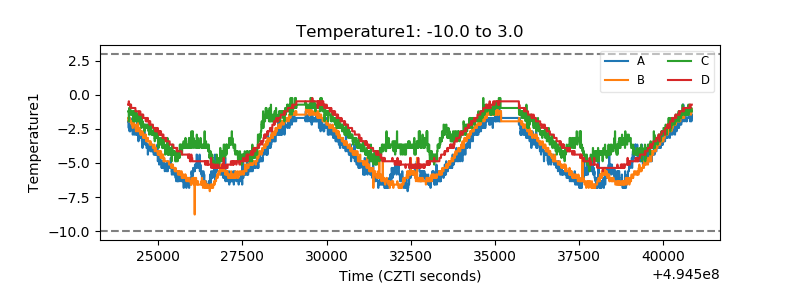 |
| Veto HV Monitor | 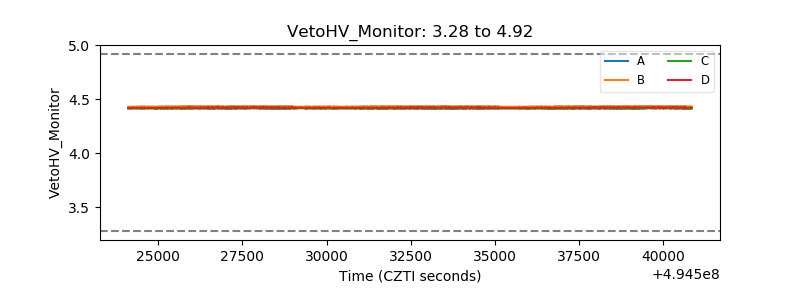 |
| Veto LLD | 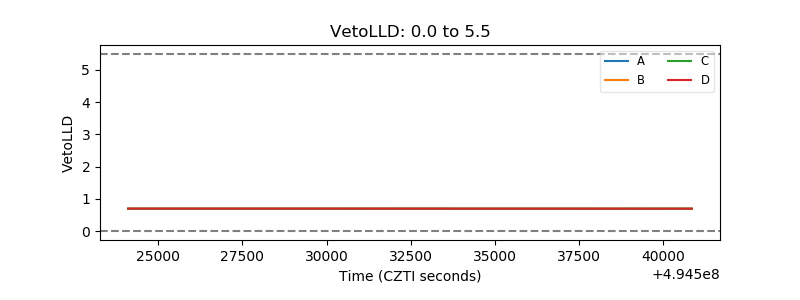 |
| Alpha Counter | 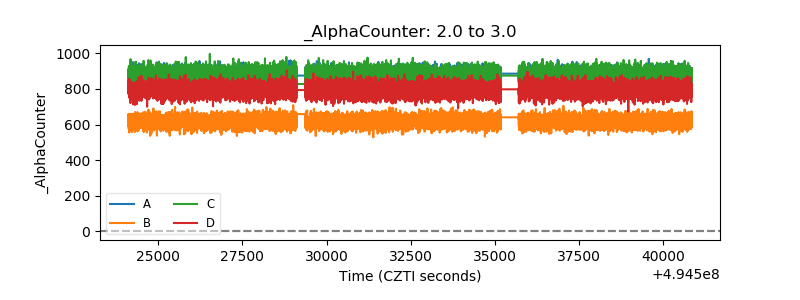 |
| _CPM_Rate | 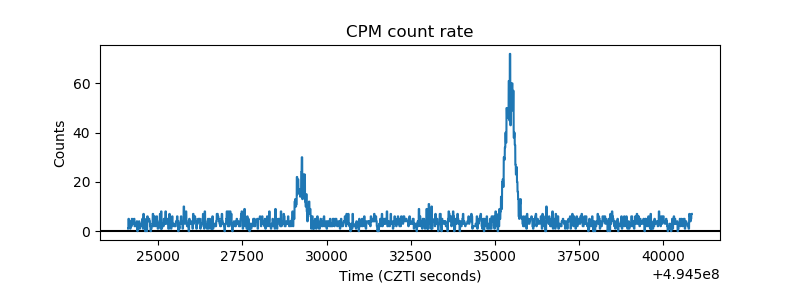 |
| CZT Counter | 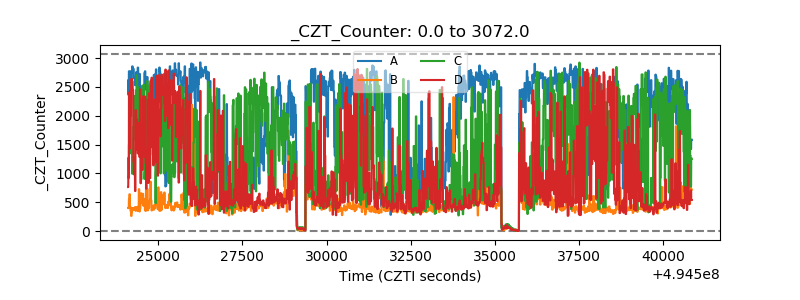 |
| +2.5 Volts monitor |  |
| +5 Volts monitor |  |
| _ROLL_ROT | 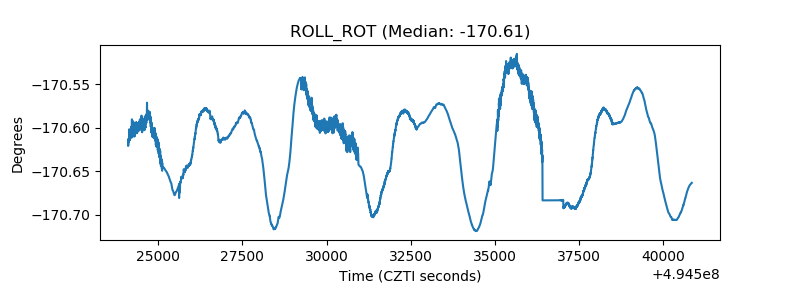 |
| _Roll_DEC | 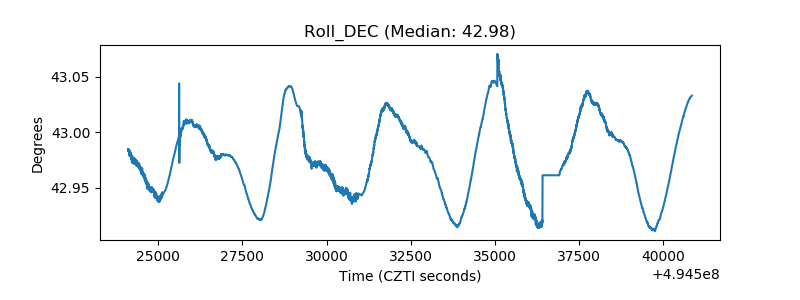 |
| _Roll_RA | 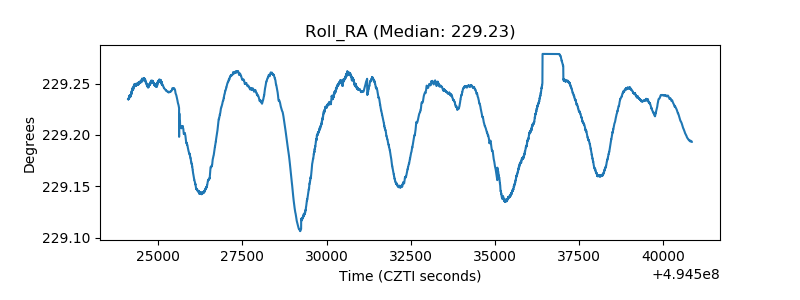 |
| Veto Counter | 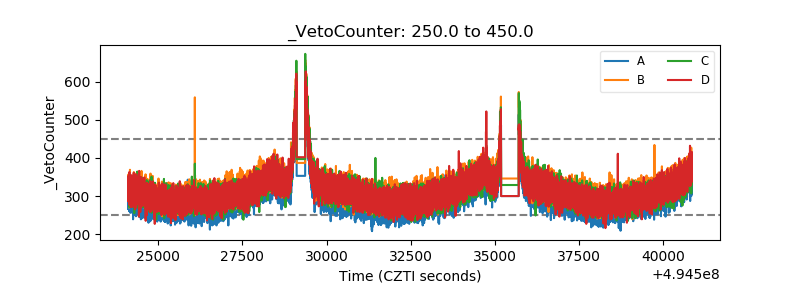 |