| Param | Original file | Final file |
|---|---|---|
| Filename | modeM0/AS1A14_022T04_9000006506_53727cztM0_level2.fits | modeM0/AS1A14_022T04_9000006506_53727cztM0_level2_quad_clean.evt |
| Size (bytes) | 1,125,895,680 | 78,552,000 |
| Size | 1.0 GB | 74.9 MB |
| Events in quadrant A | 18,056,603 | 122,013 |
| Events in quadrant B | 3,739,784 | 751,479 |
| Events in quadrant C | 12,826,186 | 380,916 |
| Events in quadrant D | 6,478,850 | 604,386 |
| Mode M0 | |||
|---|---|---|---|
| Quadrant | BADHDUFLAG | Total packets | Discarded packets |
| A | 0 | 58797 | 2 |
| B | 0 | 16717 | 2 |
| C | 0 | 43275 | 2 |
| D | 0 | 24456 | 2 |
| Mode SS | |||
|---|---|---|---|
| Quadrant | BADHDUFLAG | Total packets | Discarded packets |
| A | 0 | 156 | 0 |
| B | 0 | 156 | 0 |
| C | 0 | 156 | 0 |
| D | 0 | 156 | 0 |
| Mode M9 | |||
|---|---|---|---|
| Quadrant | BADHDUFLAG | Total packets | Discarded packets |
| A | 0 | 15 | 0 |
| B | 0 | 15 | 0 |
| C | 0 | 15 | 0 |
| D | 0 | 15 | 0 |
| Quadrant | Total seconds | Saturated seconds | Saturation percentage |
|---|---|---|---|
| A | 7451 | 6452 | 86.592404% |
| B | 7452 | 141 | 1.892110% |
| C | 7451 | 3693 | 49.563817% |
| D | 7451 | 626 | 8.401557% |
Noise dominated data is calculated using 1-second bins in cleaned event files. If a bin has >2000 counts, and if more than 50% of those come from <1% of pixels, then it is considered to be noise-dominated and hence unusable.
| Quadrant | # 1 sec bins | Bins with >0 counts | Bins with >2000 counts | High rate bins dominated by noise | Noise dominated (total time) | Noise dominated (detector-on time) | Marked lightcurve |
|---|---|---|---|---|---|---|---|
| A | 9026 | 7453 | 6278 | 6278 | 69.55% | 84.23% | 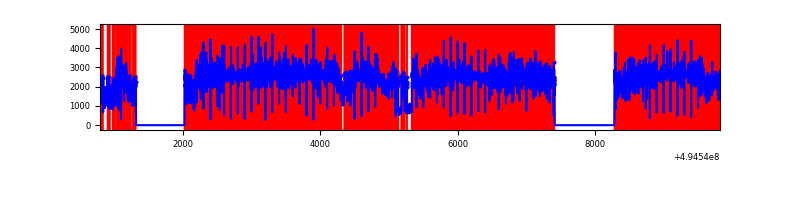 |
| B | 9027 | 7454 | 66 | 66 | 0.73% | 0.89% | 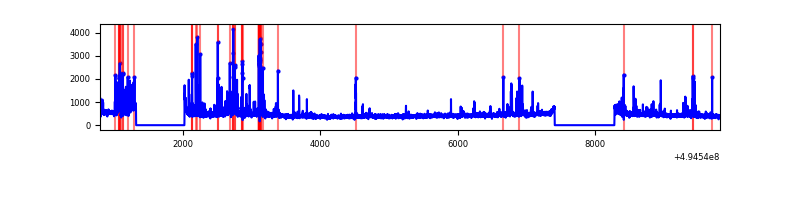 |
| C | 9026 | 7453 | 2977 | 2977 | 32.98% | 39.94% | 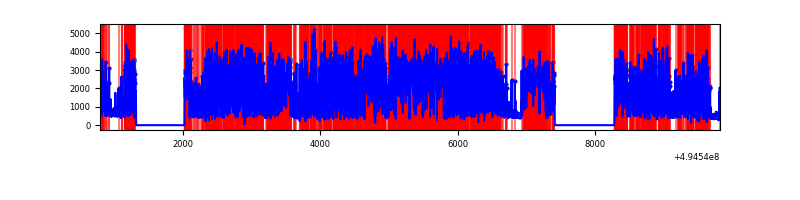 |
| D | 9026 | 7453 | 494 | 494 | 5.47% | 6.63% | 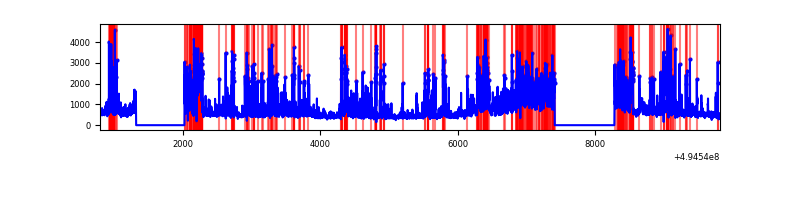 |
Top three noisy pixels from each quadrant. If the there are fewer than three noisy pixels in the level2.evt file, extra rows are filled as -1
| Pixel properties | Quadrant properties | ||||||
|---|---|---|---|---|---|---|---|
| Quadrant | DetID | PixID | Counts | Sigma | Mean | Median | Sigma |
| A | 3 | 63 | 15484622 | 145277.11 | 415 | 405 | 106.6 |
| A | 3 | 78 | 716563 | 6719.19 | 415 | 405 | 106.6 |
| A | 15 | 174 | 90416 | 844.51 | 415 | 405 | 106.6 |
| B | 0 | 213 | 279893 | 1671.79 | 774 | 745 | 167.0 |
| B | 4 | 81 | 168666 | 1005.66 | 774 | 745 | 167.0 |
| B | 2 | 136 | 31511 | 184.25 | 774 | 745 | 167.0 |
| C | 15 | 224 | 6682964 | 41625.61 | 577 | 573 | 160.5 |
| C | 1 | 241 | 2692596 | 16769.01 | 577 | 573 | 160.5 |
| C | 15 | 147 | 753257 | 4688.58 | 577 | 573 | 160.5 |
| D | 1 | 241 | 1362421 | 6379.6 | 741 | 708 | 213.4 |
| D | 2 | 172 | 551449 | 2580.21 | 741 | 708 | 213.4 |
| D | 10 | 118 | 366079 | 1711.76 | 741 | 708 | 213.4 |
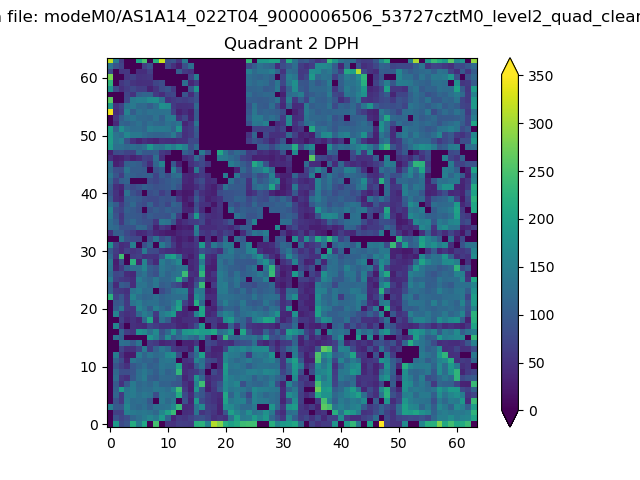
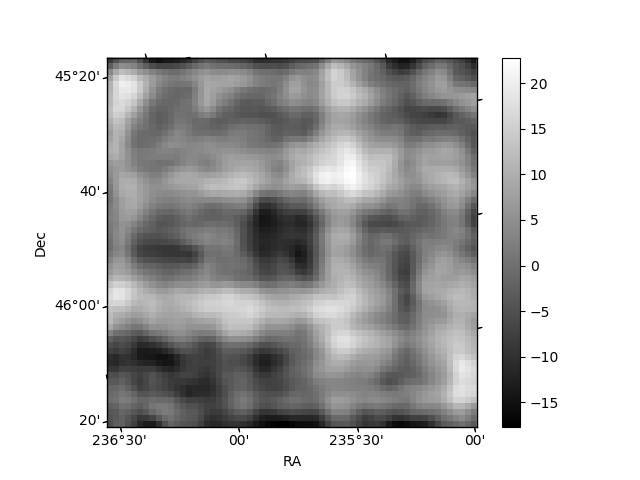
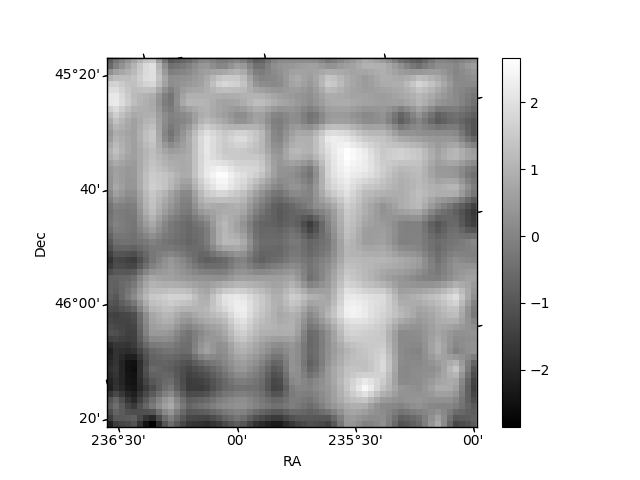
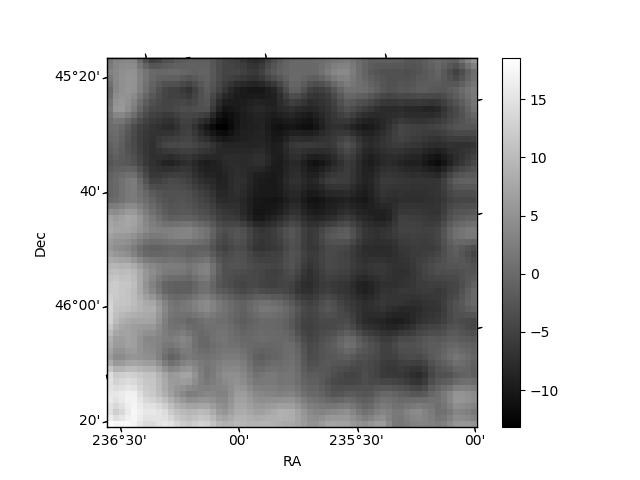
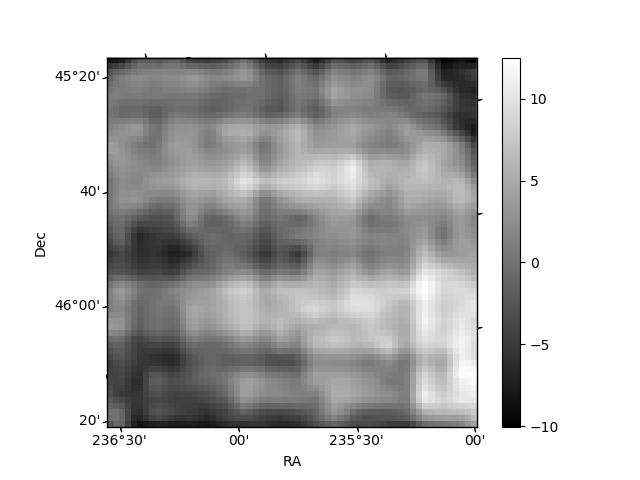
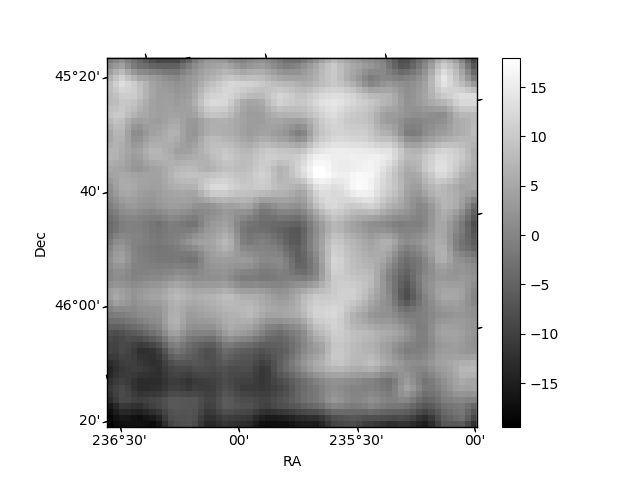
Histogram calculated using DETX and DETY for each event in the final _common_clean file
| Quadrant A | 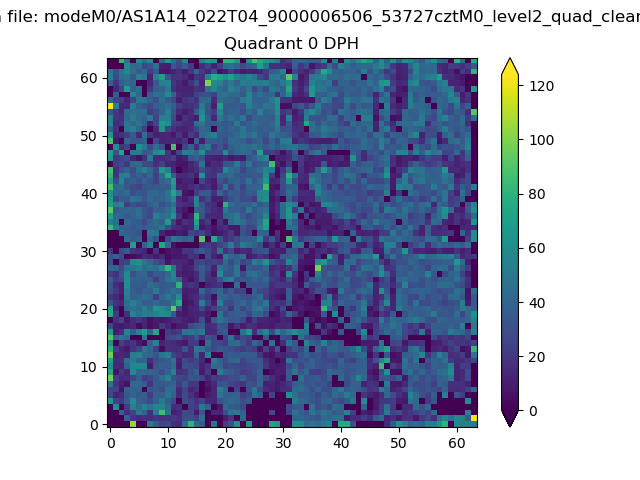 |
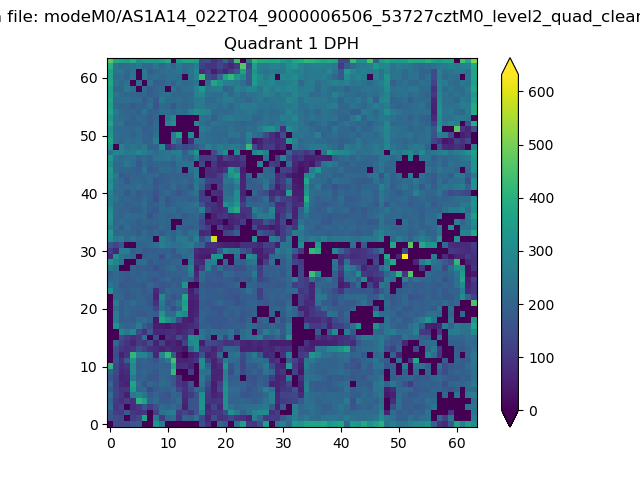 |
Quadrant B |
|---|---|---|---|
| Quadrant D | 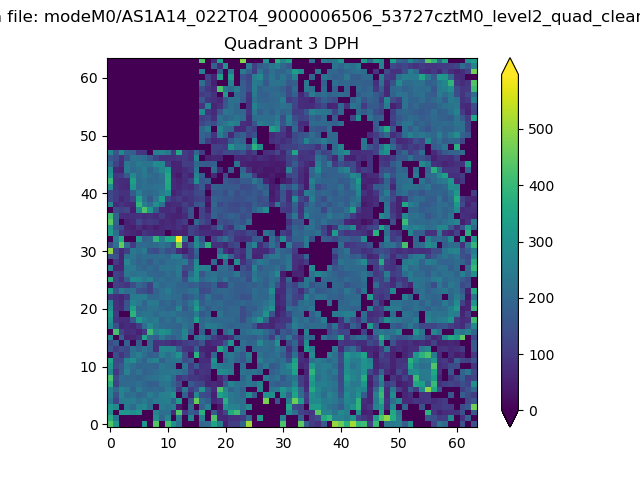 |
 |
Quadrant C |
| Plot type | Count rate plots | Images |
|---|---|---|
| Comparison with Poisson distribution Blue bars denote a histogram of data divided into 1 sec bins. Red curve is a Poisson curve with rate = median count rate of data. |
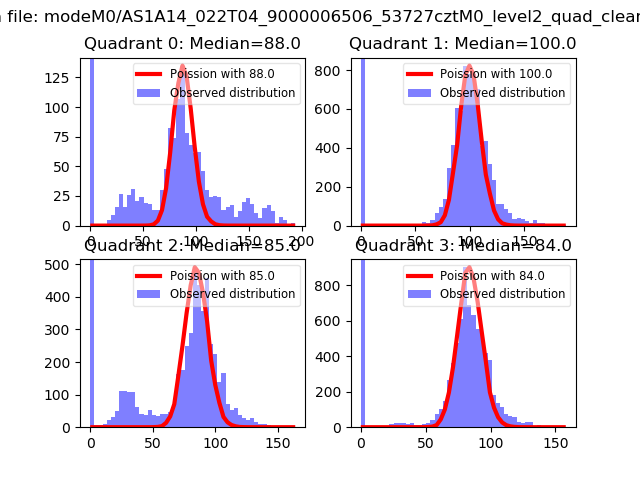 |
 |
| Quadrant-wise count rates Data is divided into 100 sec bins |
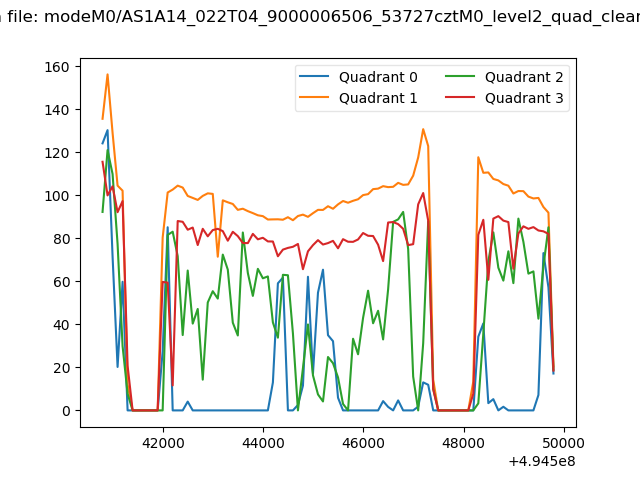 |
|
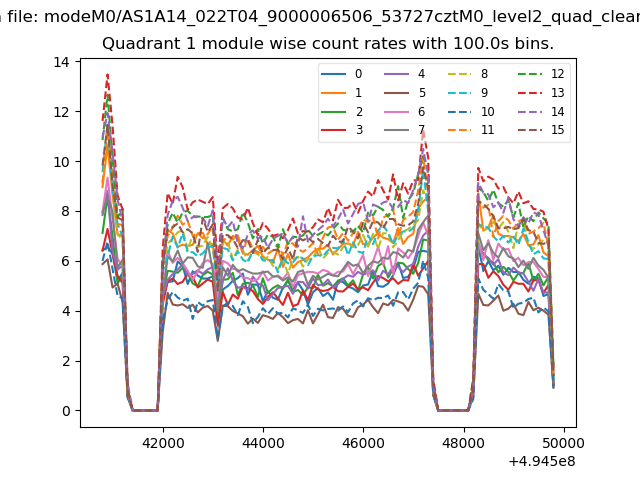
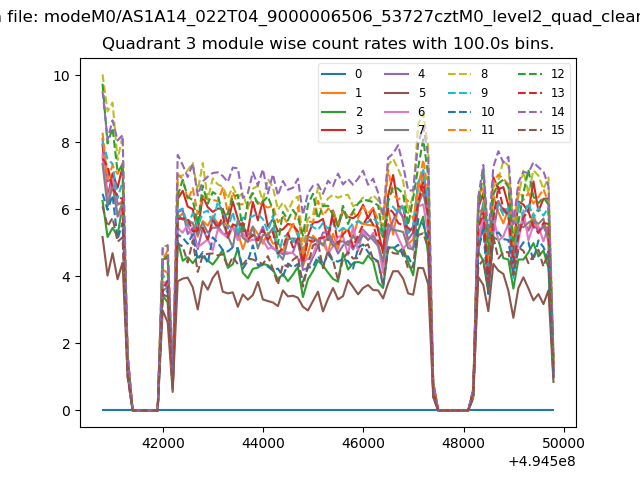
| Module-wise count rates for Quadrant A Data is divided into 100 sec bins |
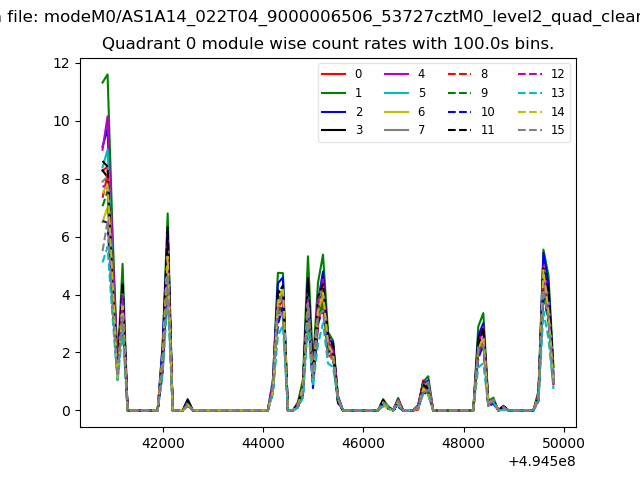 |
 |
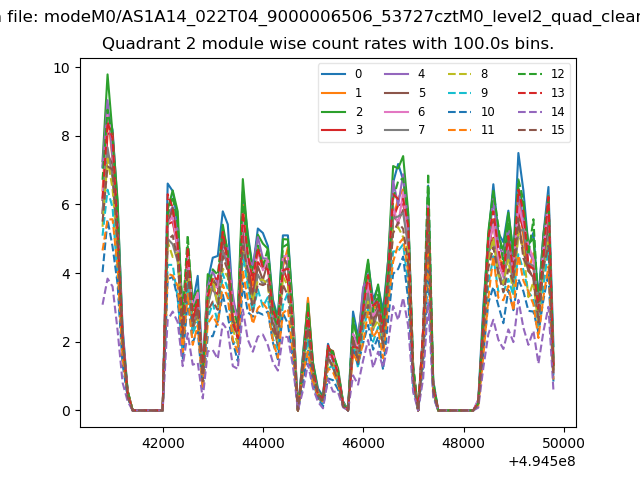
| Module-wise count rates for Quadrant B Data is divided into 100 sec bins |
 |
 |
| Module-wise count rates for Quadrant C Data is divided into 100 sec bins |
 |
 |
| Module-wise count rates for Quadrant D Data is divided into 100 sec bins |
 |
 |
| Parameter | Plot |
|---|---|
| CZT HV Monitor | 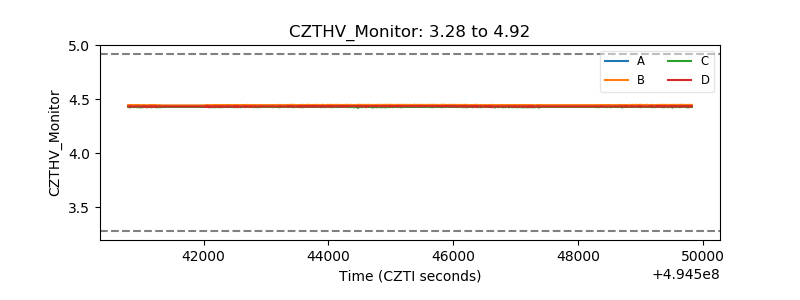 |
| D_VDD | 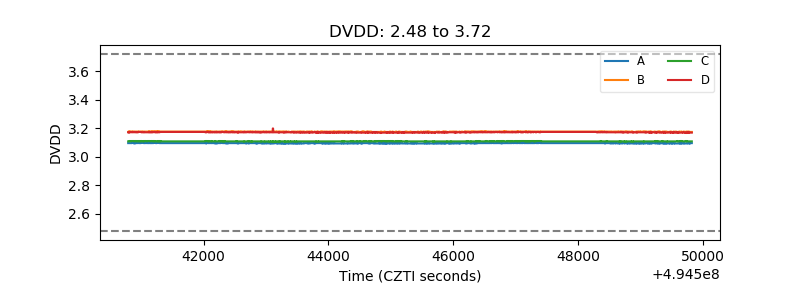 |
| Temperature 1 | 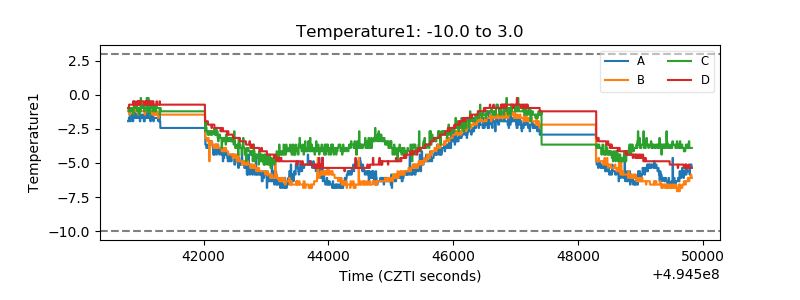 |
| Veto HV Monitor | 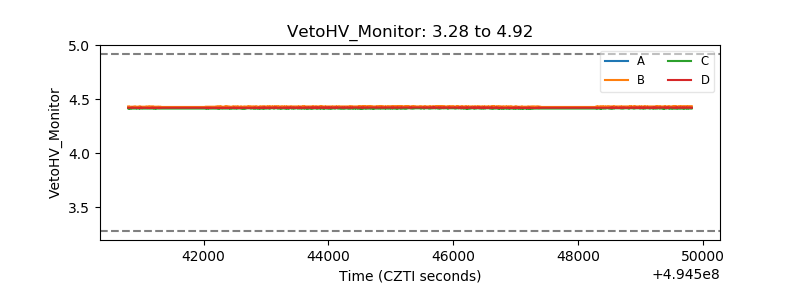 |
| Veto LLD | 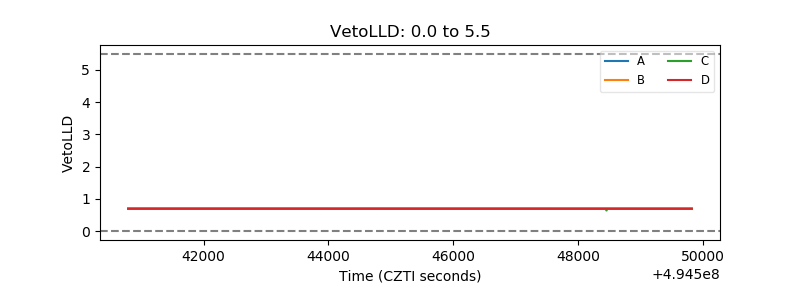 |
| Alpha Counter | 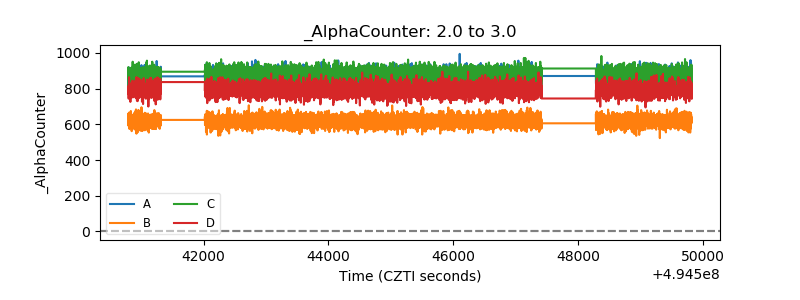 |
| _CPM_Rate | 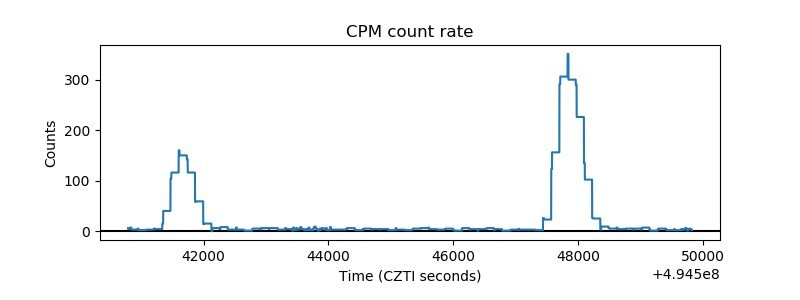 |
| CZT Counter | 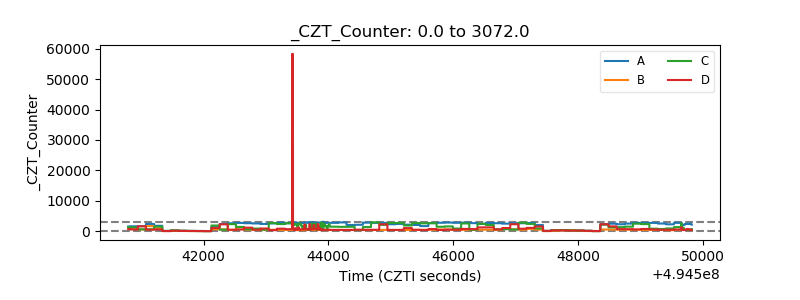 |
| +2.5 Volts monitor |  |
| +5 Volts monitor |  |
| _ROLL_ROT | 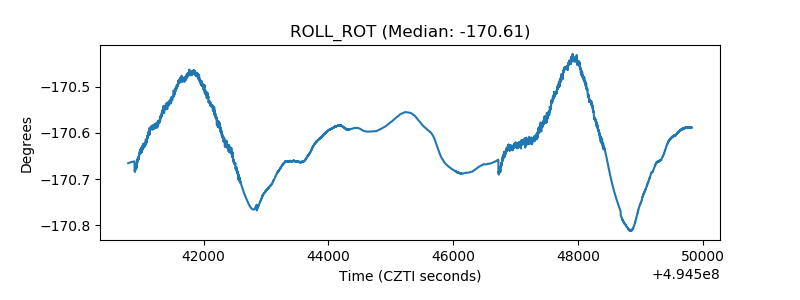 |
| _Roll_DEC | 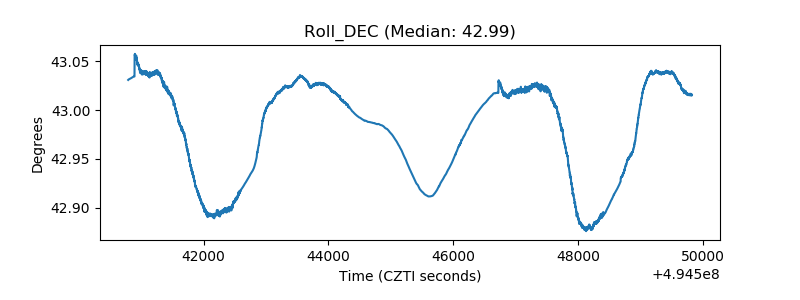 |
| _Roll_RA | 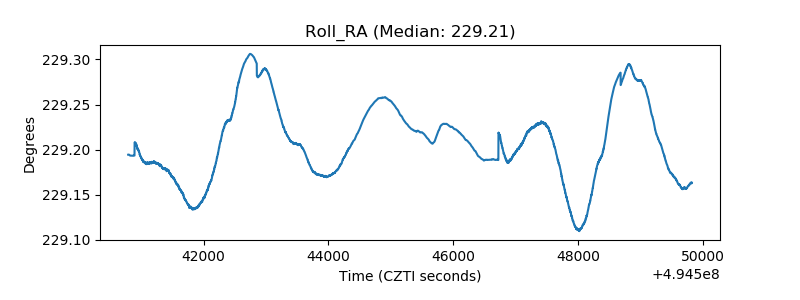 |
| Veto Counter | 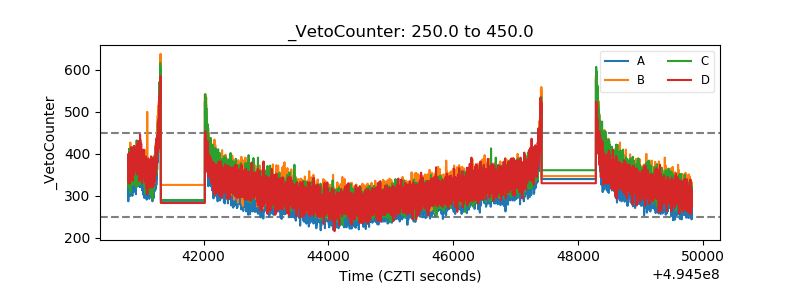 |