| Param | Original file | Final file |
|---|---|---|
| Filename | modeM0/AS1A14_022T04_9000006506_53729cztM0_level2.fits | modeM0/AS1A14_022T04_9000006506_53729cztM0_level2_quad_clean.evt |
| Size (bytes) | 1,037,946,240 | 62,953,920 |
| Size | 989.9 MB | 60.0 MB |
| Events in quadrant A | 16,204,748 | 59,102 |
| Events in quadrant B | 2,909,000 | 644,171 |
| Events in quadrant C | 12,110,000 | 270,654 |
| Events in quadrant D | 6,698,015 | 480,306 |
| Mode M0 | |||
|---|---|---|---|
| Quadrant | BADHDUFLAG | Total packets | Discarded packets |
| A | 0 | 52593 | 1 |
| B | 0 | 13568 | 1 |
| C | 0 | 40418 | 1 |
| D | 0 | 24443 | 1 |
| Mode SS | |||
|---|---|---|---|
| Quadrant | BADHDUFLAG | Total packets | Discarded packets |
| A | 0 | 132 | 0 |
| B | 0 | 132 | 0 |
| C | 0 | 132 | 0 |
| D | 0 | 132 | 0 |
| Mode M9 | |||
|---|---|---|---|
| Quadrant | BADHDUFLAG | Total packets | Discarded packets |
| A | 0 | 10 | 0 |
| B | 0 | 10 | 0 |
| C | 0 | 10 | 0 |
| D | 0 | 10 | 0 |
| Quadrant | Total seconds | Saturated seconds | Saturation percentage |
|---|---|---|---|
| A | 6470 | 5910 | 91.344668% |
| B | 6470 | 80 | 1.236476% |
| C | 6469 | 3729 | 57.644149% |
| D | 6469 | 990 | 15.303756% |
Noise dominated data is calculated using 1-second bins in cleaned event files. If a bin has >2000 counts, and if more than 50% of those come from <1% of pixels, then it is considered to be noise-dominated and hence unusable.
| Quadrant | # 1 sec bins | Bins with >0 counts | Bins with >2000 counts | High rate bins dominated by noise | Noise dominated (total time) | Noise dominated (detector-on time) | Marked lightcurve |
|---|---|---|---|---|---|---|---|
| A | 7449 | 6469 | 5836 | 5836 | 78.35% | 90.21% | 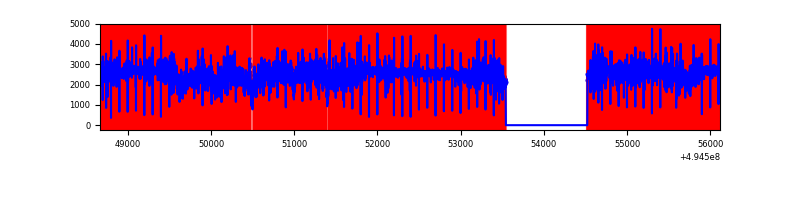 |
| B | 7450 | 6471 | 21 | 21 | 0.28% | 0.32% |  |
| C | 7449 | 6469 | 3162 | 3162 | 42.45% | 48.88% | 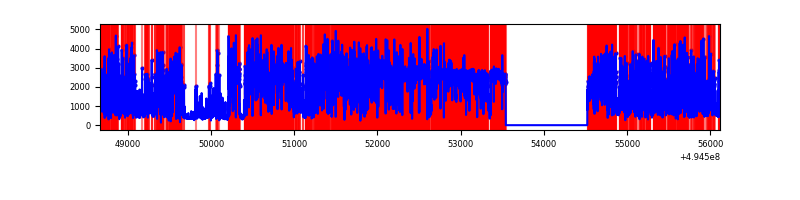 |
| D | 7449 | 6470 | 851 | 851 | 11.42% | 13.15% | 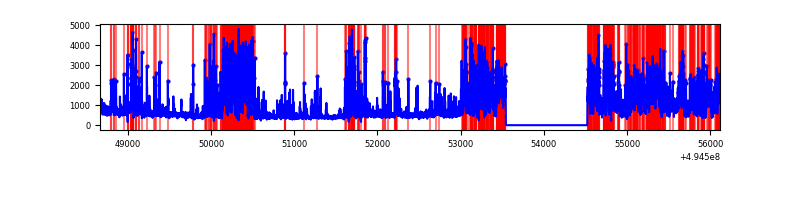 |
Top three noisy pixels from each quadrant. If the there are fewer than three noisy pixels in the level2.evt file, extra rows are filled as -1
| Pixel properties | Quadrant properties | ||||||
|---|---|---|---|---|---|---|---|
| Quadrant | DetID | PixID | Counts | Sigma | Mean | Median | Sigma |
| A | 3 | 63 | 11560081 | 149166.14 | 306 | 298 | 77.5 |
| A | 3 | 78 | 3162527 | 40805.05 | 306 | 298 | 77.5 |
| A | 15 | 174 | 88181 | 1134.03 | 306 | 298 | 77.5 |
| B | 4 | 216 | 82175 | 562.96 | 667 | 643 | 144.8 |
| B | 0 | 213 | 38223 | 259.48 | 667 | 643 | 144.8 |
| B | 5 | 185 | 30027 | 202.89 | 667 | 643 | 144.8 |
| C | 15 | 224 | 5175117 | 44274.26 | 419 | 415 | 116.9 |
| C | 1 | 241 | 4789093 | 40971.48 | 419 | 415 | 116.9 |
| C | 15 | 158 | 96160 | 819.19 | 419 | 415 | 116.9 |
| D | 1 | 241 | 2877776 | 16472.84 | 611 | 584 | 174.7 |
| D | 7 | 30 | 244212 | 1394.85 | 611 | 584 | 174.7 |
| D | 7 | 110 | 212885 | 1215.49 | 611 | 584 | 174.7 |
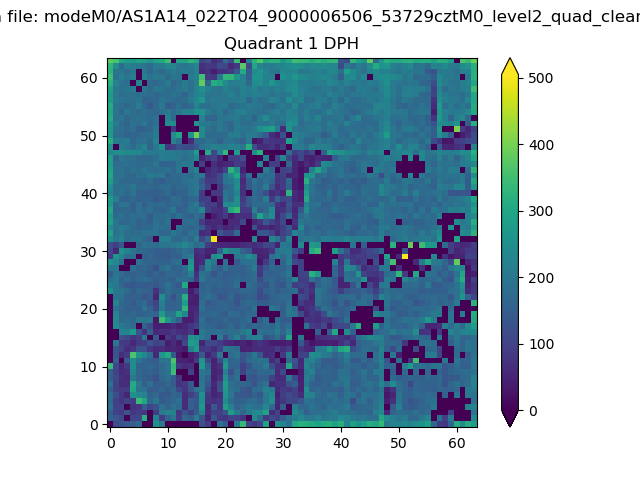
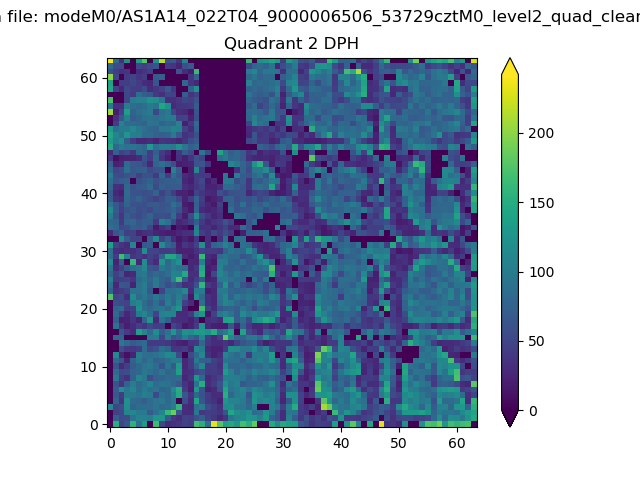
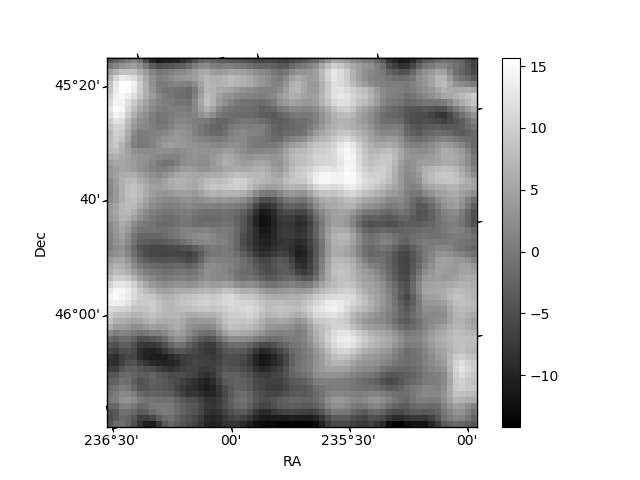
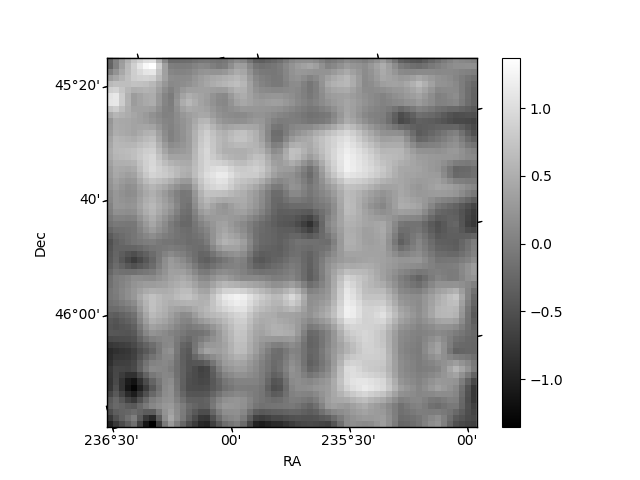
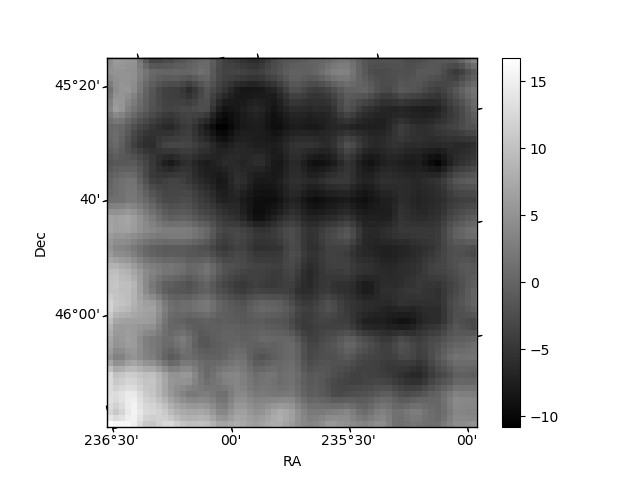
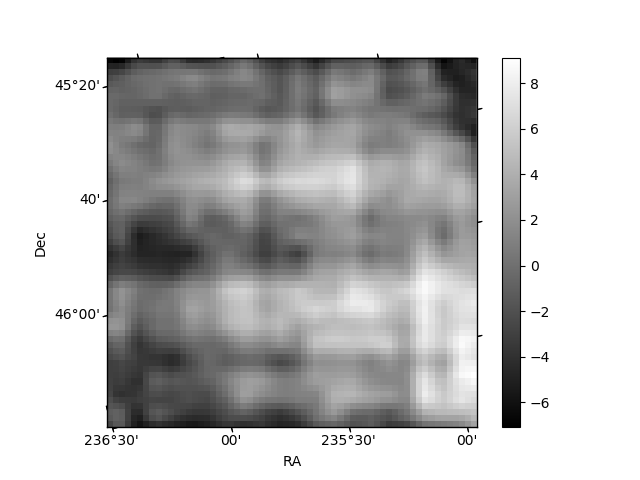
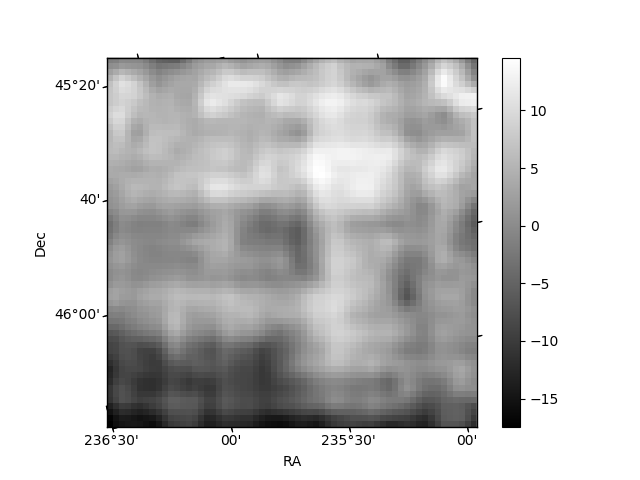
Histogram calculated using DETX and DETY for each event in the final _common_clean file
| Quadrant A | 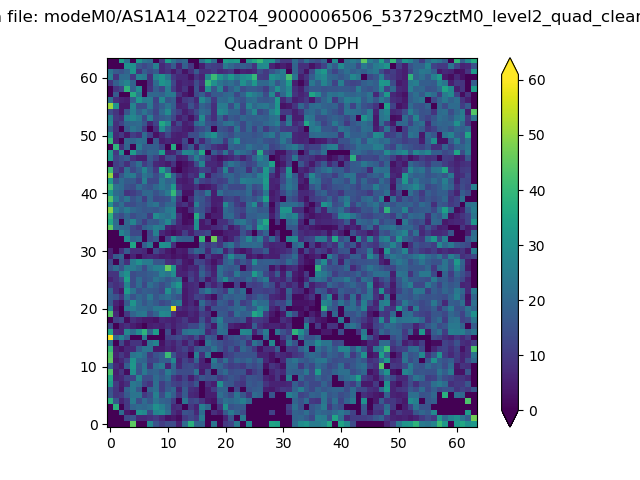 |
 |
Quadrant B |
|---|---|---|---|
| Quadrant D | 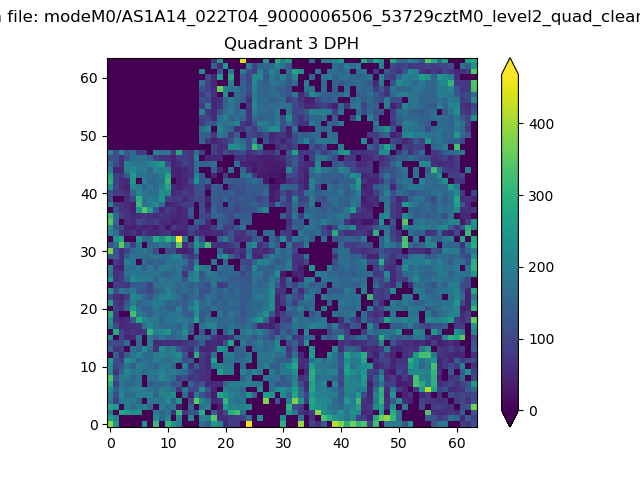 |
 |
Quadrant C |
| Plot type | Count rate plots | Images |
|---|---|---|
| Comparison with Poisson distribution Blue bars denote a histogram of data divided into 1 sec bins. Red curve is a Poisson curve with rate = median count rate of data. |
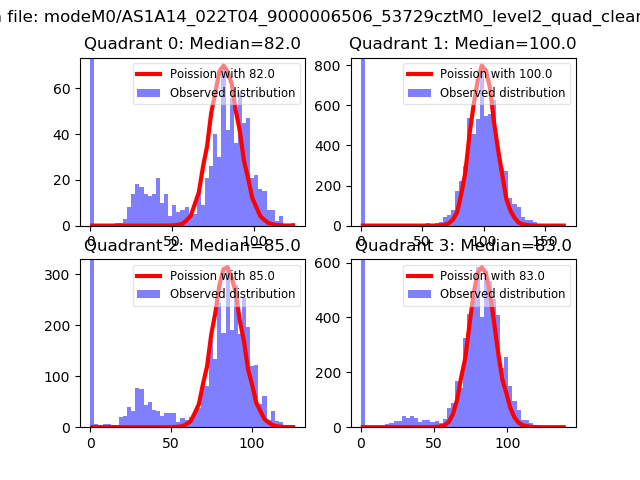 |
 |
| Quadrant-wise count rates Data is divided into 100 sec bins |
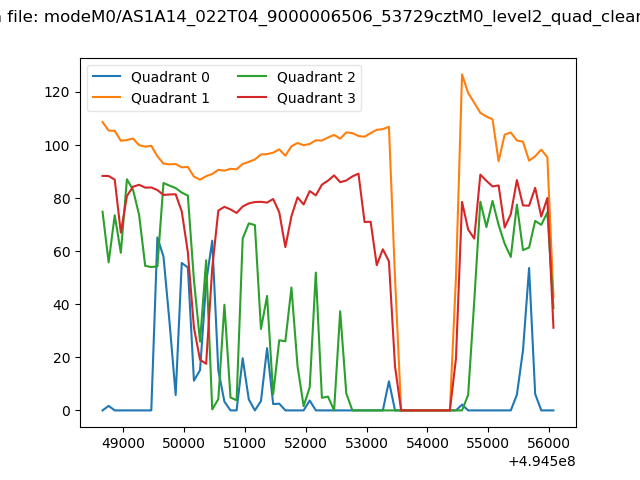 |
|
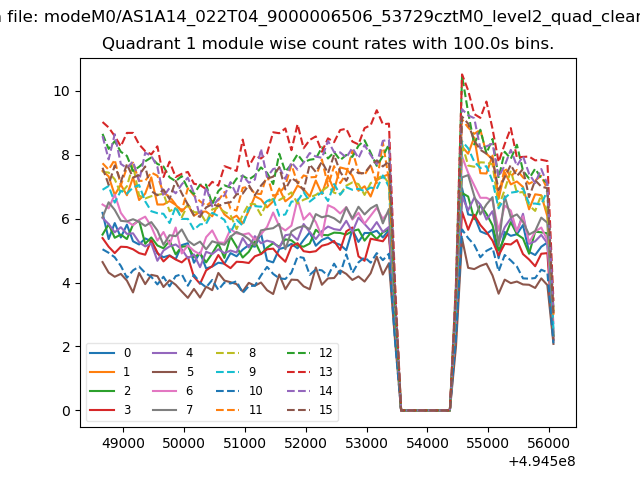
| Module-wise count rates for Quadrant A Data is divided into 100 sec bins |
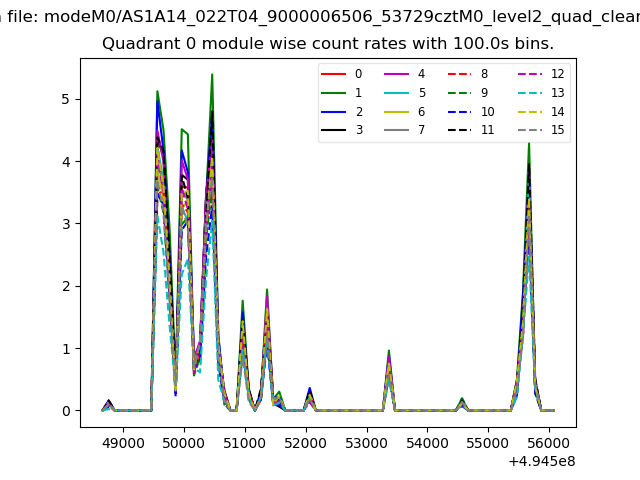 |
 |
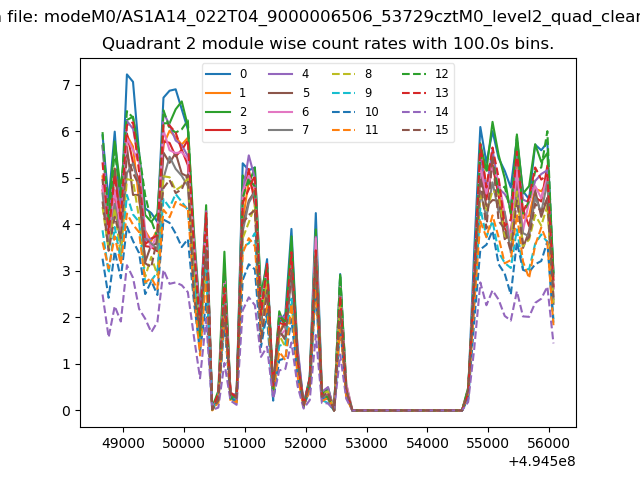
| Module-wise count rates for Quadrant B Data is divided into 100 sec bins |
 |
 |
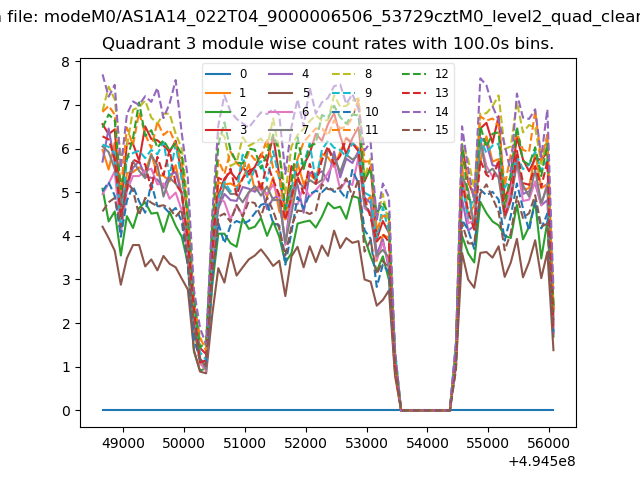
| Module-wise count rates for Quadrant C Data is divided into 100 sec bins |
 |
 |
| Module-wise count rates for Quadrant D Data is divided into 100 sec bins |
 |
 |
| Parameter | Plot |
|---|---|
| CZT HV Monitor | 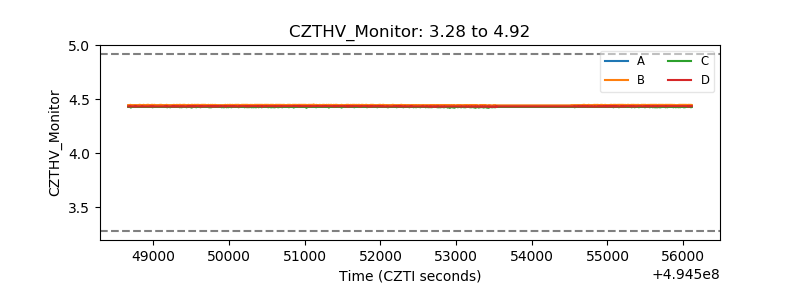 |
| D_VDD |  |
| Temperature 1 | 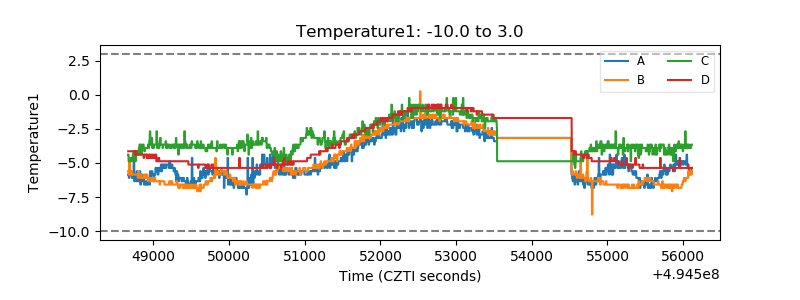 |
| Veto HV Monitor | 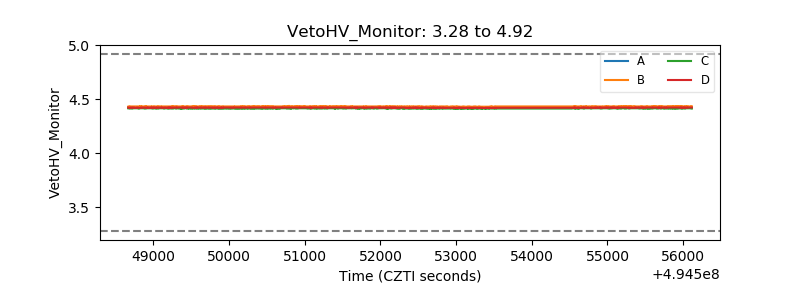 |
| Veto LLD | 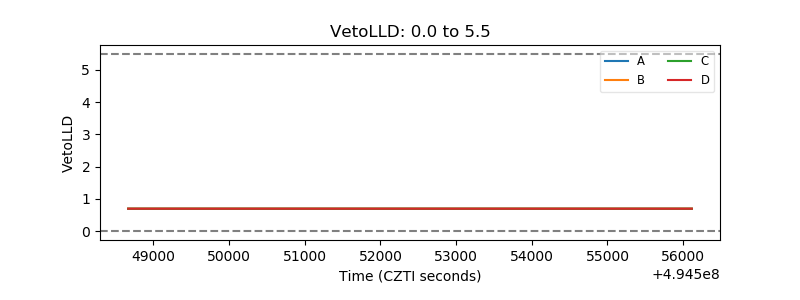 |
| Alpha Counter | 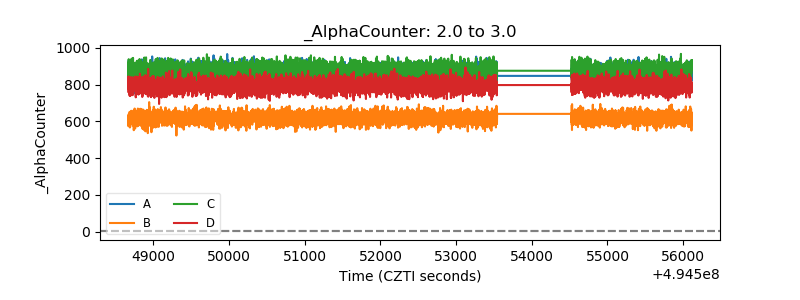 |
| _CPM_Rate | 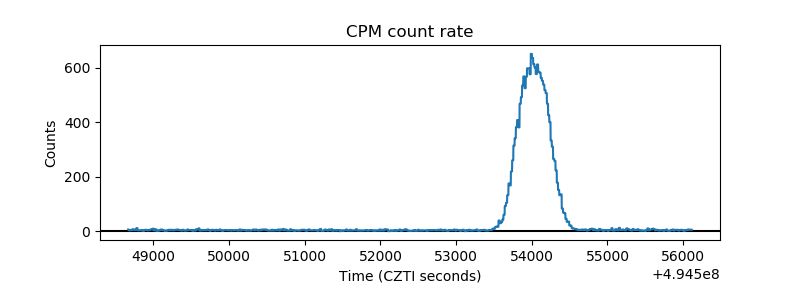 |
| CZT Counter | 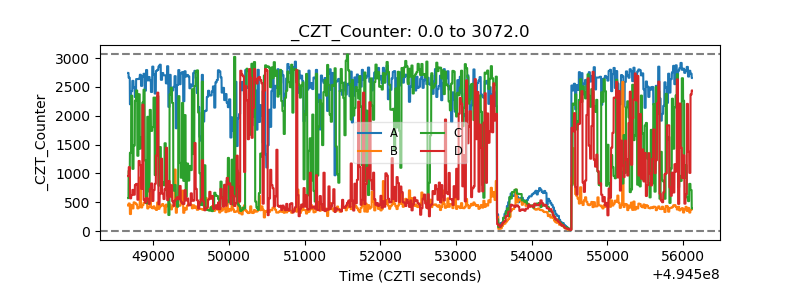 |
| +2.5 Volts monitor | 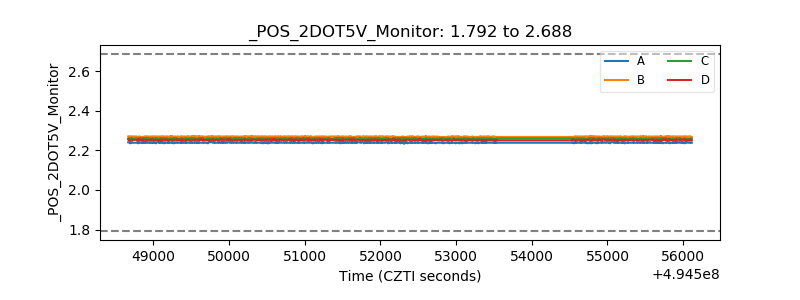 |
| +5 Volts monitor | 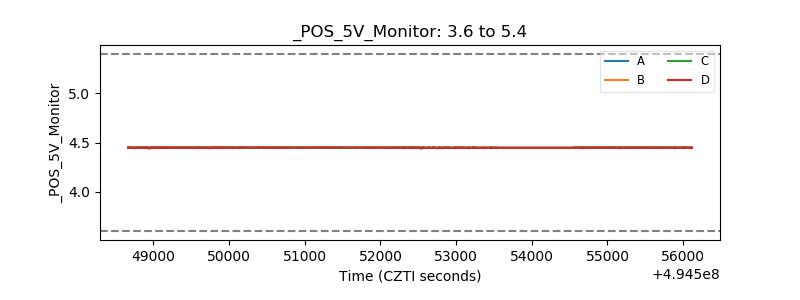 |
| _ROLL_ROT | 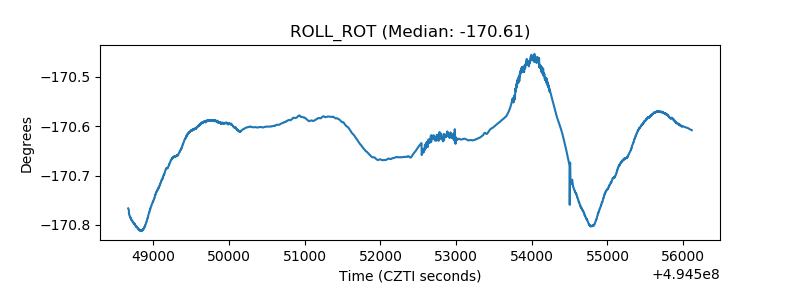 |
| _Roll_DEC | 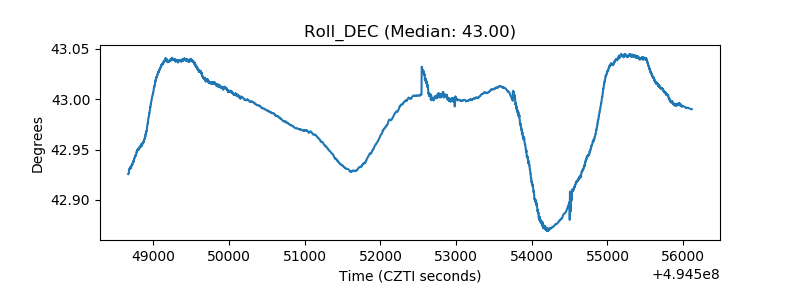 |
| _Roll_RA |  |
| Veto Counter | 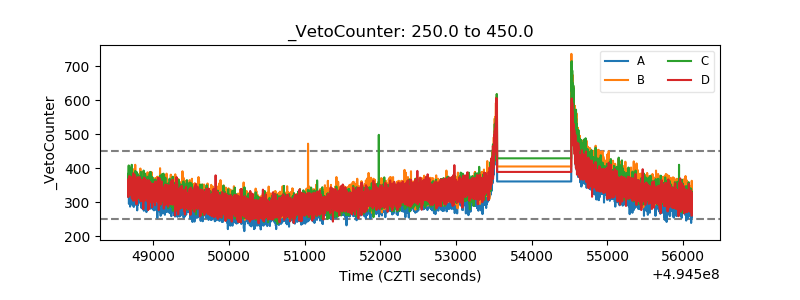 |