| Param | Original file | Final file |
|---|---|---|
| Filename | modeM0/AS1A14_022T04_9000006506_53730cztM0_level2.fits | modeM0/AS1A14_022T04_9000006506_53730cztM0_level2_quad_clean.evt |
| Size (bytes) | 1,015,899,840 | 67,040,640 |
| Size | 968.8 MB | 63.9 MB |
| Events in quadrant A | 16,654,856 | 30,087 |
| Events in quadrant B | 3,042,516 | 677,526 |
| Events in quadrant C | 11,238,114 | 336,514 |
| Events in quadrant D | 6,161,761 | 527,718 |
| Mode M0 | |||
|---|---|---|---|
| Quadrant | BADHDUFLAG | Total packets | Discarded packets |
| A | 0 | 54038 | 1 |
| B | 0 | 13900 | 1 |
| C | 0 | 37900 | 1 |
| D | 0 | 22982 | 2 |
| Mode SS | |||
|---|---|---|---|
| Quadrant | BADHDUFLAG | Total packets | Discarded packets |
| A | 0 | 132 | 0 |
| B | 0 | 132 | 0 |
| C | 0 | 132 | 0 |
| D | 0 | 132 | 0 |
| Mode M9 | |||
|---|---|---|---|
| Quadrant | BADHDUFLAG | Total packets | Discarded packets |
| A | 0 | 11 | 0 |
| B | 0 | 11 | 0 |
| C | 0 | 11 | 0 |
| D | 0 | 11 | 0 |
| Quadrant | Total seconds | Saturated seconds | Saturation percentage |
|---|---|---|---|
| A | 6570 | 6296 | 95.829528% |
| B | 6570 | 70 | 1.065449% |
| C | 6571 | 3205 | 48.774920% |
| D | 6570 | 666 | 10.136986% |
Noise dominated data is calculated using 1-second bins in cleaned event files. If a bin has >2000 counts, and if more than 50% of those come from <1% of pixels, then it is considered to be noise-dominated and hence unusable.
| Quadrant | # 1 sec bins | Bins with >0 counts | Bins with >2000 counts | High rate bins dominated by noise | Noise dominated (total time) | Noise dominated (detector-on time) | Marked lightcurve |
|---|---|---|---|---|---|---|---|
| A | 7665 | 6570 | 6092 | 6092 | 79.48% | 92.72% | 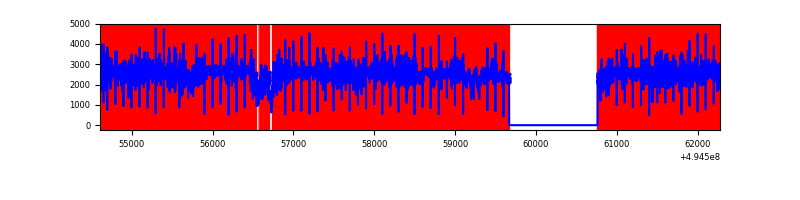 |
| B | 7665 | 6571 | 27 | 27 | 0.35% | 0.41% | 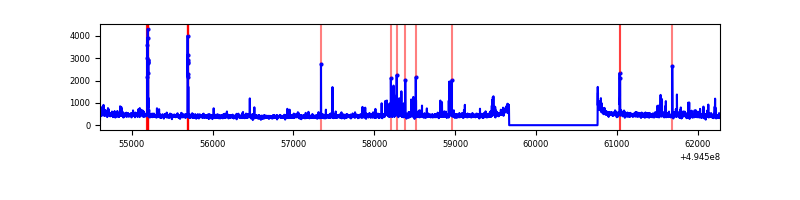 |
| C | 7666 | 6572 | 2663 | 2663 | 34.74% | 40.52% | 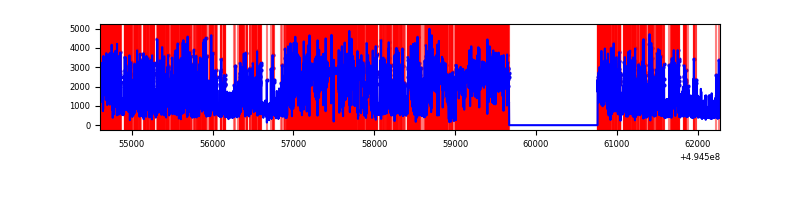 |
| D | 7665 | 6571 | 626 | 626 | 8.17% | 9.53% | 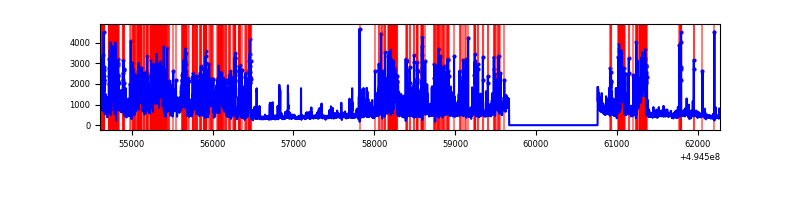 |
Top three noisy pixels from each quadrant. If the there are fewer than three noisy pixels in the level2.evt file, extra rows are filled as -1
| Pixel properties | Quadrant properties | ||||||
|---|---|---|---|---|---|---|---|
| Quadrant | DetID | PixID | Counts | Sigma | Mean | Median | Sigma |
| A | 3 | 63 | 14355256 | 207334.24 | 276 | 270 | 69.2 |
| A | 3 | 78 | 1106312 | 15974.96 | 276 | 270 | 69.2 |
| A | 3 | 94 | 52463 | 753.84 | 276 | 270 | 69.2 |
| B | 0 | 213 | 90682 | 598.38 | 692 | 670 | 150.4 |
| B | 4 | 216 | 62577 | 411.54 | 692 | 670 | 150.4 |
| B | 5 | 185 | 50430 | 330.79 | 692 | 670 | 150.4 |
| C | 15 | 224 | 5481504 | 39905.74 | 489 | 487 | 137.3 |
| C | 1 | 241 | 3231784 | 23526.17 | 489 | 487 | 137.3 |
| C | 15 | 158 | 86152 | 623.7 | 489 | 487 | 137.3 |
| D | 1 | 241 | 1829403 | 9840.9 | 648 | 618 | 185.8 |
| D | 7 | 30 | 306231 | 1644.54 | 648 | 618 | 185.8 |
| D | 6 | 239 | 282889 | 1518.93 | 648 | 618 | 185.8 |
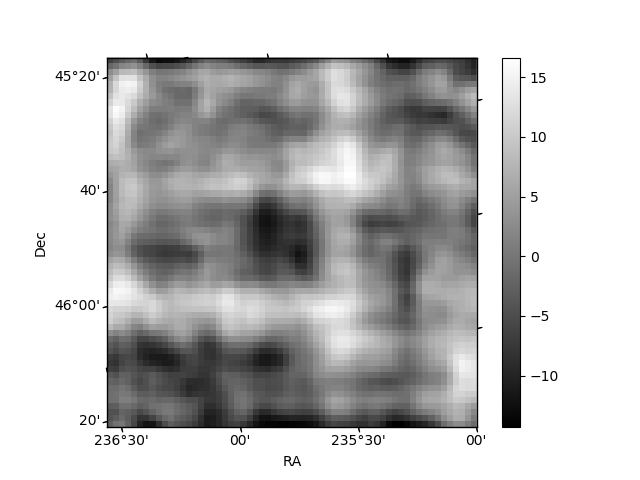
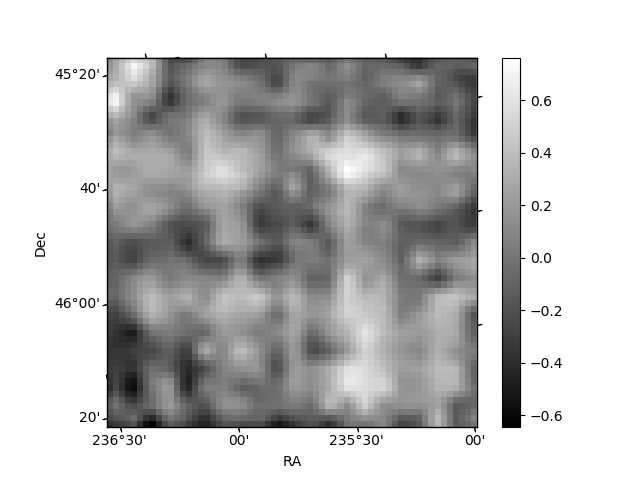
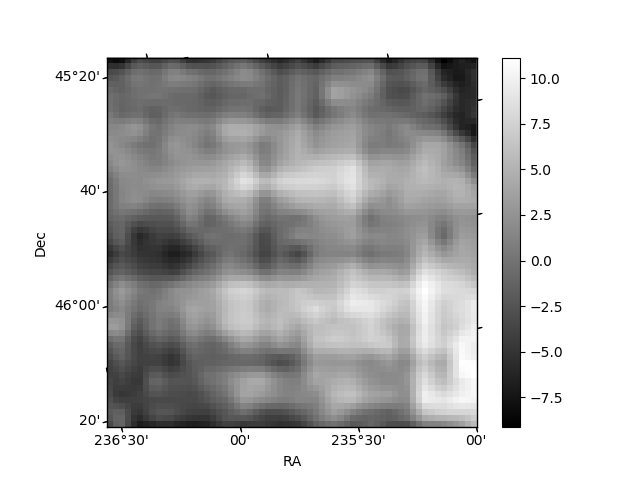
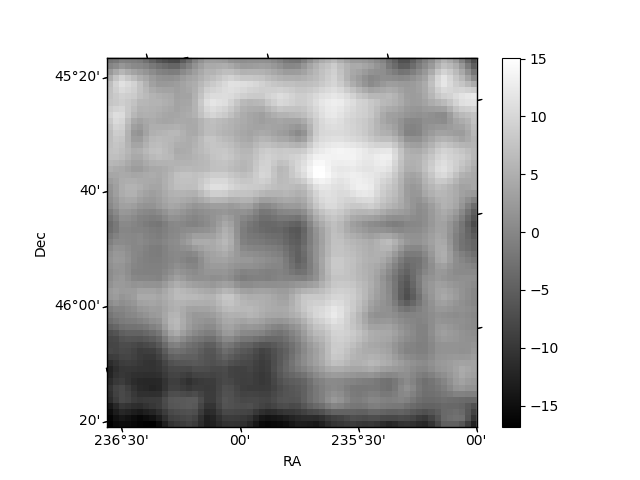
Histogram calculated using DETX and DETY for each event in the final _common_clean file
| Quadrant A | 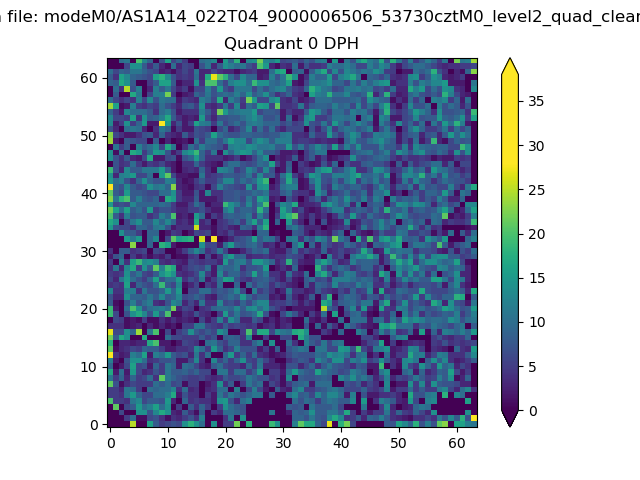 |
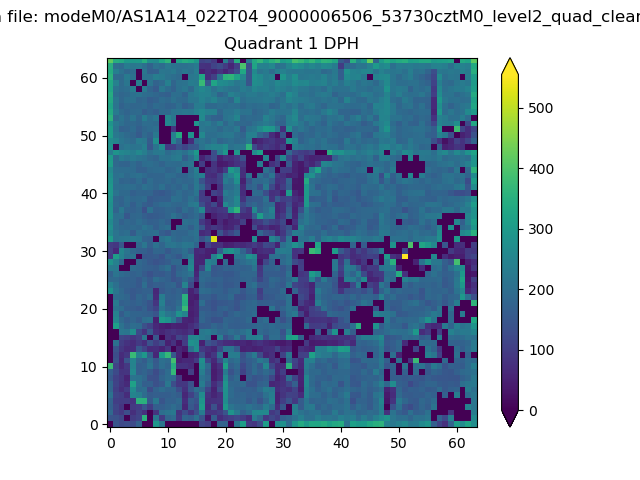 |
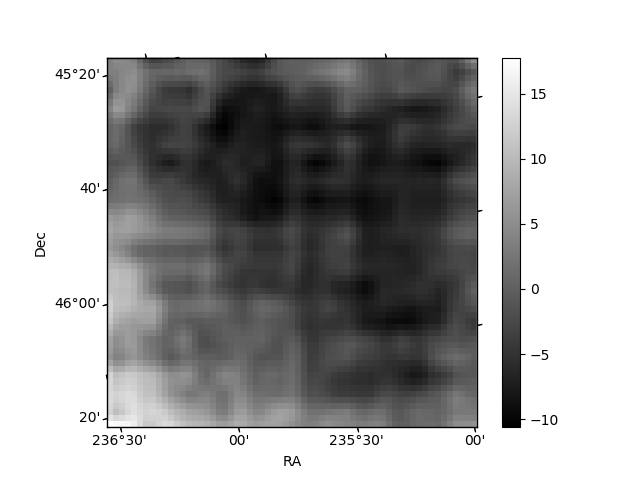
Quadrant B |
|---|---|---|---|
| Quadrant D | 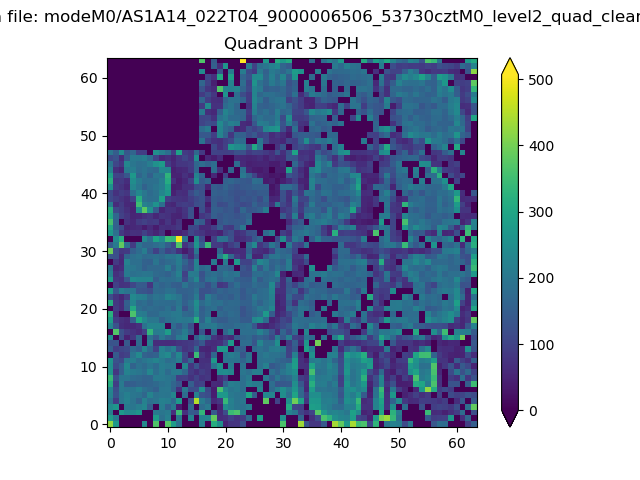 |
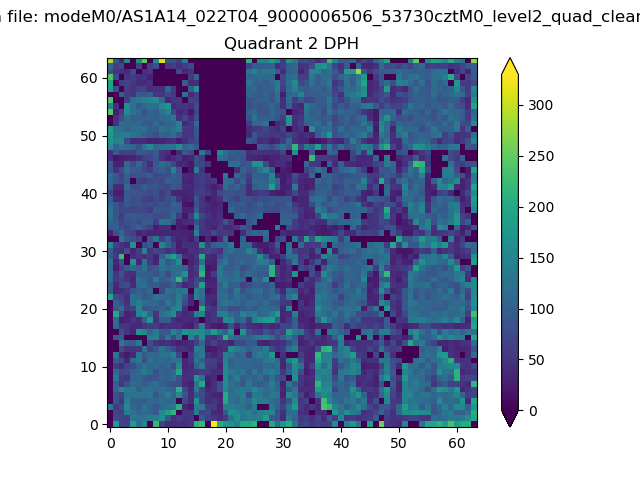 |
Quadrant C |
| Plot type | Count rate plots | Images |
|---|---|---|
| Comparison with Poisson distribution Blue bars denote a histogram of data divided into 1 sec bins. Red curve is a Poisson curve with rate = median count rate of data. |
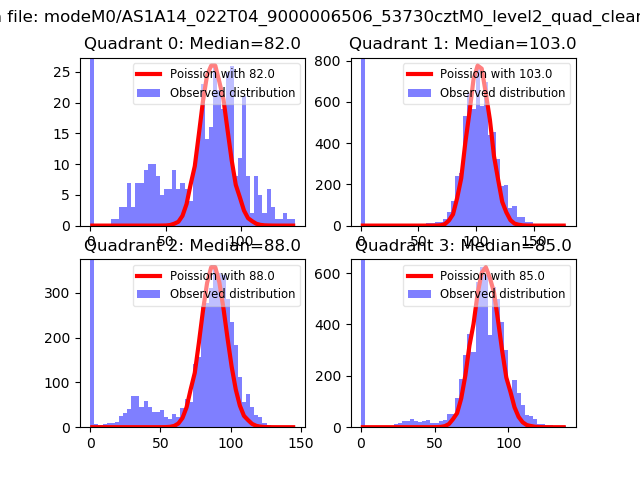 |
 |
| Quadrant-wise count rates Data is divided into 100 sec bins |
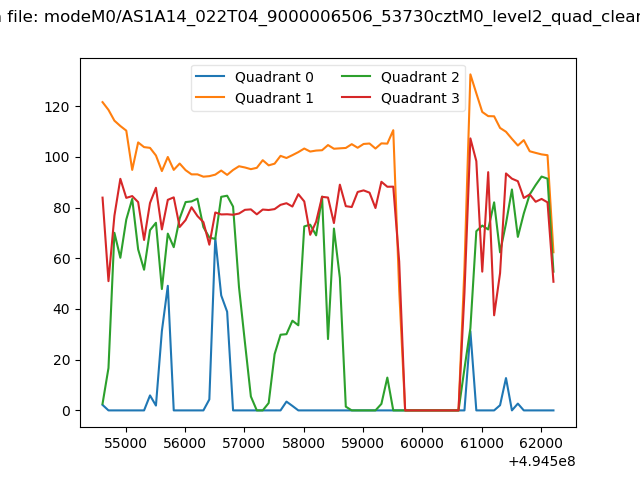 |
|
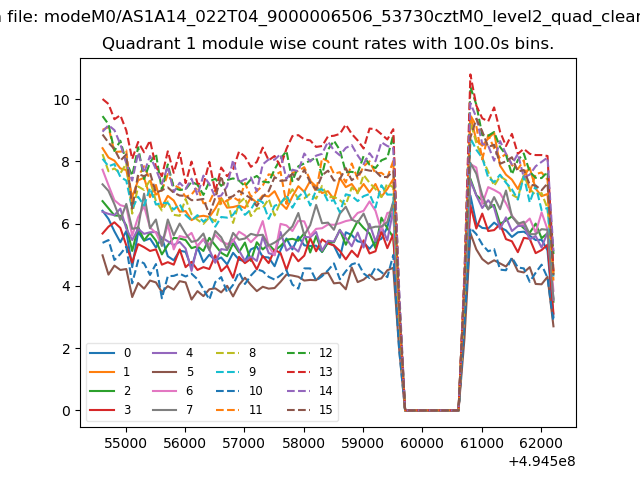
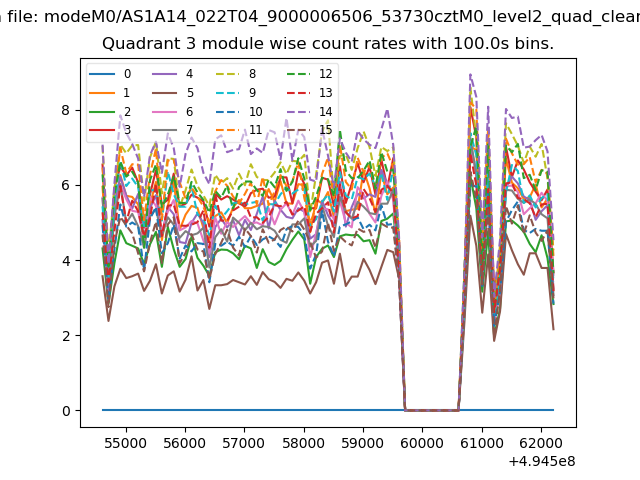
| Module-wise count rates for Quadrant A Data is divided into 100 sec bins |
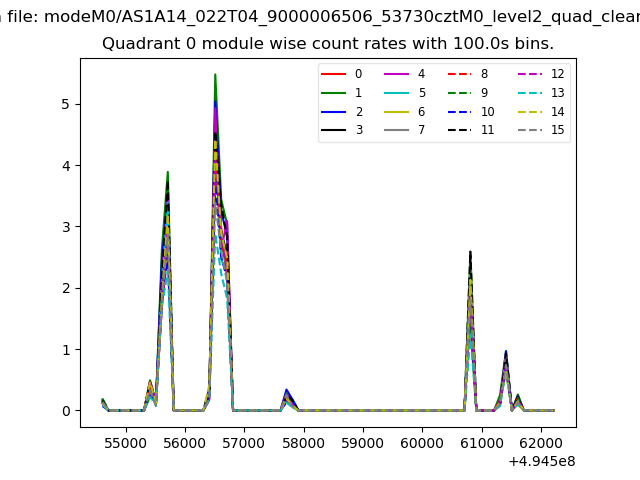 |
 |
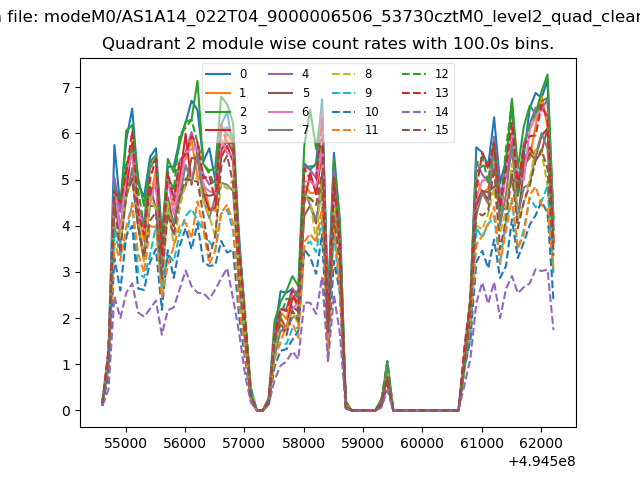
| Module-wise count rates for Quadrant B Data is divided into 100 sec bins |
 |
 |
| Module-wise count rates for Quadrant C Data is divided into 100 sec bins |
 |
 |
| Module-wise count rates for Quadrant D Data is divided into 100 sec bins |
 |
 |
| Parameter | Plot |
|---|---|
| CZT HV Monitor | 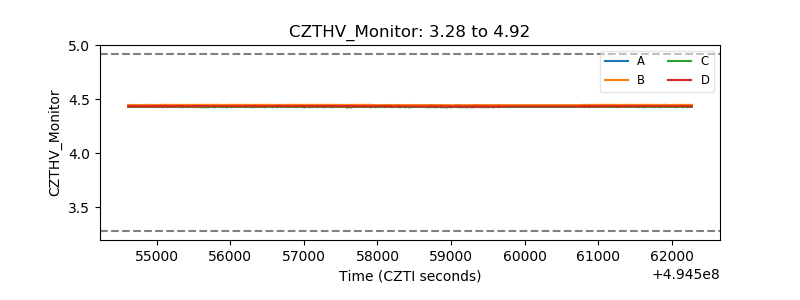 |
| D_VDD | 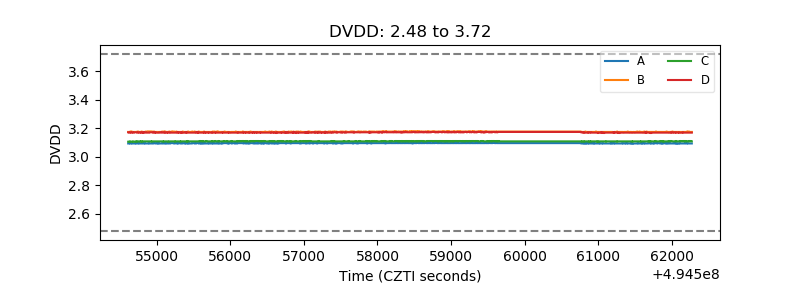 |
| Temperature 1 | 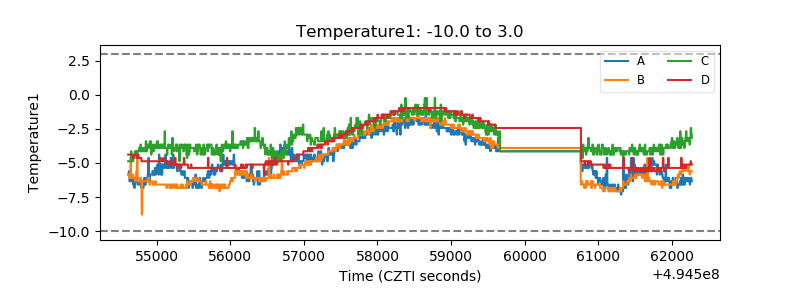 |
| Veto HV Monitor | 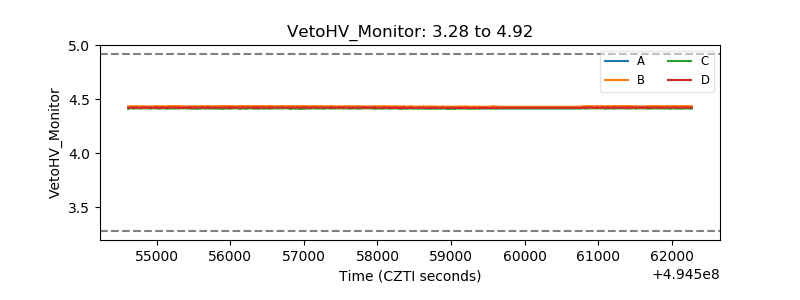 |
| Veto LLD | 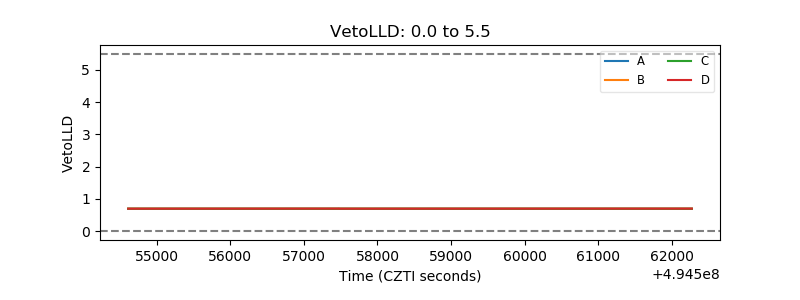 |
| Alpha Counter | 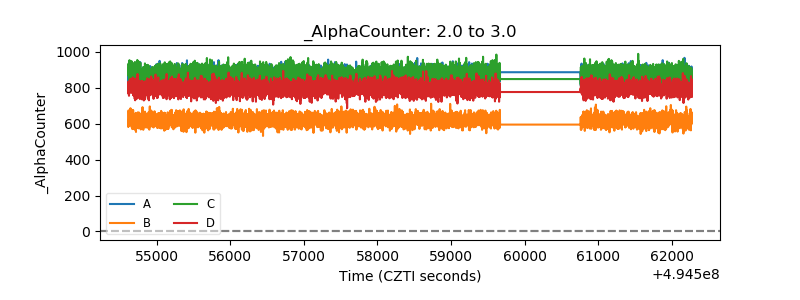 |
| _CPM_Rate | 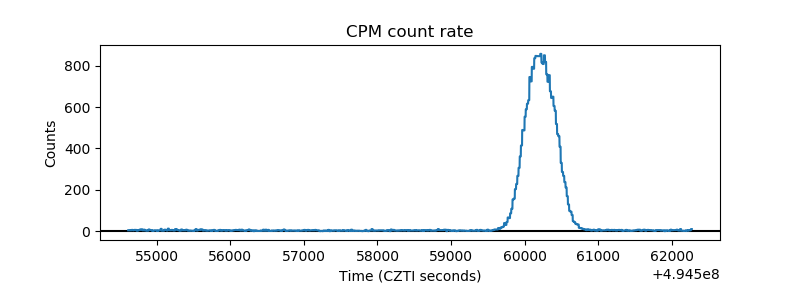 |
| CZT Counter | 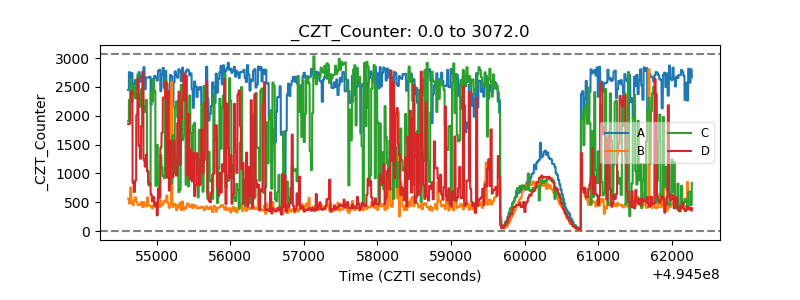 |
| +2.5 Volts monitor |  |
| +5 Volts monitor |  |
| _ROLL_ROT | 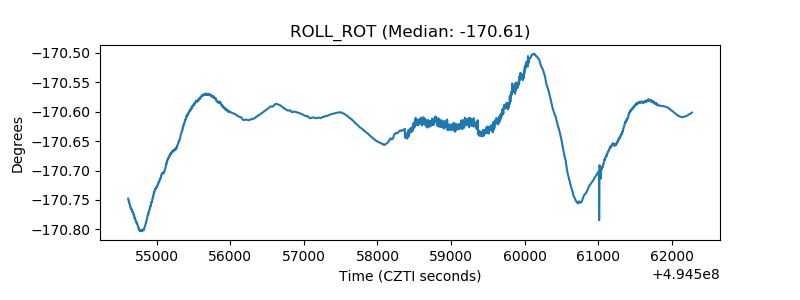 |
| _Roll_DEC | 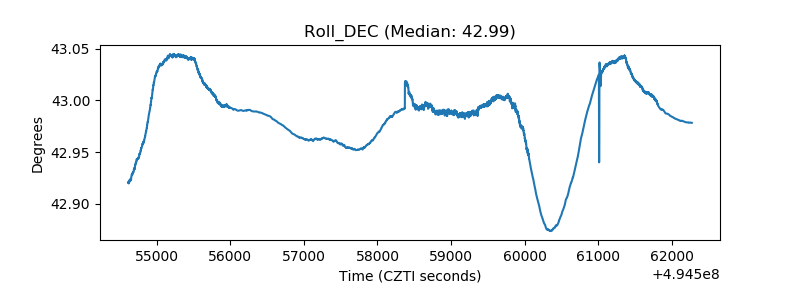 |
| _Roll_RA | 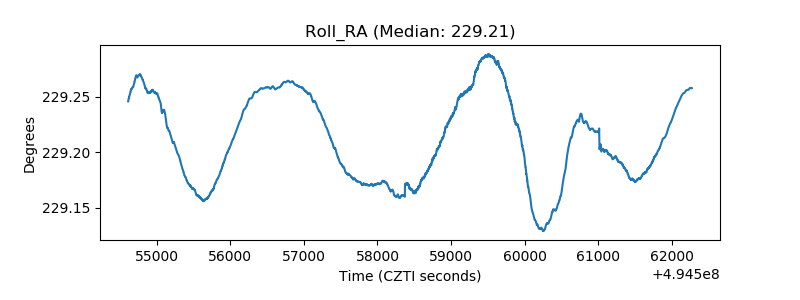 |
| Veto Counter | 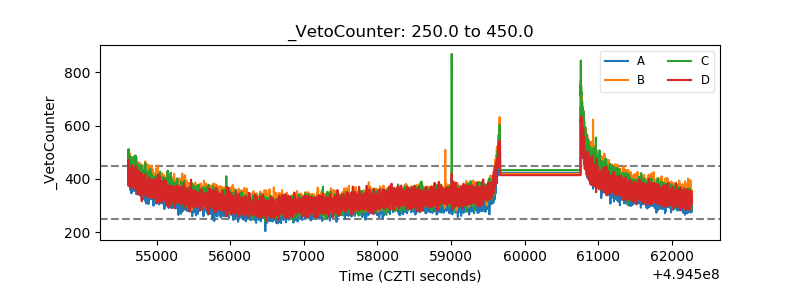 |