| Param | Original file | Final file |
|---|---|---|
| Filename | modeM0/AS1A14_022T04_9000006506_53731cztM0_level2.fits | modeM0/AS1A14_022T04_9000006506_53731cztM0_level2_quad_clean.evt |
| Size (bytes) | 973,679,040 | 71,553,600 |
| Size | 928.6 MB | 68.2 MB |
| Events in quadrant A | 16,481,480 | 62,104 |
| Events in quadrant B | 3,099,059 | 698,699 |
| Events in quadrant C | 10,353,855 | 407,407 |
| Events in quadrant D | 5,595,264 | 536,316 |
| Mode M0 | |||
|---|---|---|---|
| Quadrant | BADHDUFLAG | Total packets | Discarded packets |
| A | 0 | 53565 | 2 |
| B | 0 | 14056 | 2 |
| C | 0 | 35380 | 2 |
| D | 0 | 21246 | 2 |
| Mode SS | |||
|---|---|---|---|
| Quadrant | BADHDUFLAG | Total packets | Discarded packets |
| A | 0 | 134 | 0 |
| B | 0 | 134 | 0 |
| C | 0 | 134 | 0 |
| D | 0 | 134 | 0 |
| Mode M9 | |||
|---|---|---|---|
| Quadrant | BADHDUFLAG | Total packets | Discarded packets |
| A | 0 | 15 | 0 |
| B | 0 | 15 | 0 |
| C | 0 | 16 | 0 |
| D | 0 | 16 | 0 |
| Quadrant | Total seconds | Saturated seconds | Saturation percentage |
|---|---|---|---|
| A | 6625 | 6124 | 92.437736% |
| B | 6625 | 140 | 2.113208% |
| C | 6625 | 2604 | 39.305660% |
| D | 6625 | 713 | 10.762264% |
Noise dominated data is calculated using 1-second bins in cleaned event files. If a bin has >2000 counts, and if more than 50% of those come from <1% of pixels, then it is considered to be noise-dominated and hence unusable.
| Quadrant | # 1 sec bins | Bins with >0 counts | Bins with >2000 counts | High rate bins dominated by noise | Noise dominated (total time) | Noise dominated (detector-on time) | Marked lightcurve |
|---|---|---|---|---|---|---|---|
| A | 7735 | 6625 | 5909 | 5909 | 76.39% | 89.19% | 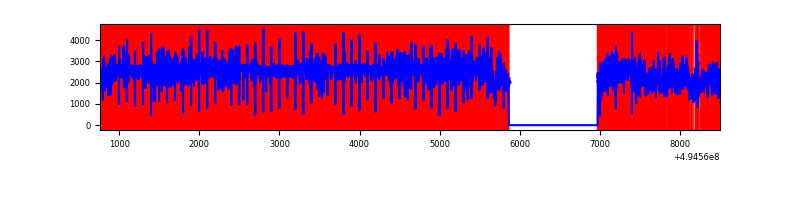 |
| B | 7735 | 6626 | 16 | 16 | 0.21% | 0.24% | 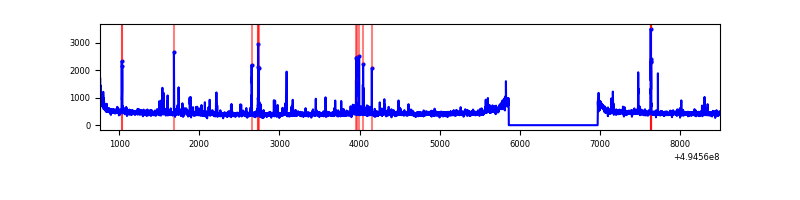 |
| C | 7735 | 6626 | 2158 | 2158 | 27.90% | 32.57% | 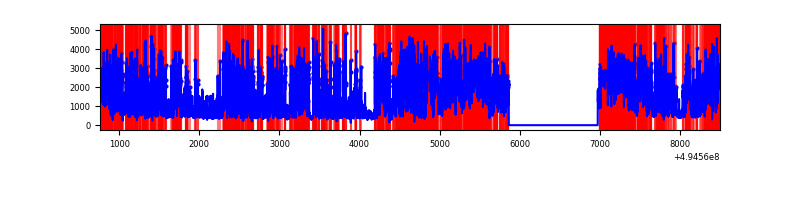 |
| D | 7735 | 6626 | 554 | 554 | 7.16% | 8.36% | 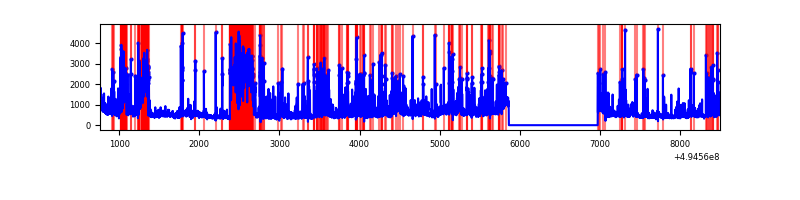 |
Top three noisy pixels from each quadrant. If the there are fewer than three noisy pixels in the level2.evt file, extra rows are filled as -1
| Pixel properties | Quadrant properties | ||||||
|---|---|---|---|---|---|---|---|
| Quadrant | DetID | PixID | Counts | Sigma | Mean | Median | Sigma |
| A | 3 | 63 | 14043392 | 167970.42 | 337 | 328 | 83.6 |
| A | 3 | 78 | 847157 | 10129.0 | 337 | 328 | 83.6 |
| A | 8 | 245 | 95290 | 1135.85 | 337 | 328 | 83.6 |
| B | 0 | 213 | 119438 | 769.93 | 719 | 696 | 154.2 |
| B | 4 | 171 | 27361 | 172.9 | 719 | 696 | 154.2 |
| B | 7 | 0 | 22011 | 138.21 | 719 | 696 | 154.2 |
| C | 15 | 224 | 5437683 | 34672.69 | 566 | 564 | 156.8 |
| C | 1 | 241 | 2199629 | 14023.51 | 566 | 564 | 156.8 |
| C | 12 | 2 | 89111 | 564.67 | 566 | 564 | 156.8 |
| D | 1 | 241 | 994595 | 5197.16 | 665 | 635 | 191.3 |
| D | 6 | 239 | 435915 | 2275.96 | 665 | 635 | 191.3 |
| D | 7 | 30 | 308614 | 1610.34 | 665 | 635 | 191.3 |
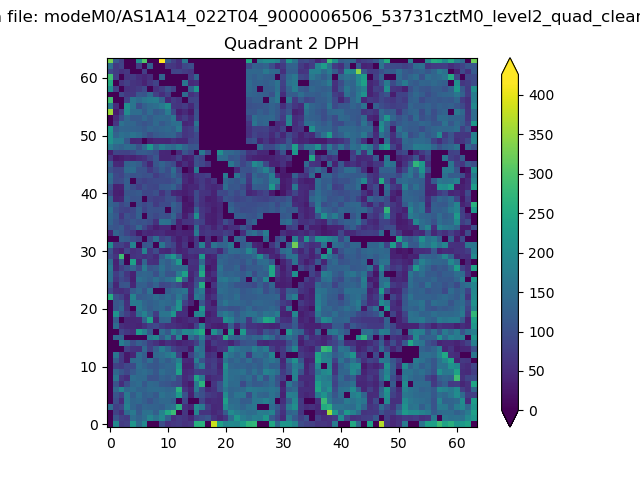
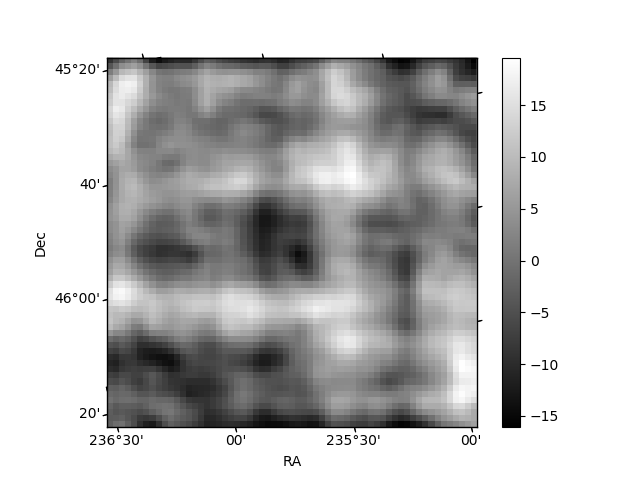
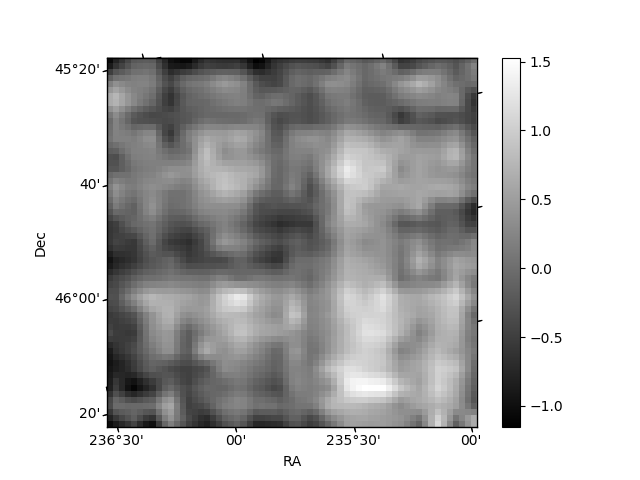
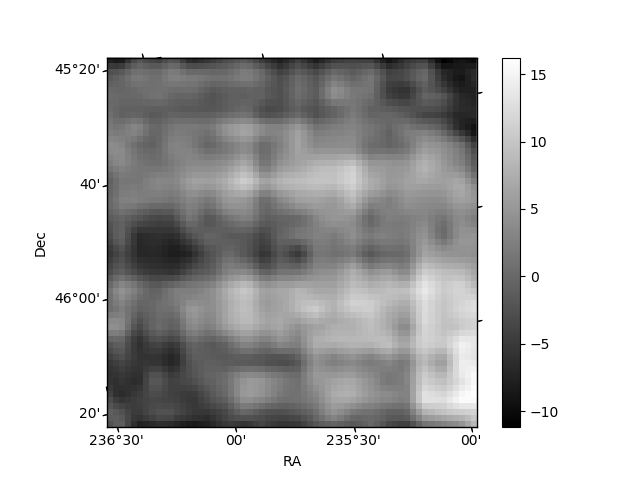
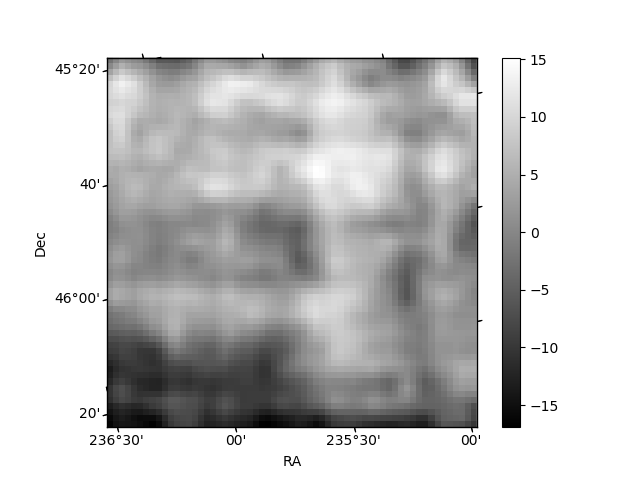
Histogram calculated using DETX and DETY for each event in the final _common_clean file
| Quadrant A | 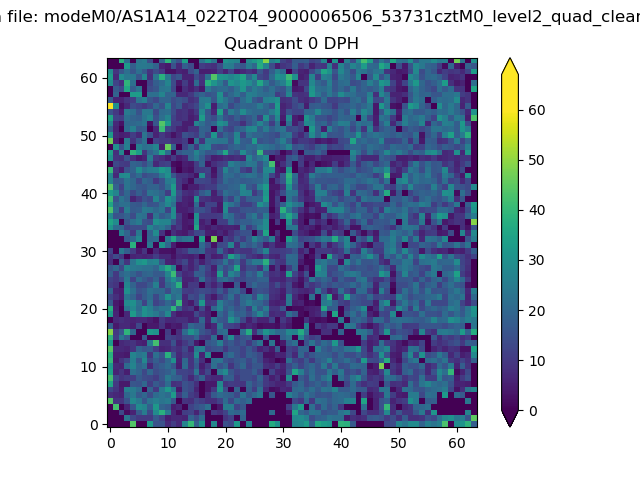 |
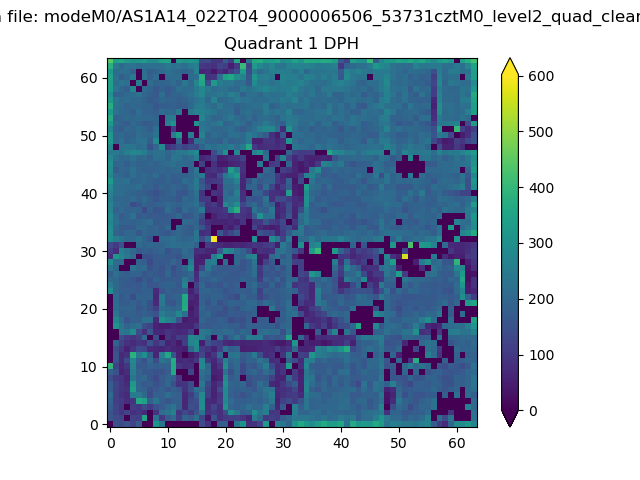 |
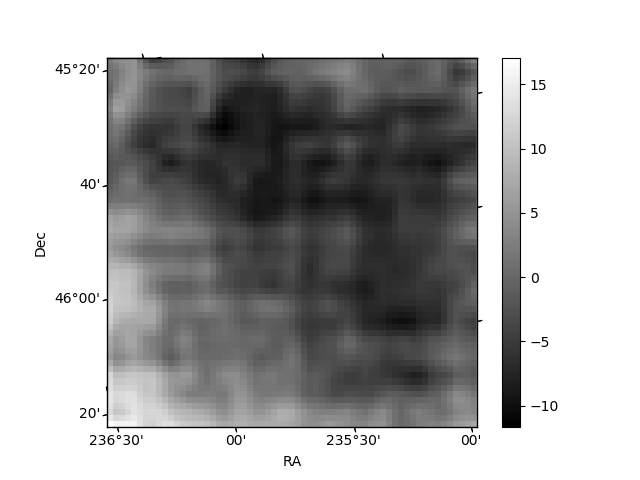
Quadrant B |
|---|---|---|---|
| Quadrant D | 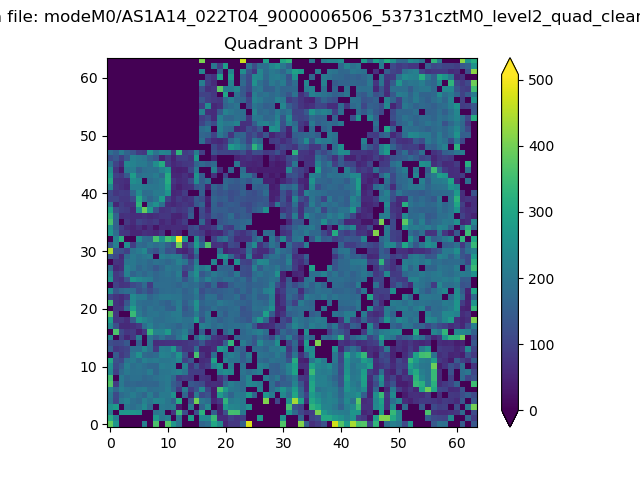 |
 |
Quadrant C |
| Plot type | Count rate plots | Images |
|---|---|---|
| Comparison with Poisson distribution Blue bars denote a histogram of data divided into 1 sec bins. Red curve is a Poisson curve with rate = median count rate of data. |
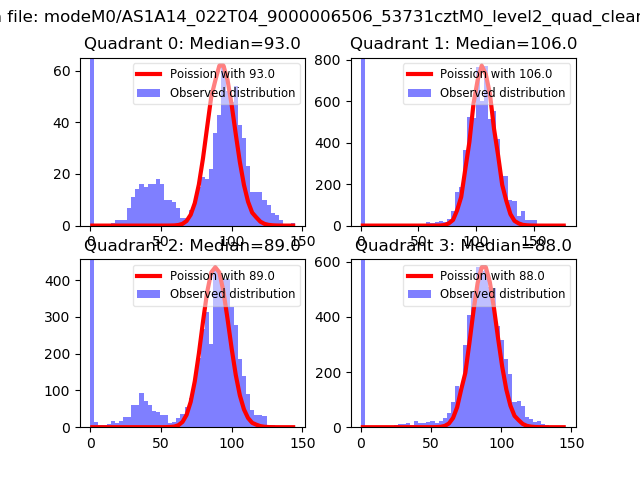 |
 |
| Quadrant-wise count rates Data is divided into 100 sec bins |
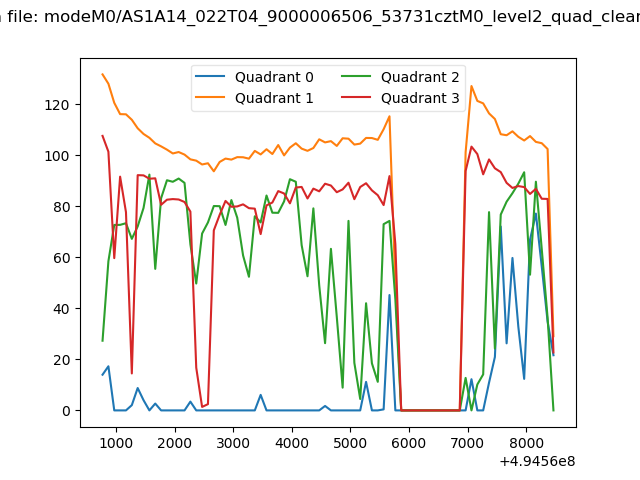 |
|
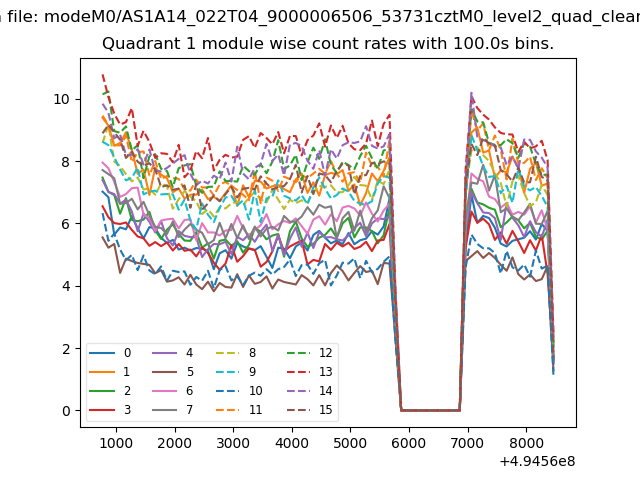
| Module-wise count rates for Quadrant A Data is divided into 100 sec bins |
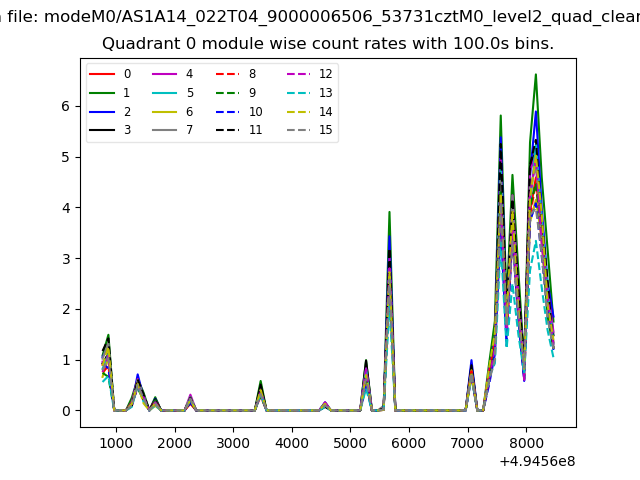 |
 |
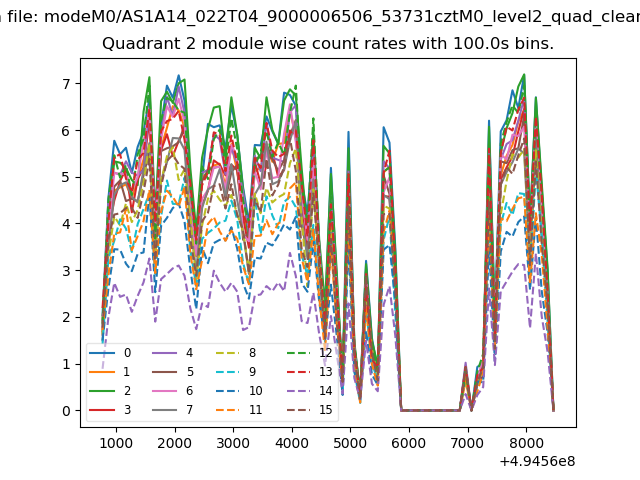
| Module-wise count rates for Quadrant B Data is divided into 100 sec bins |
 |
 |
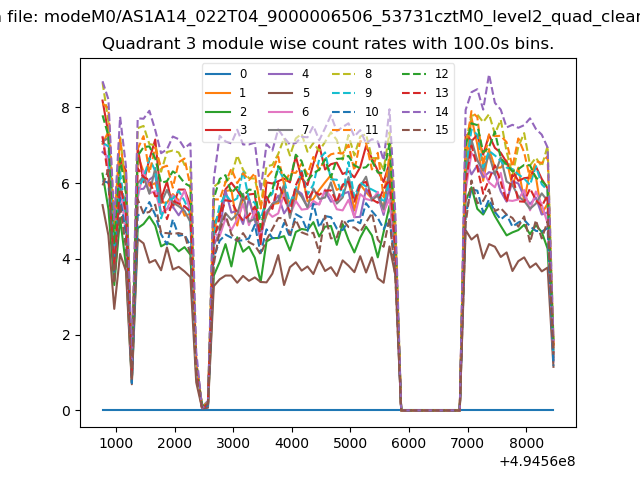
| Module-wise count rates for Quadrant C Data is divided into 100 sec bins |
 |
 |
| Module-wise count rates for Quadrant D Data is divided into 100 sec bins |
 |
 |
| Parameter | Plot |
|---|---|
| CZT HV Monitor | 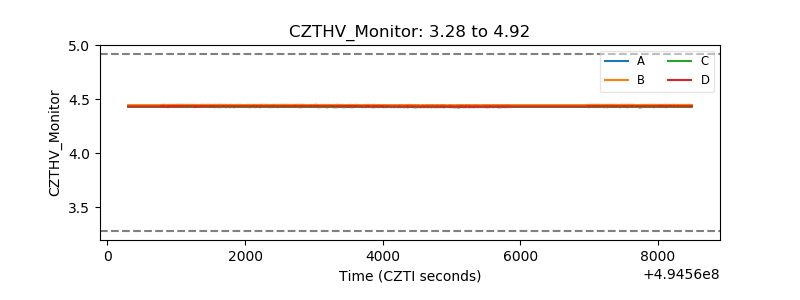 |
| D_VDD | 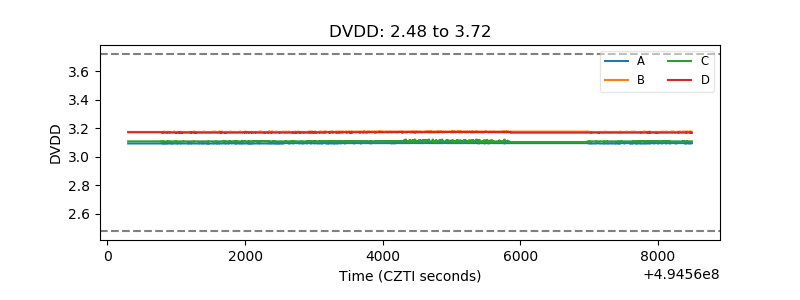 |
| Temperature 1 | 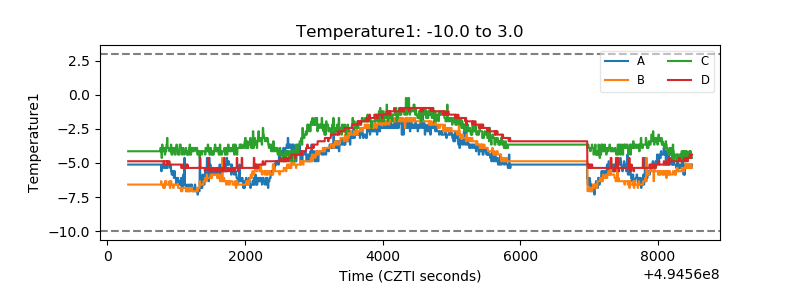 |
| Veto HV Monitor | 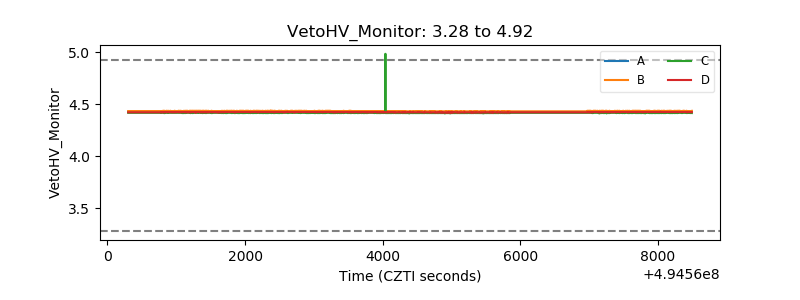 |
| Veto LLD | 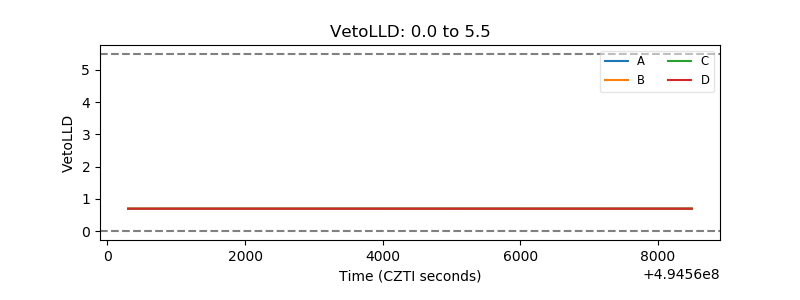 |
| Alpha Counter | 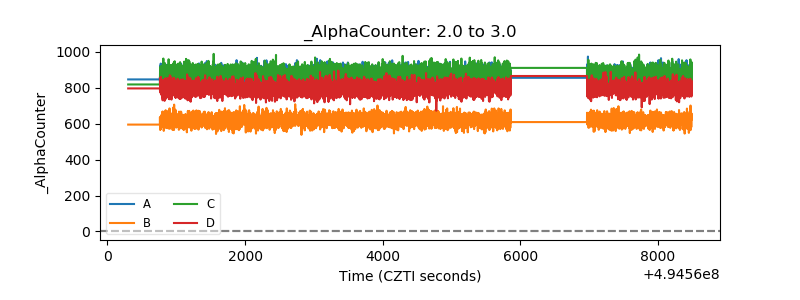 |
| _CPM_Rate | 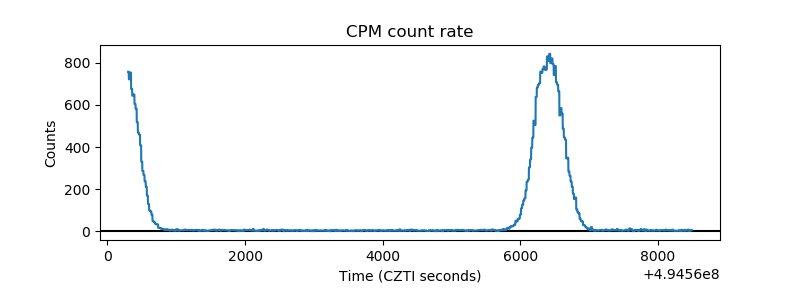 |
| CZT Counter | 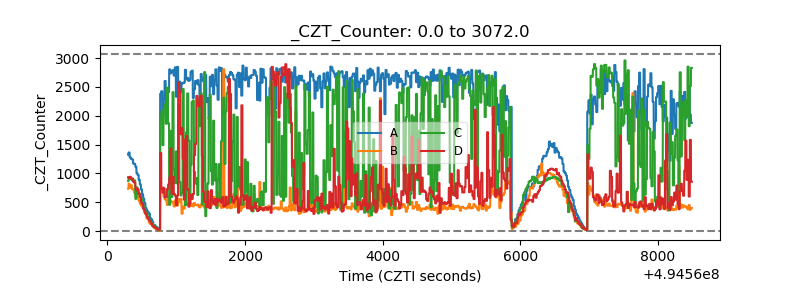 |
| +2.5 Volts monitor |  |
| +5 Volts monitor | 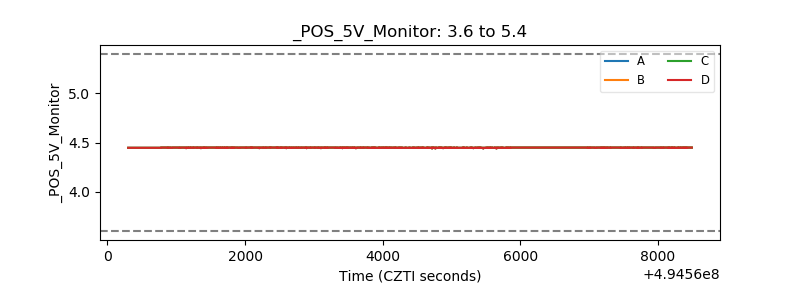 |
| _ROLL_ROT | 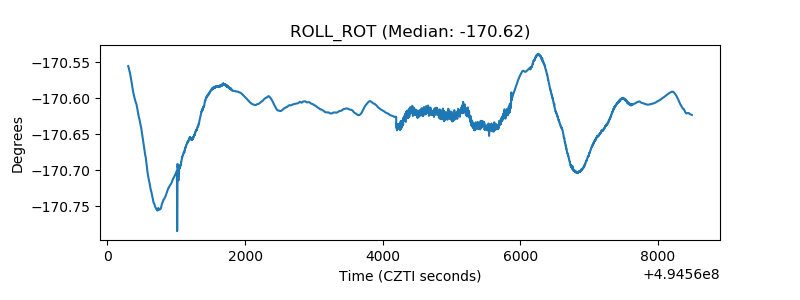 |
| _Roll_DEC | 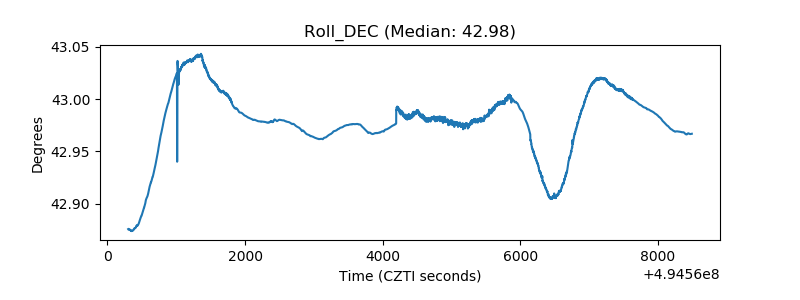 |
| _Roll_RA | 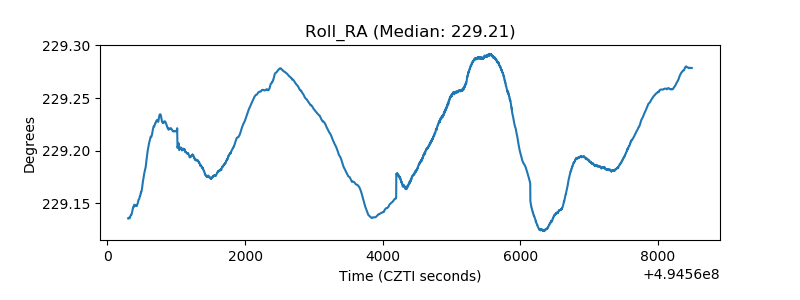 |
| Veto Counter | 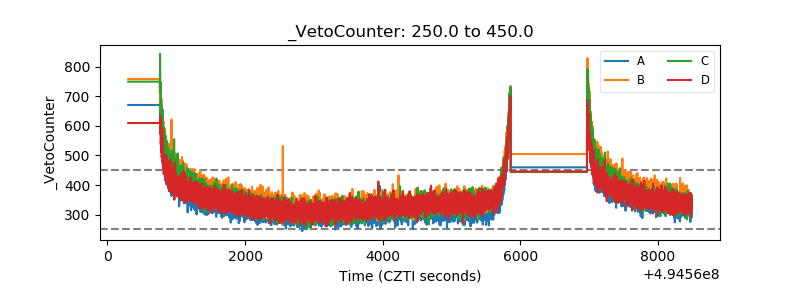 |