| Param | Original file | Final file |
|---|---|---|
| Filename | modeM0/AS1A14_022T04_9000006506_53732cztM0_level2.fits | modeM0/AS1A14_022T04_9000006506_53732cztM0_level2_quad_clean.evt |
| Size (bytes) | 1,061,988,480 | 66,049,920 |
| Size | 1012.8 MB | 63.0 MB |
| Events in quadrant A | 15,714,486 | 92,587 |
| Events in quadrant B | 3,033,849 | 689,170 |
| Events in quadrant C | 11,499,216 | 347,690 |
| Events in quadrant D | 8,557,103 | 412,657 |
| Mode M0 | |||
|---|---|---|---|
| Quadrant | BADHDUFLAG | Total packets | Discarded packets |
| A | 0 | 51187 | 2 |
| B | 0 | 13809 | 2 |
| C | 0 | 38700 | 2 |
| D | 0 | 29935 | 2 |
| Mode SS | |||
|---|---|---|---|
| Quadrant | BADHDUFLAG | Total packets | Discarded packets |
| A | 0 | 134 | 0 |
| B | 0 | 134 | 0 |
| C | 0 | 134 | 0 |
| D | 0 | 134 | 0 |
| Mode M9 | |||
|---|---|---|---|
| Quadrant | BADHDUFLAG | Total packets | Discarded packets |
| A | 0 | 16 | 0 |
| B | 0 | 17 | 0 |
| C | 0 | 17 | 0 |
| D | 0 | 17 | 0 |
| Quadrant | Total seconds | Saturated seconds | Saturation percentage |
|---|---|---|---|
| A | 6558 | 5809 | 88.578835% |
| B | 6558 | 172 | 2.622751% |
| C | 6558 | 3220 | 49.100335% |
| D | 6558 | 2105 | 32.098201% |
Noise dominated data is calculated using 1-second bins in cleaned event files. If a bin has >2000 counts, and if more than 50% of those come from <1% of pixels, then it is considered to be noise-dominated and hence unusable.
| Quadrant | # 1 sec bins | Bins with >0 counts | Bins with >2000 counts | High rate bins dominated by noise | Noise dominated (total time) | Noise dominated (detector-on time) | Marked lightcurve |
|---|---|---|---|---|---|---|---|
| A | 7638 | 6558 | 5538 | 5538 | 72.51% | 84.45% | 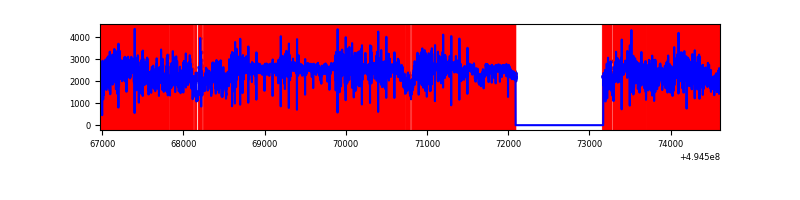 |
| B | 7638 | 6559 | 6 | 6 | 0.08% | 0.09% | 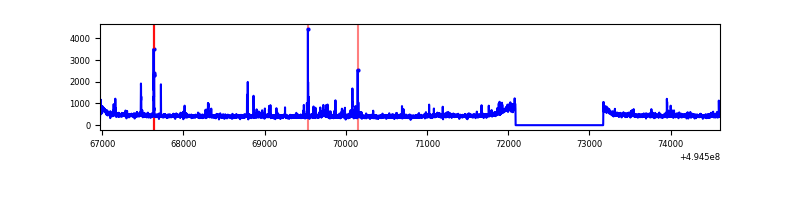 |
| C | 7638 | 6559 | 2639 | 2639 | 34.55% | 40.23% | 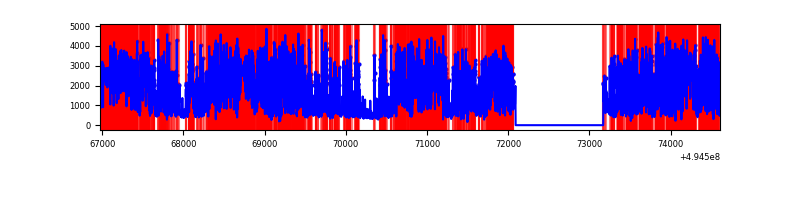 |
| D | 7638 | 6559 | 1783 | 1783 | 23.34% | 27.18% | 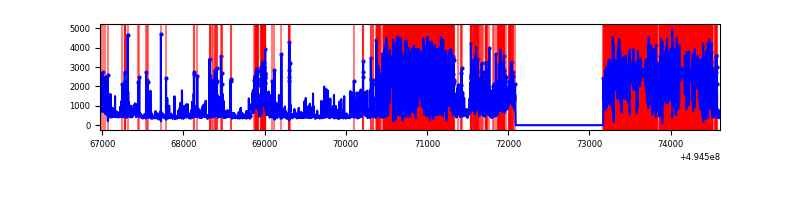 |
Top three noisy pixels from each quadrant. If the there are fewer than three noisy pixels in the level2.evt file, extra rows are filled as -1
| Pixel properties | Quadrant properties | ||||||
|---|---|---|---|---|---|---|---|
| Quadrant | DetID | PixID | Counts | Sigma | Mean | Median | Sigma |
| A | 3 | 63 | 13354470 | 151218.96 | 351 | 342 | 88.3 |
| A | 3 | 78 | 400199 | 4527.89 | 351 | 342 | 88.3 |
| A | 8 | 246 | 386993 | 4378.34 | 351 | 342 | 88.3 |
| B | 4 | 171 | 46002 | 292.25 | 719 | 695 | 155.0 |
| B | 0 | 213 | 43312 | 274.9 | 719 | 695 | 155.0 |
| B | 7 | 0 | 29278 | 184.37 | 719 | 695 | 155.0 |
| C | 15 | 224 | 5608979 | 39264.03 | 523 | 520 | 142.8 |
| C | 1 | 241 | 3276510 | 22934.74 | 523 | 520 | 142.8 |
| C | 3 | 242 | 191108 | 1334.28 | 523 | 520 | 142.8 |
| D | 1 | 241 | 3820504 | 23246.92 | 576 | 552 | 164.3 |
| D | 2 | 172 | 725444 | 4411.44 | 576 | 552 | 164.3 |
| D | 6 | 239 | 683699 | 4157.4 | 576 | 552 | 164.3 |
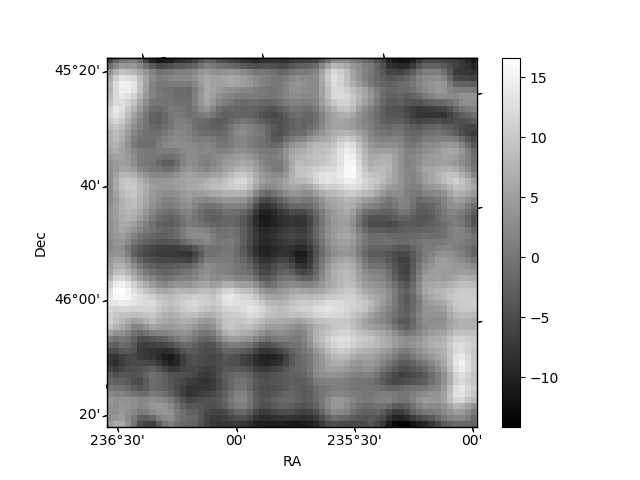
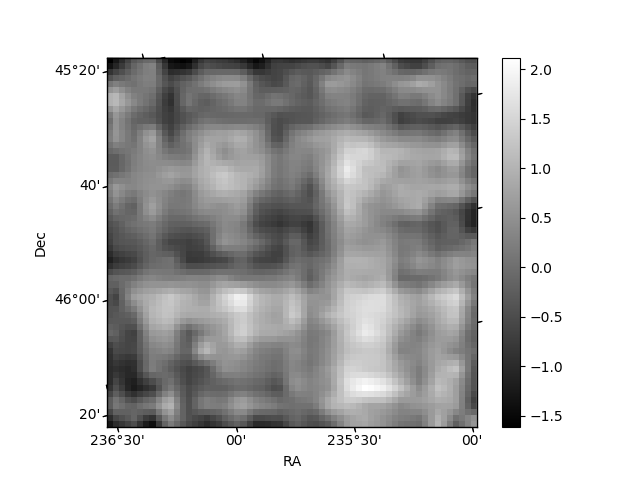
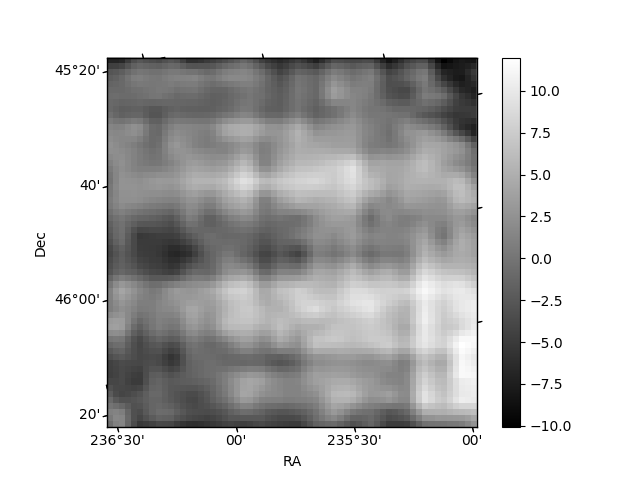
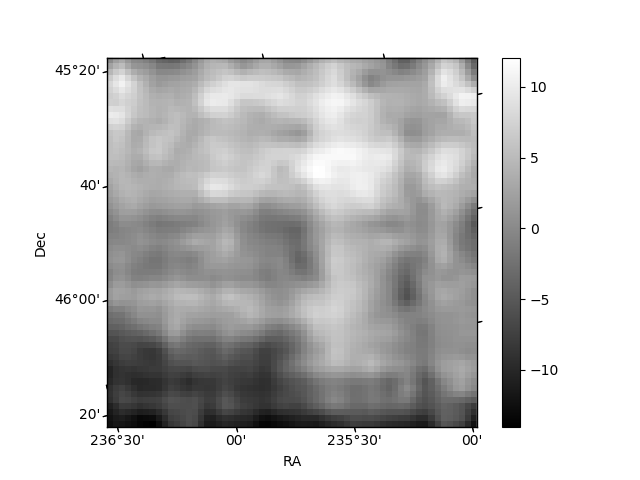
Histogram calculated using DETX and DETY for each event in the final _common_clean file
| Quadrant A | 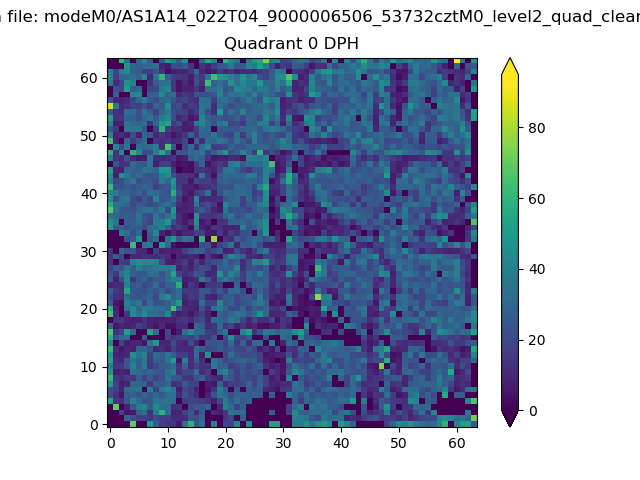 |
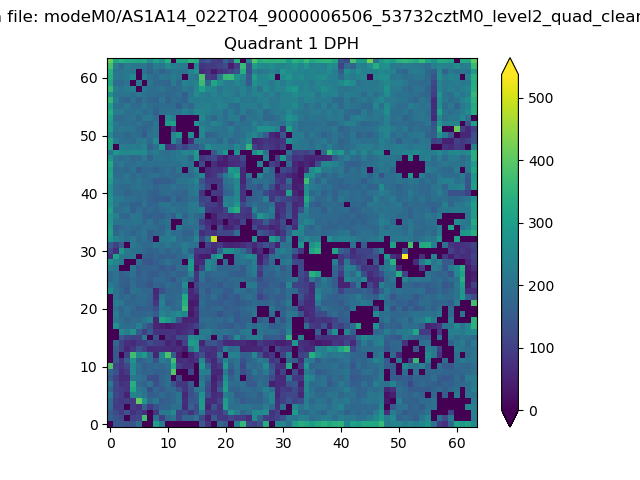 |
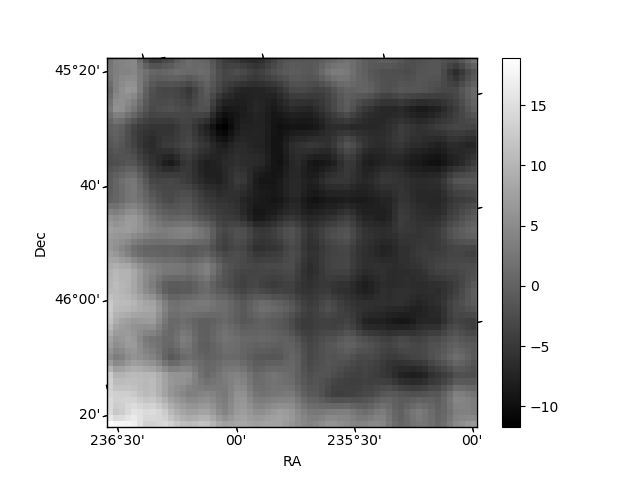
Quadrant B |
|---|---|---|---|
| Quadrant D | 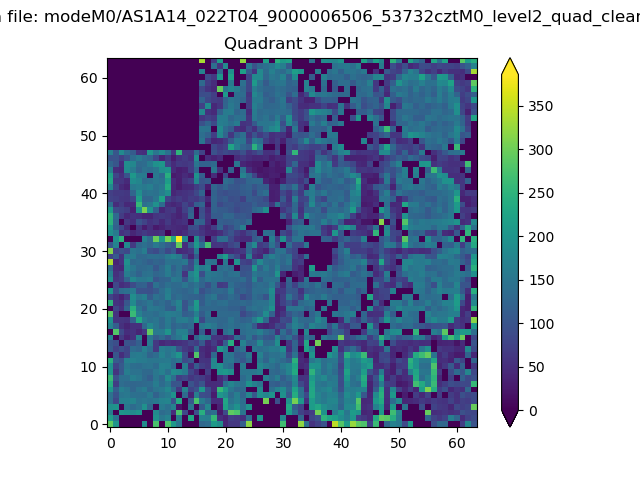 |
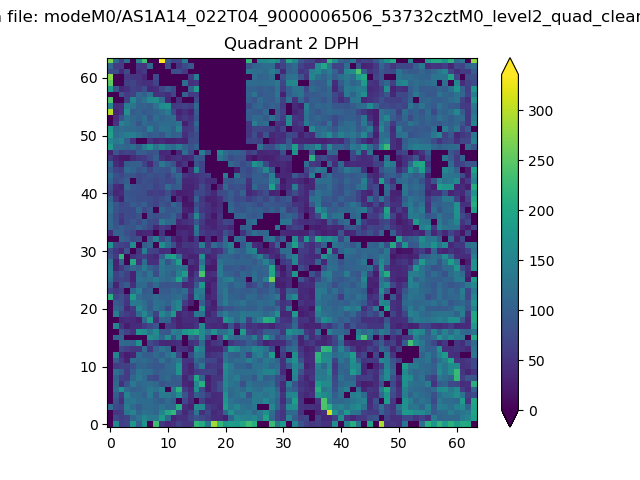 |
Quadrant C |
| Plot type | Count rate plots | Images |
|---|---|---|
| Comparison with Poisson distribution Blue bars denote a histogram of data divided into 1 sec bins. Red curve is a Poisson curve with rate = median count rate of data. |
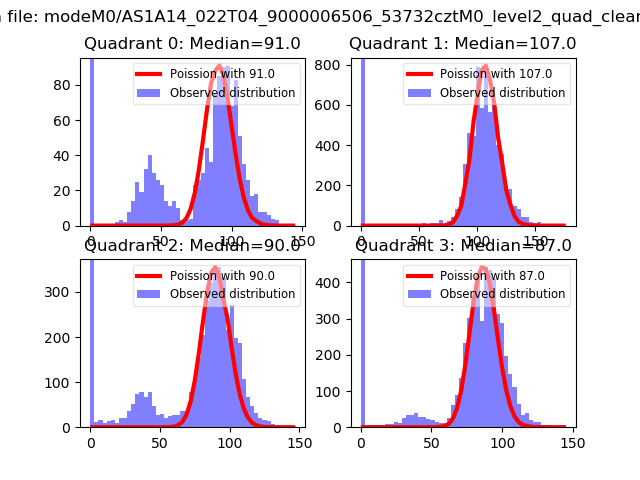 |
 |
| Quadrant-wise count rates Data is divided into 100 sec bins |
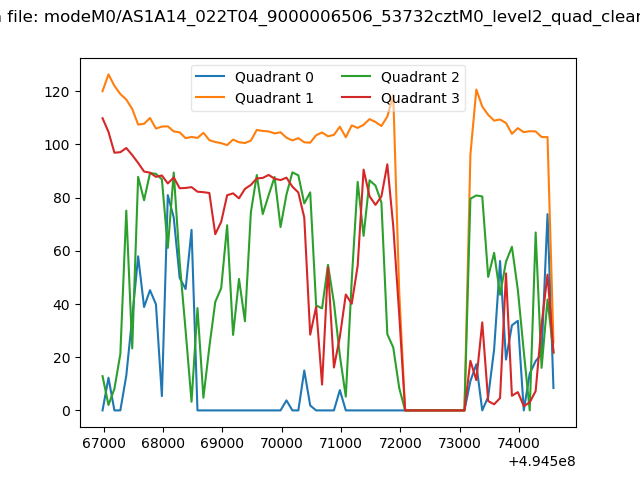 |
|
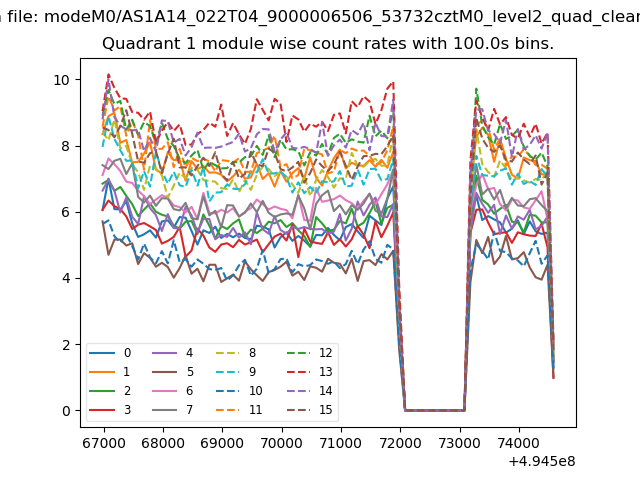
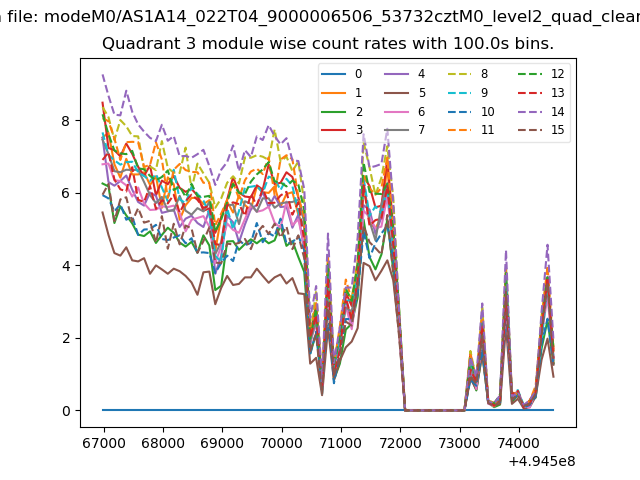
| Module-wise count rates for Quadrant A Data is divided into 100 sec bins |
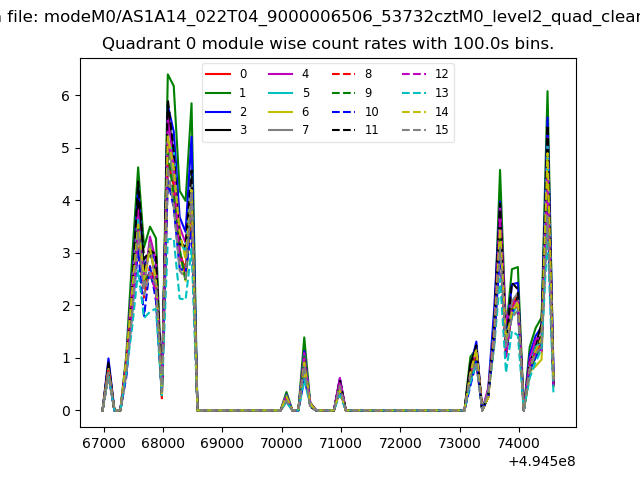 |
 |
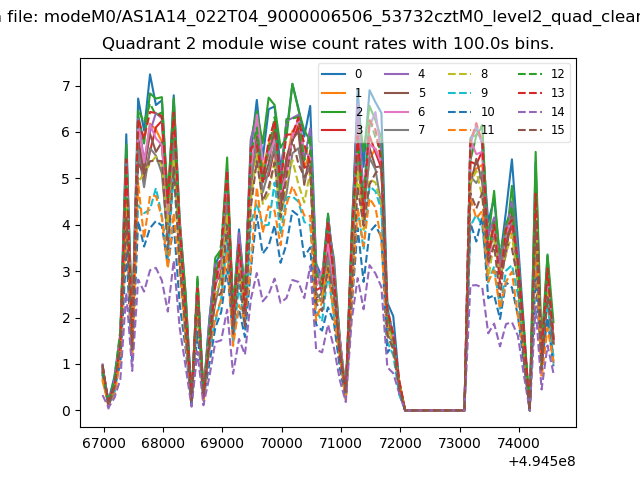
| Module-wise count rates for Quadrant B Data is divided into 100 sec bins |
 |
 |
| Module-wise count rates for Quadrant C Data is divided into 100 sec bins |
 |
 |
| Module-wise count rates for Quadrant D Data is divided into 100 sec bins |
 |
 |
| Parameter | Plot |
|---|---|
| CZT HV Monitor | 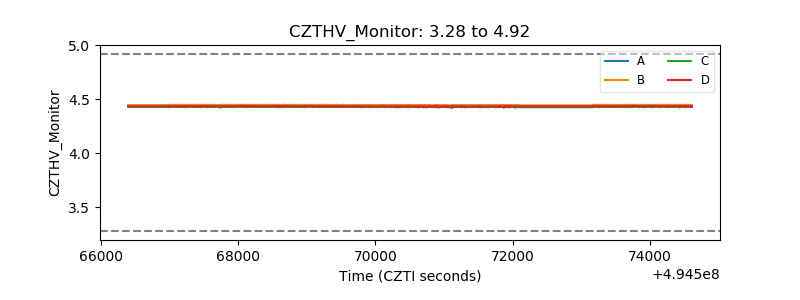 |
| D_VDD | 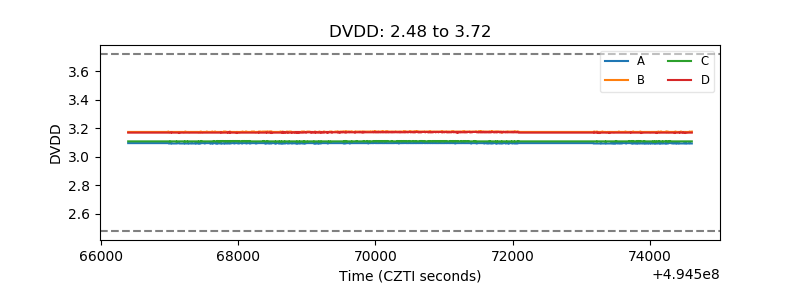 |
| Temperature 1 | 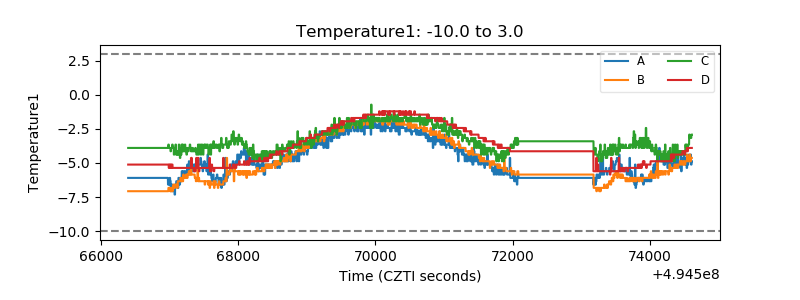 |
| Veto HV Monitor | 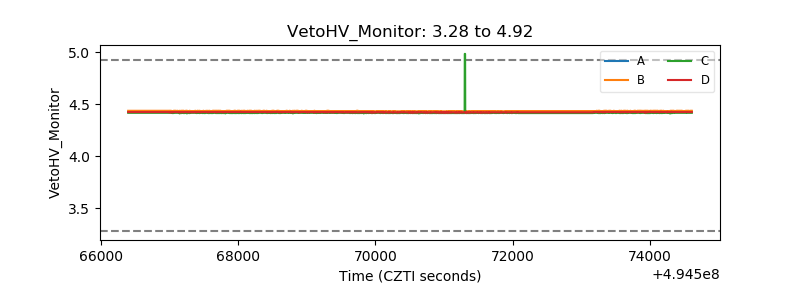 |
| Veto LLD | 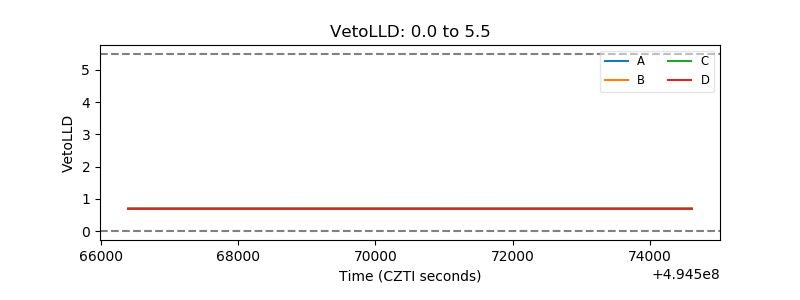 |
| Alpha Counter | 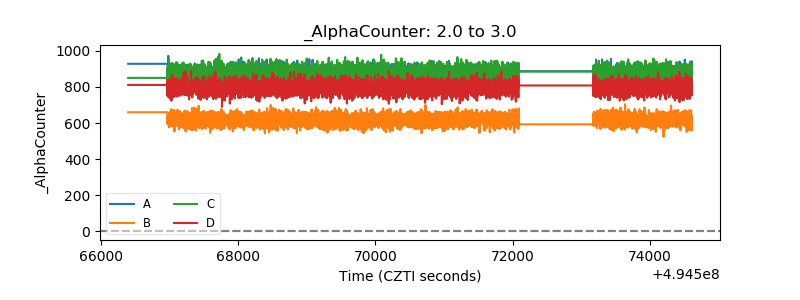 |
| _CPM_Rate | 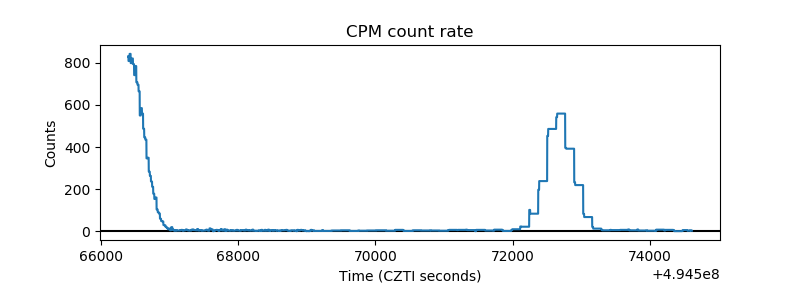 |
| CZT Counter | 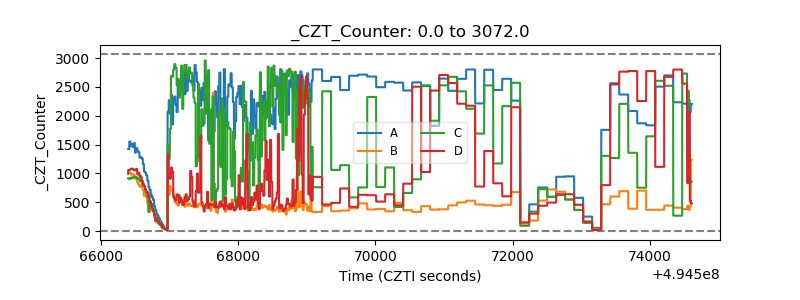 |
| +2.5 Volts monitor |  |
| +5 Volts monitor |  |
| _ROLL_ROT | 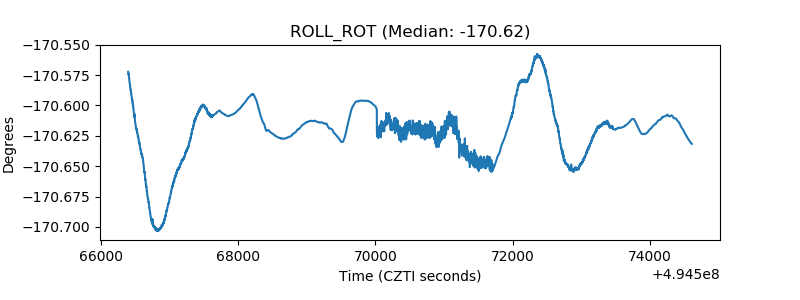 |
| _Roll_DEC | 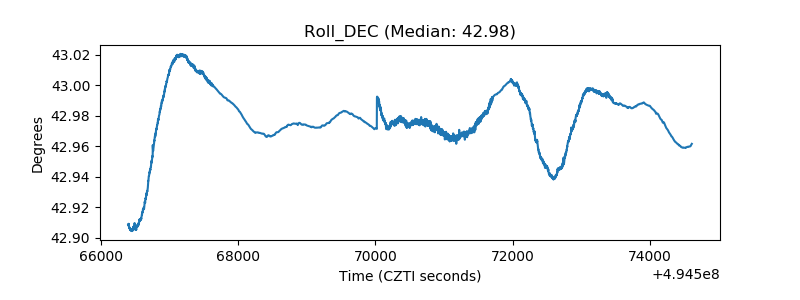 |
| _Roll_RA | 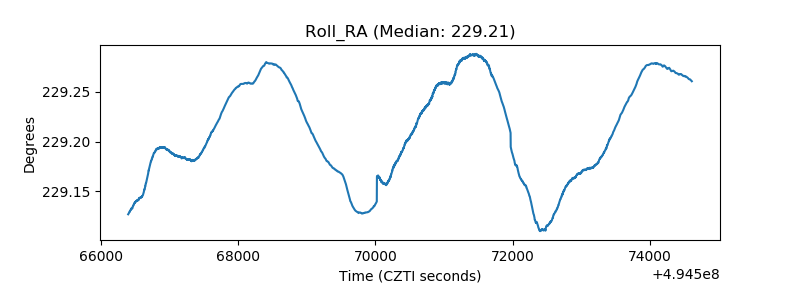 |
| Veto Counter | 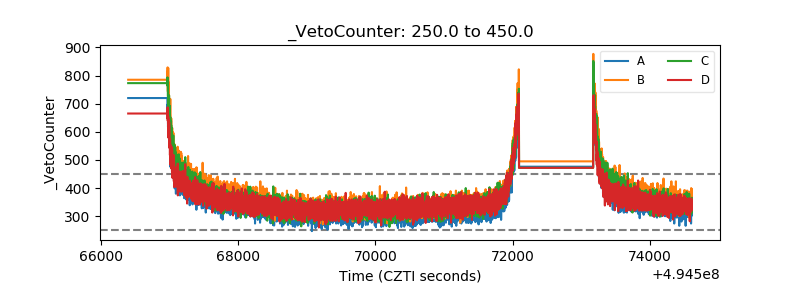 |