| Param | Original file | Final file |
|---|---|---|
| Filename | modeM0/AS1A14_022T04_9000006506_53733cztM0_level2.fits | modeM0/AS1A14_022T04_9000006506_53733cztM0_level2_quad_clean.evt |
| Size (bytes) | 1,020,467,520 | 62,498,880 |
| Size | 973.2 MB | 59.6 MB |
| Events in quadrant A | 15,521,607 | 61,978 |
| Events in quadrant B | 2,920,188 | 643,622 |
| Events in quadrant C | 9,801,624 | 376,313 |
| Events in quadrant D | 9,041,310 | 367,925 |
| Mode M0 | |||
|---|---|---|---|
| Quadrant | BADHDUFLAG | Total packets | Discarded packets |
| A | 0 | 50507 | 1 |
| B | 0 | 13391 | 1 |
| C | 0 | 33514 | 1 |
| D | 0 | 31248 | 1 |
| Mode SS | |||
|---|---|---|---|
| Quadrant | BADHDUFLAG | Total packets | Discarded packets |
| A | 0 | 130 | 0 |
| B | 0 | 130 | 0 |
| C | 0 | 130 | 0 |
| D | 0 | 130 | 0 |
| Mode M9 | |||
|---|---|---|---|
| Quadrant | BADHDUFLAG | Total packets | Discarded packets |
| A | 0 | 9 | 0 |
| B | 0 | 9 | 0 |
| C | 0 | 9 | 0 |
| D | 0 | 9 | 0 |
| Quadrant | Total seconds | Saturated seconds | Saturation percentage |
|---|---|---|---|
| A | 6333 | 5851 | 92.389073% |
| B | 6334 | 183 | 2.889170% |
| C | 6334 | 2517 | 39.737922% |
| D | 6334 | 2268 | 35.806757% |
Noise dominated data is calculated using 1-second bins in cleaned event files. If a bin has >2000 counts, and if more than 50% of those come from <1% of pixels, then it is considered to be noise-dominated and hence unusable.
| Quadrant | # 1 sec bins | Bins with >0 counts | Bins with >2000 counts | High rate bins dominated by noise | Noise dominated (total time) | Noise dominated (detector-on time) | Marked lightcurve |
|---|---|---|---|---|---|---|---|
| A | 7307 | 6332 | 5470 | 5470 | 74.86% | 86.39% | 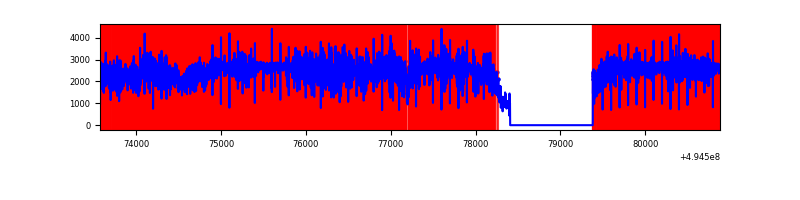 |
| B | 7309 | 6335 | 4 | 4 | 0.05% | 0.06% | 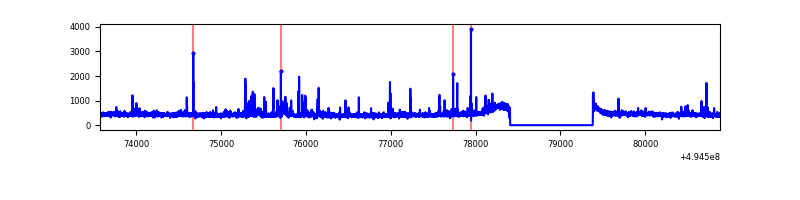 |
| C | 7309 | 6335 | 2039 | 2039 | 27.90% | 32.19% | 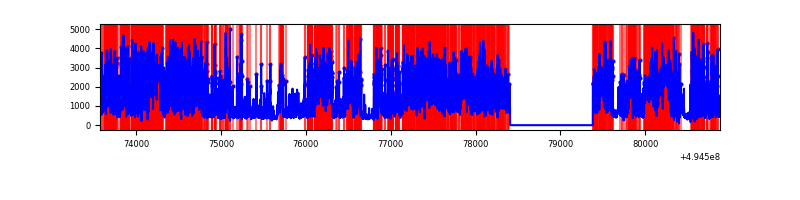 |
| D | 7309 | 6335 | 2009 | 2009 | 27.49% | 31.71% | 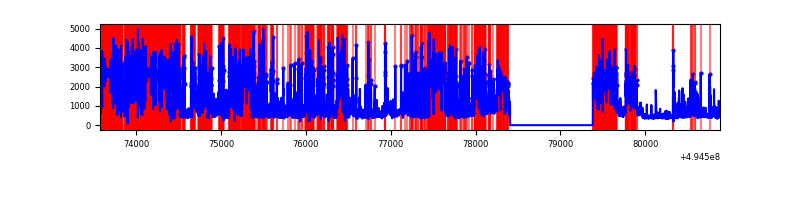 |
Top three noisy pixels from each quadrant. If the there are fewer than three noisy pixels in the level2.evt file, extra rows are filled as -1
| Pixel properties | Quadrant properties | ||||||
|---|---|---|---|---|---|---|---|
| Quadrant | DetID | PixID | Counts | Sigma | Mean | Median | Sigma |
| A | 3 | 63 | 13007145 | 140035.61 | 369 | 360 | 92.9 |
| A | 3 | 78 | 541073 | 5821.51 | 369 | 360 | 92.9 |
| A | 7 | 160 | 252557 | 2715.24 | 369 | 360 | 92.9 |
| B | 4 | 171 | 80366 | 544.23 | 678 | 654 | 146.5 |
| B | 2 | 136 | 32315 | 216.16 | 678 | 654 | 146.5 |
| B | 5 | 185 | 32051 | 214.36 | 678 | 654 | 146.5 |
| C | 15 | 224 | 3730396 | 25238.86 | 536 | 533 | 147.8 |
| C | 1 | 241 | 3294193 | 22287.2 | 536 | 533 | 147.8 |
| C | 3 | 242 | 128764 | 867.7 | 536 | 533 | 147.8 |
| D | 1 | 241 | 1874593 | 12667.44 | 522 | 501 | 147.9 |
| D | 2 | 172 | 1813070 | 12251.59 | 522 | 501 | 147.9 |
| D | 6 | 239 | 1502840 | 10154.67 | 522 | 501 | 147.9 |
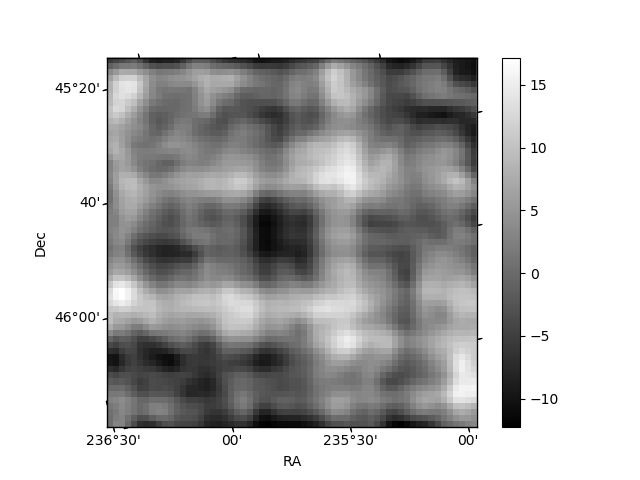
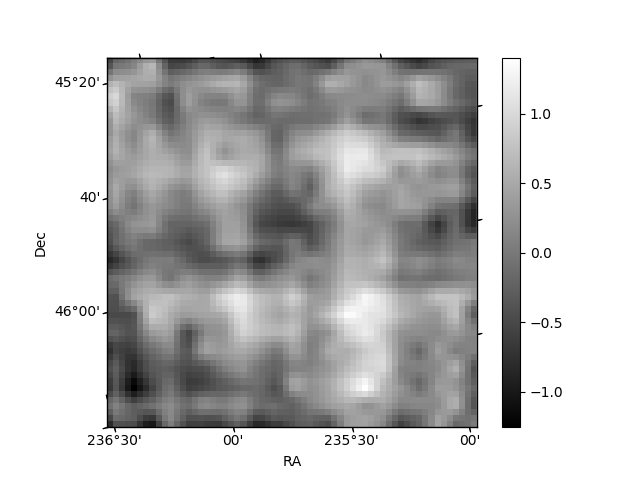
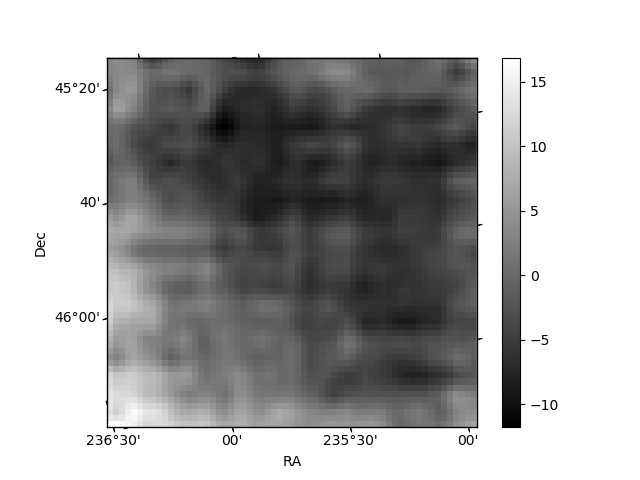
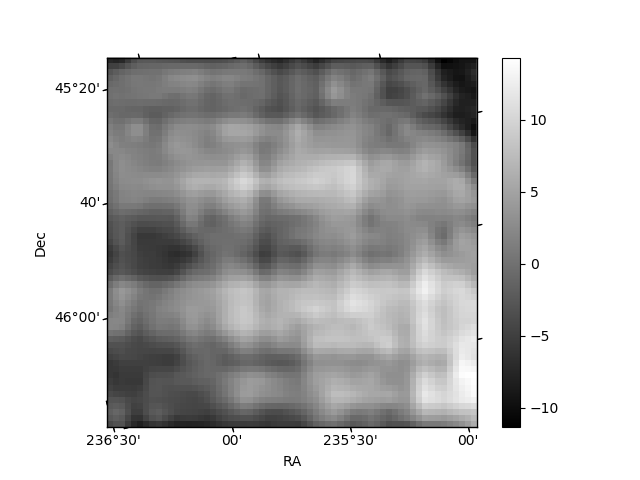
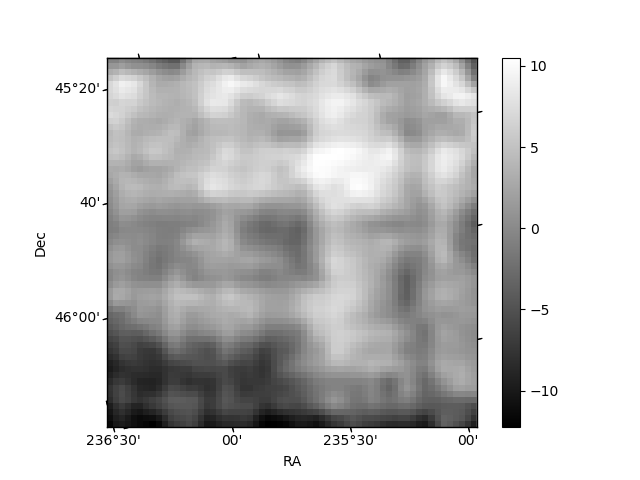
Histogram calculated using DETX and DETY for each event in the final _common_clean file
| Quadrant A | 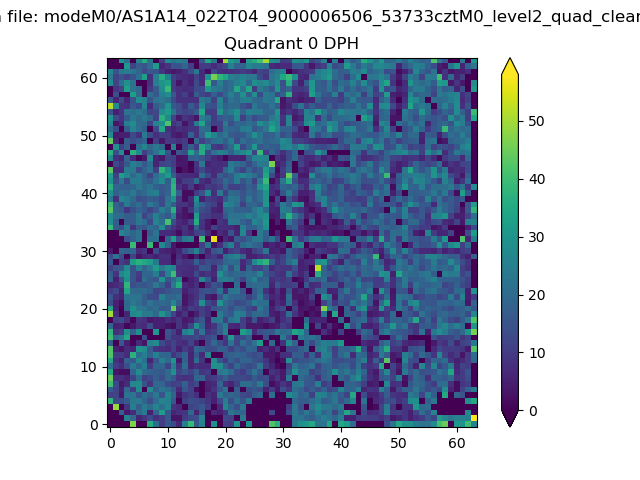 |
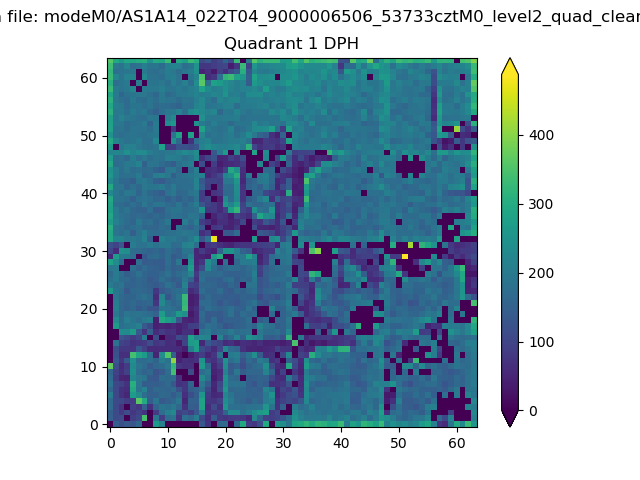 |
Quadrant B |
|---|---|---|---|
| Quadrant D | 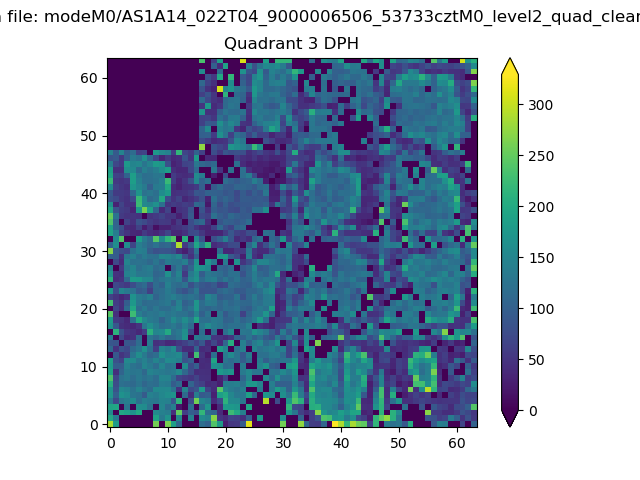 |
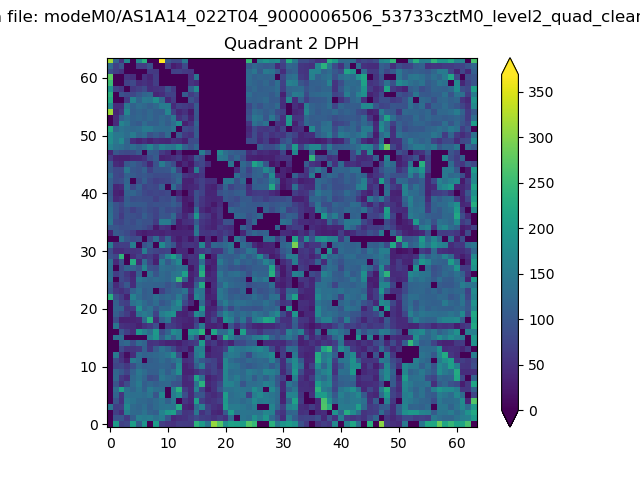 |
Quadrant C |
| Plot type | Count rate plots | Images |
|---|---|---|
| Comparison with Poisson distribution Blue bars denote a histogram of data divided into 1 sec bins. Red curve is a Poisson curve with rate = median count rate of data. |
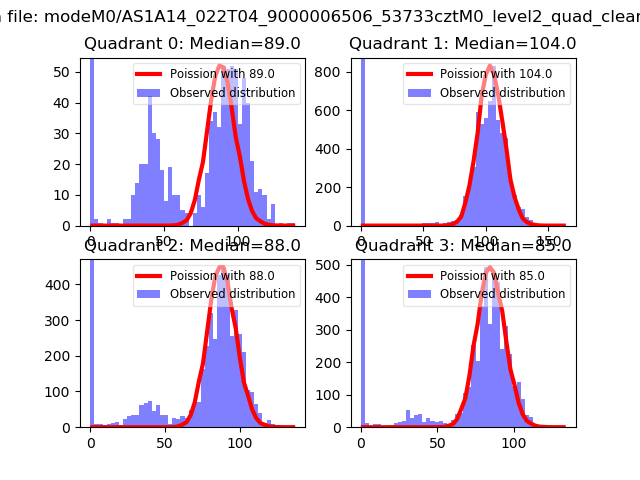 |
 |
| Quadrant-wise count rates Data is divided into 100 sec bins |
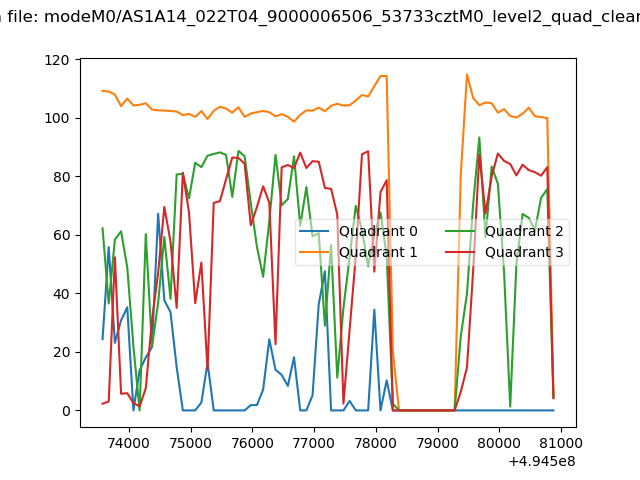 |
|
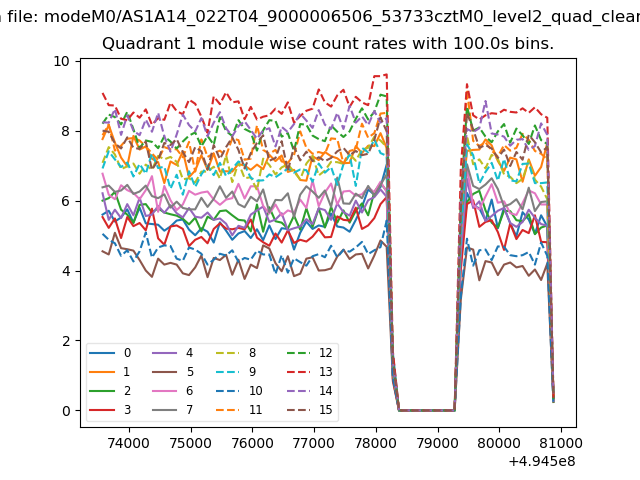
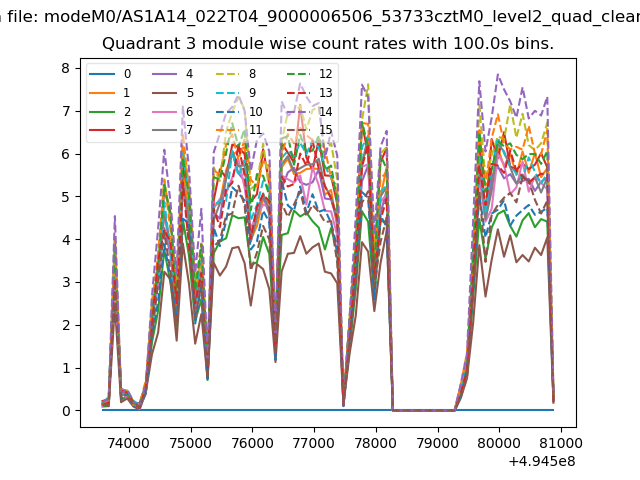
| Module-wise count rates for Quadrant A Data is divided into 100 sec bins |
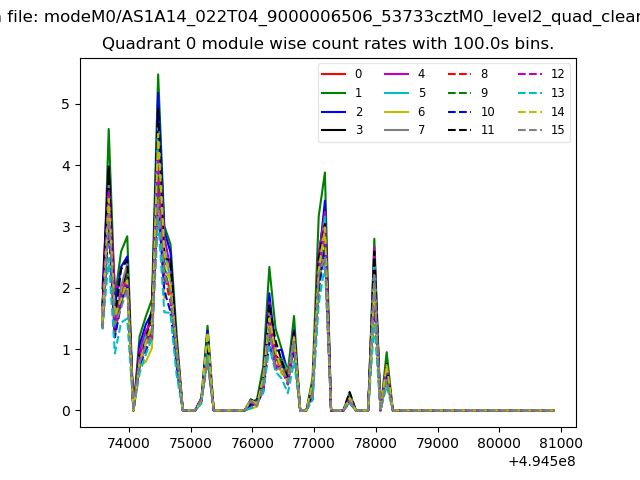 |
 |
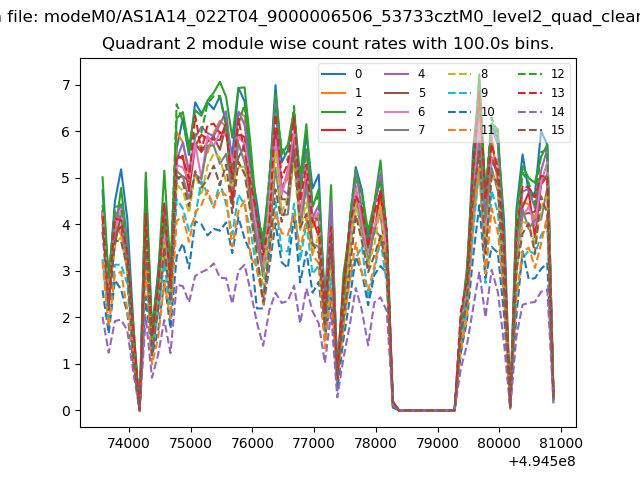
| Module-wise count rates for Quadrant B Data is divided into 100 sec bins |
 |
 |
| Module-wise count rates for Quadrant C Data is divided into 100 sec bins |
 |
 |
| Module-wise count rates for Quadrant D Data is divided into 100 sec bins |
 |
 |
| Parameter | Plot |
|---|---|
| CZT HV Monitor | 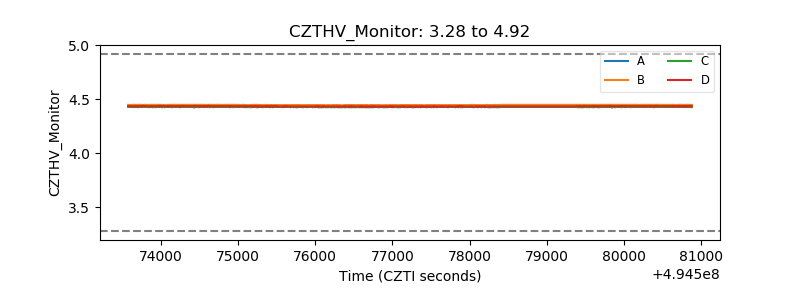 |
| D_VDD | 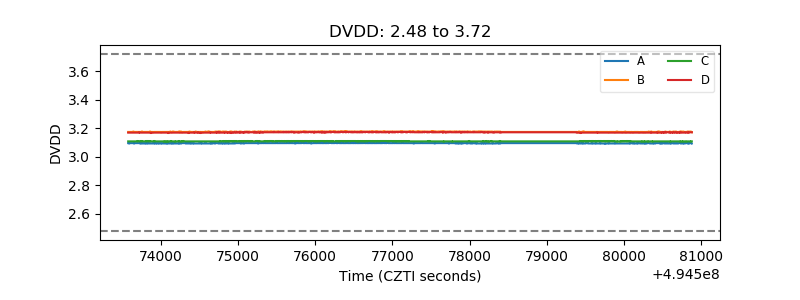 |
| Temperature 1 | 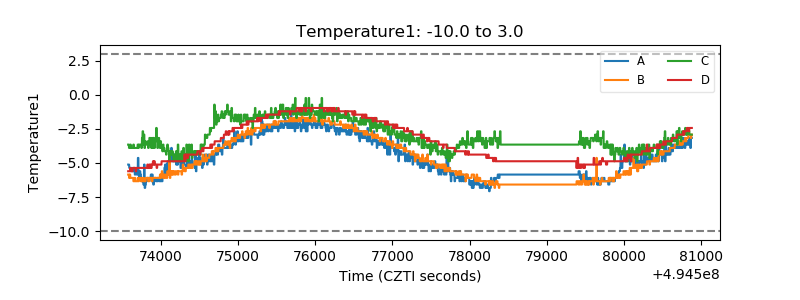 |
| Veto HV Monitor | 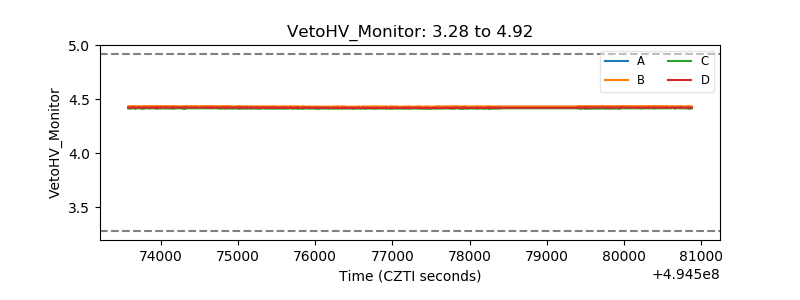 |
| Veto LLD | 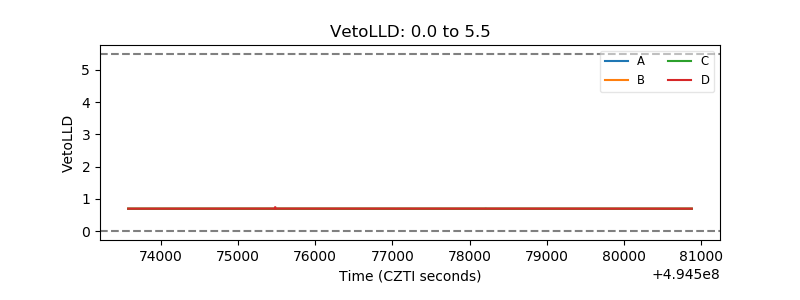 |
| Alpha Counter | 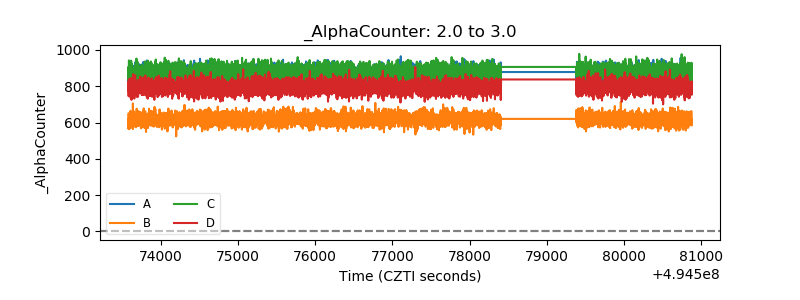 |
| _CPM_Rate | 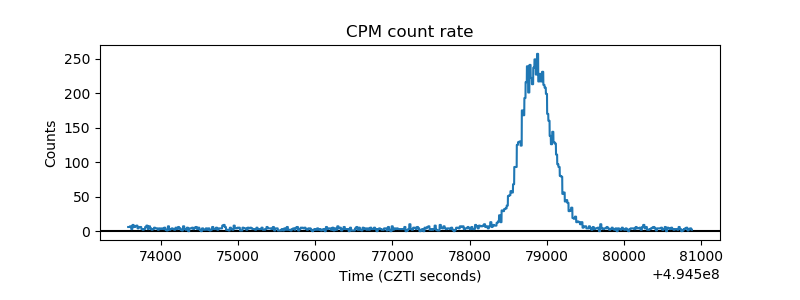 |
| CZT Counter | 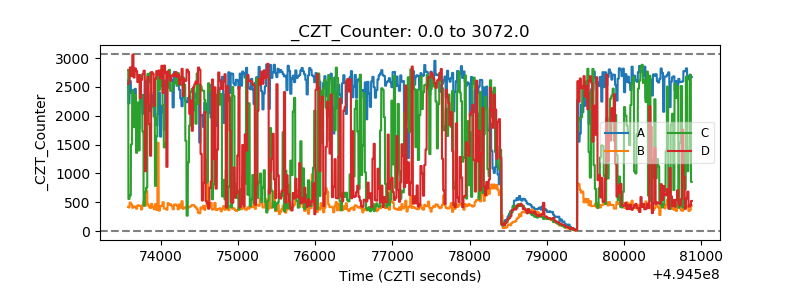 |
| +2.5 Volts monitor | 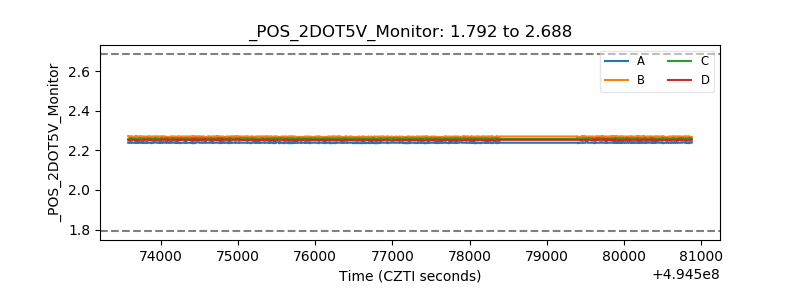 |
| +5 Volts monitor | 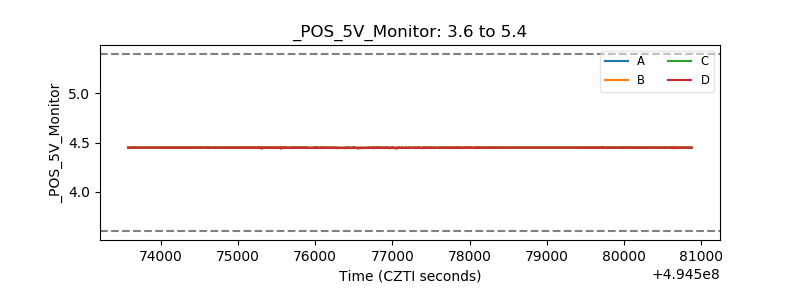 |
| _ROLL_ROT | 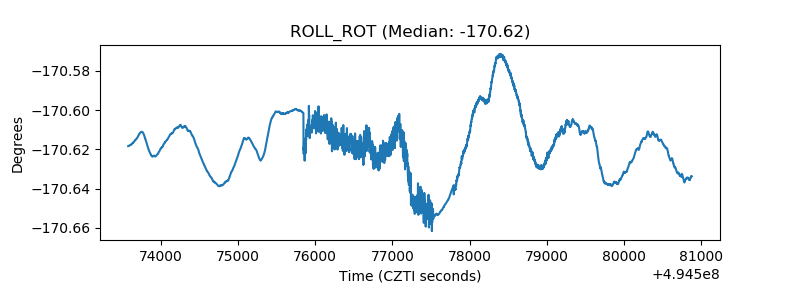 |
| _Roll_DEC | 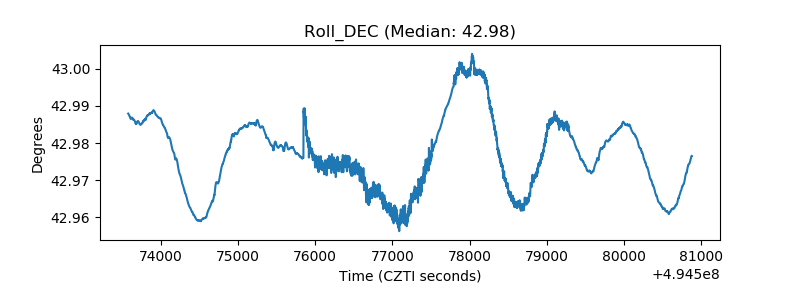 |
| _Roll_RA | 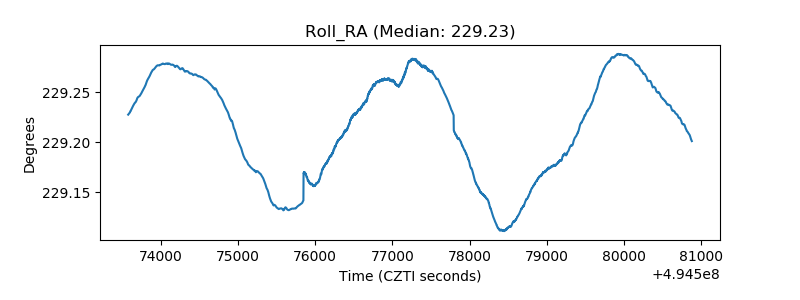 |
| Veto Counter | 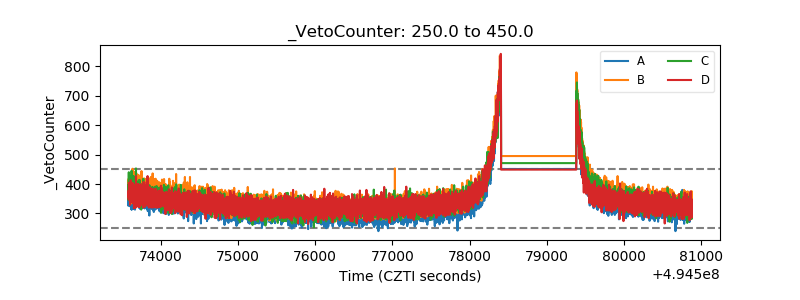 |