| Param | Original file | Final file |
|---|---|---|
| Filename | modeM0/AS1A14_022T04_9000006506_53734cztM0_level2.fits | modeM0/AS1A14_022T04_9000006506_53734cztM0_level2_quad_clean.evt |
| Size (bytes) | 1,074,942,720 | 68,480,640 |
| Size | 1.0 GB | 65.3 MB |
| Events in quadrant A | 17,156,138 | 20,170 |
| Events in quadrant B | 3,120,529 | 695,665 |
| Events in quadrant C | 10,342,366 | 436,303 |
| Events in quadrant D | 8,639,814 | 441,646 |
| Mode M0 | |||
|---|---|---|---|
| Quadrant | BADHDUFLAG | Total packets | Discarded packets |
| A | 0 | 55780 | 1 |
| B | 0 | 14470 | 1 |
| C | 0 | 35498 | 1 |
| D | 0 | 30412 | 1 |
| Mode SS | |||
|---|---|---|---|
| Quadrant | BADHDUFLAG | Total packets | Discarded packets |
| A | 0 | 138 | 0 |
| B | 0 | 138 | 0 |
| C | 0 | 138 | 0 |
| D | 0 | 138 | 0 |
| Mode M9 | |||
|---|---|---|---|
| Quadrant | BADHDUFLAG | Total packets | Discarded packets |
| A | 0 | 9 | 0 |
| B | 0 | 9 | 0 |
| C | 0 | 9 | 0 |
| D | 0 | 9 | 0 |
| Quadrant | Total seconds | Saturated seconds | Saturation percentage |
|---|---|---|---|
| A | 6883 | 6740 | 97.922418% |
| B | 6883 | 129 | 1.874183% |
| C | 6884 | 2413 | 35.052295% |
| D | 6884 | 1908 | 27.716444% |
Noise dominated data is calculated using 1-second bins in cleaned event files. If a bin has >2000 counts, and if more than 50% of those come from <1% of pixels, then it is considered to be noise-dominated and hence unusable.
| Quadrant | # 1 sec bins | Bins with >0 counts | Bins with >2000 counts | High rate bins dominated by noise | Noise dominated (total time) | Noise dominated (detector-on time) | Marked lightcurve |
|---|---|---|---|---|---|---|---|
| A | 7697 | 6883 | 6213 | 6213 | 80.72% | 90.27% | 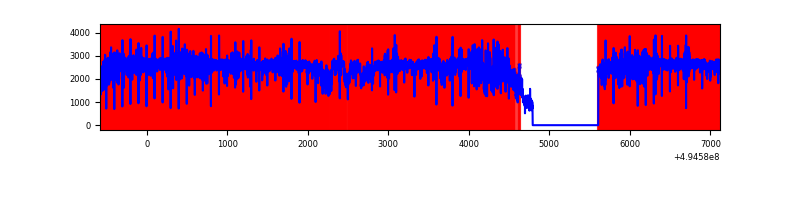 |
| B | 7698 | 6884 | 17 | 17 | 0.22% | 0.25% | 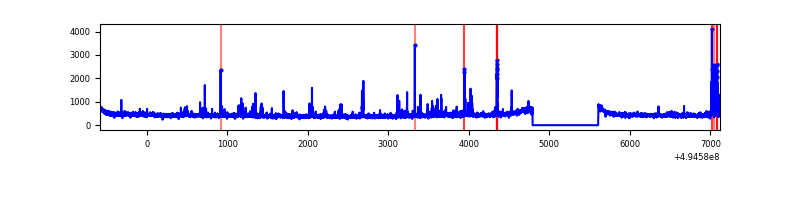 |
| C | 7699 | 6884 | 1935 | 1935 | 25.13% | 28.11% | 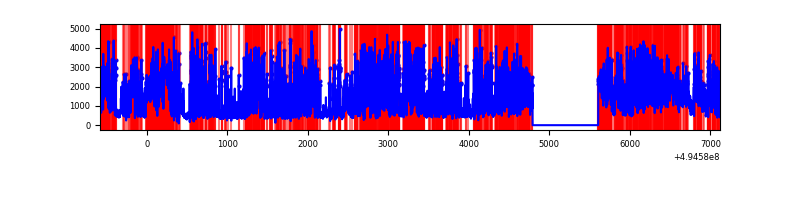 |
| D | 7699 | 6885 | 1628 | 1628 | 21.15% | 23.65% | 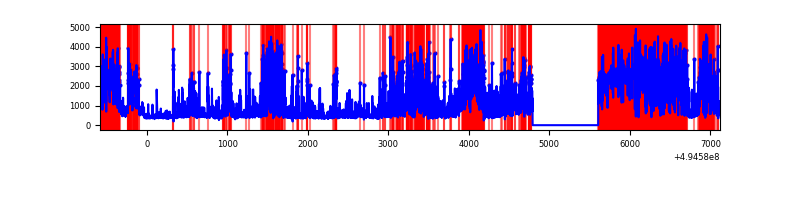 |
Top three noisy pixels from each quadrant. If the there are fewer than three noisy pixels in the level2.evt file, extra rows are filled as -1
| Pixel properties | Quadrant properties | ||||||
|---|---|---|---|---|---|---|---|
| Quadrant | DetID | PixID | Counts | Sigma | Mean | Median | Sigma |
| A | 3 | 63 | 15025420 | 227830.07 | 262 | 255 | 65.9 |
| A | 3 | 78 | 894865 | 13565.18 | 262 | 255 | 65.9 |
| A | 7 | 160 | 95761 | 1448.18 | 262 | 255 | 65.9 |
| B | 0 | 213 | 73890 | 475.43 | 723 | 696 | 154.0 |
| B | 10 | 247 | 37585 | 239.61 | 723 | 696 | 154.0 |
| B | 4 | 171 | 26260 | 166.05 | 723 | 696 | 154.0 |
| C | 15 | 224 | 4943255 | 30210.68 | 593 | 588 | 163.6 |
| C | 1 | 241 | 1803644 | 11020.68 | 593 | 588 | 163.6 |
| C | 3 | 242 | 937240 | 5725.02 | 593 | 588 | 163.6 |
| D | 8 | 176 | 4510859 | 26390.55 | 595 | 570 | 170.9 |
| D | 6 | 239 | 777189 | 4544.14 | 595 | 570 | 170.9 |
| D | 1 | 241 | 132660 | 772.88 | 595 | 570 | 170.9 |
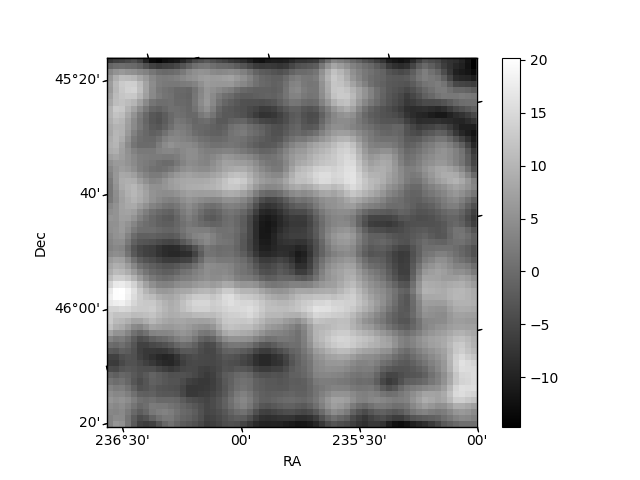
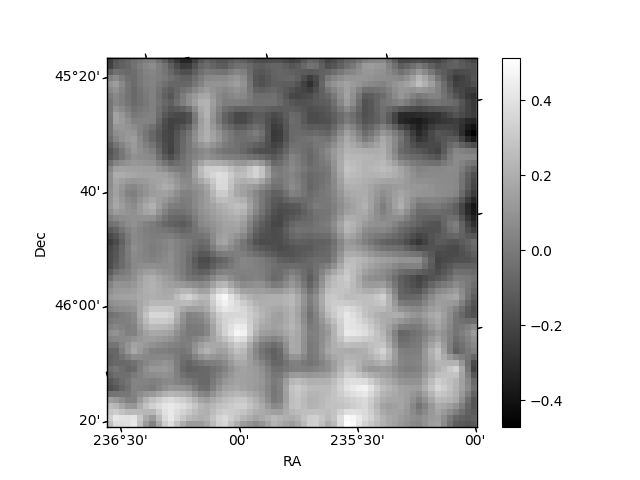
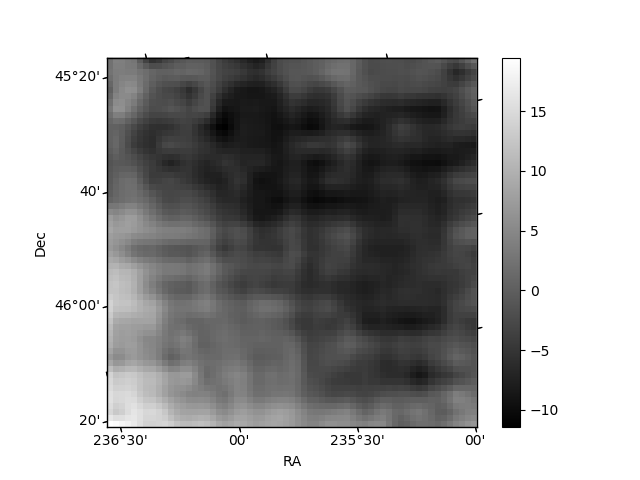
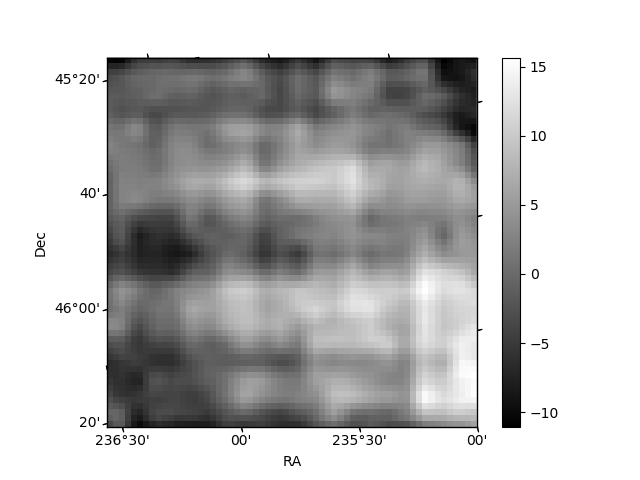
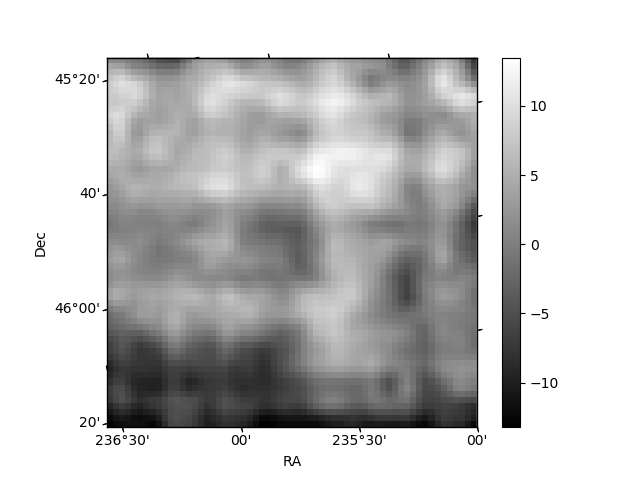
Histogram calculated using DETX and DETY for each event in the final _common_clean file
| Quadrant A | 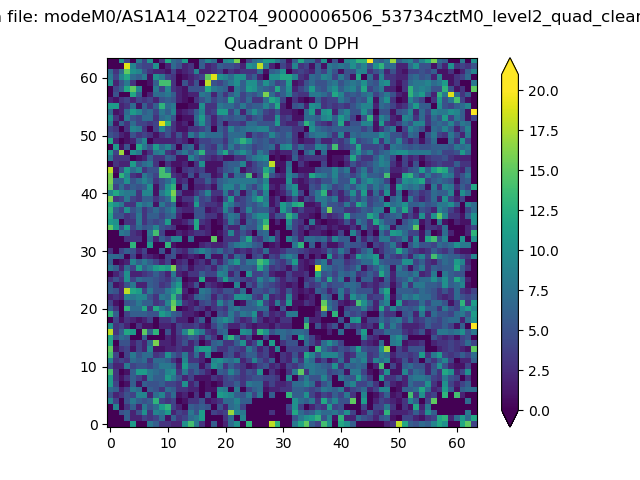 |
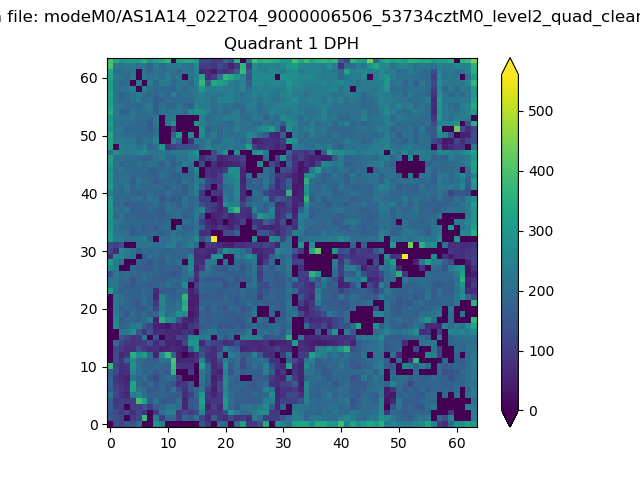 |
Quadrant B |
|---|---|---|---|
| Quadrant D | 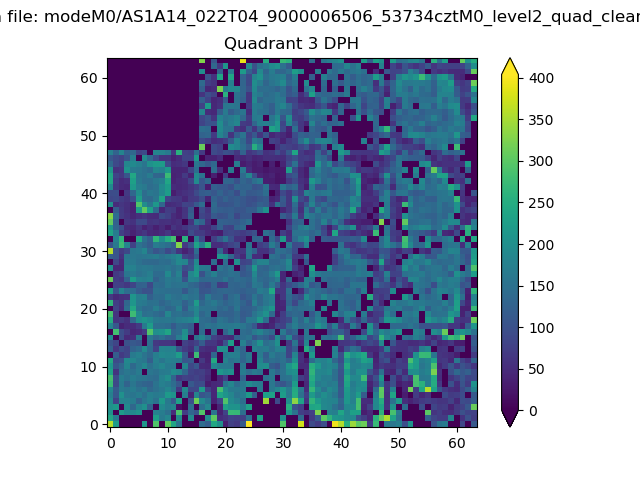 |
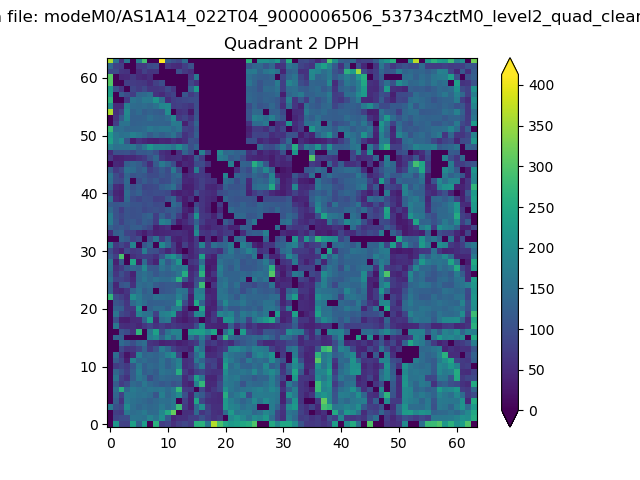 |
Quadrant C |
| Plot type | Count rate plots | Images |
|---|---|---|
| Comparison with Poisson distribution Blue bars denote a histogram of data divided into 1 sec bins. Red curve is a Poisson curve with rate = median count rate of data. |
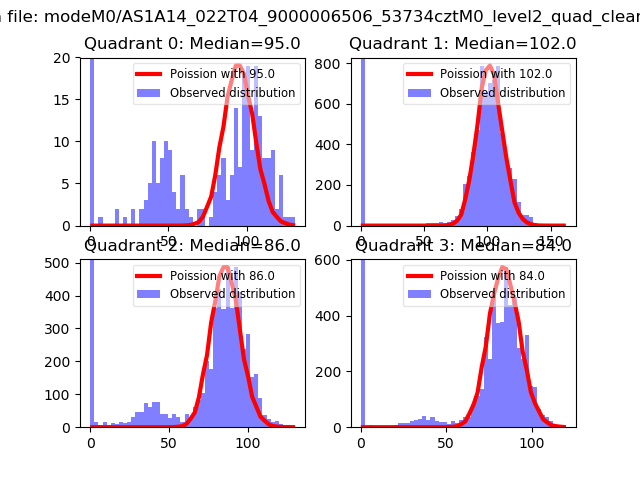 |
 |
| Quadrant-wise count rates Data is divided into 100 sec bins |
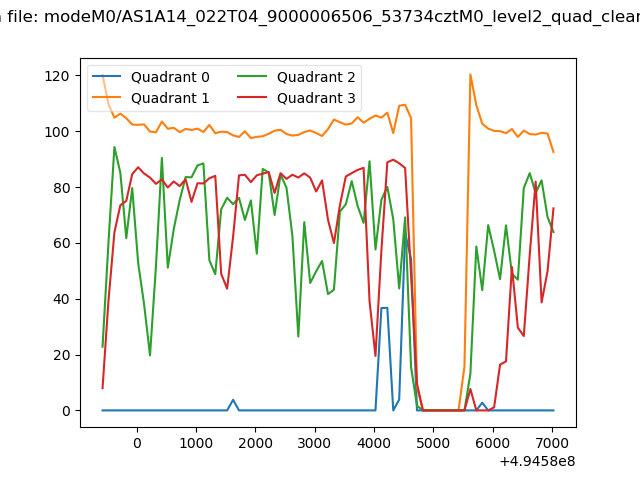 |
|
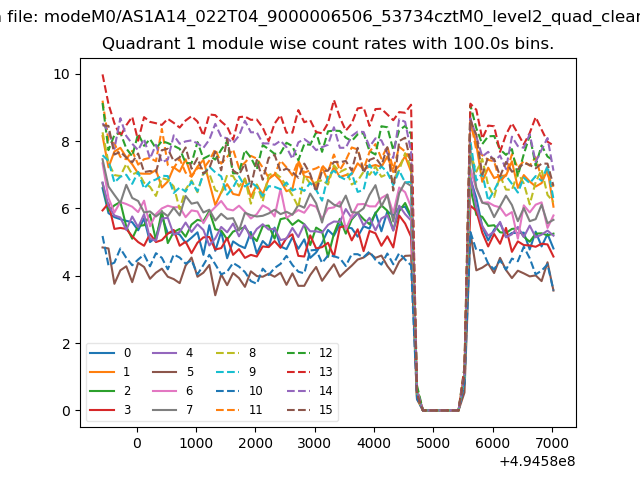
| Module-wise count rates for Quadrant A Data is divided into 100 sec bins |
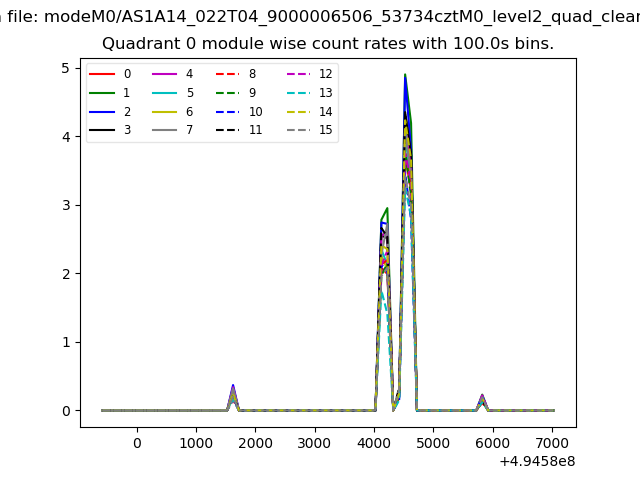 |
 |
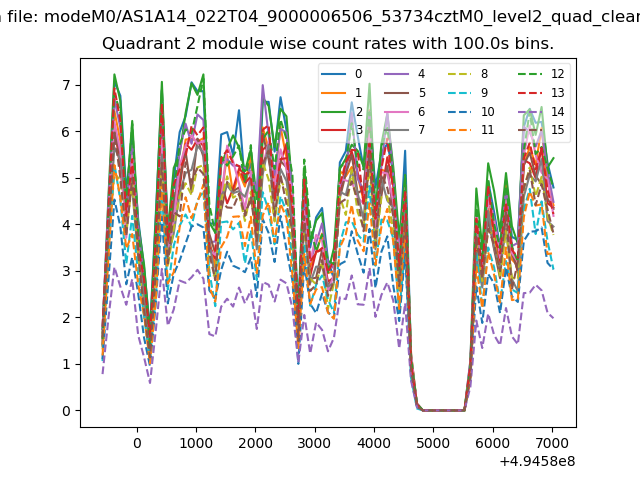
| Module-wise count rates for Quadrant B Data is divided into 100 sec bins |
 |
 |
| Module-wise count rates for Quadrant C Data is divided into 100 sec bins |
 |
 |
| Module-wise count rates for Quadrant D Data is divided into 100 sec bins |
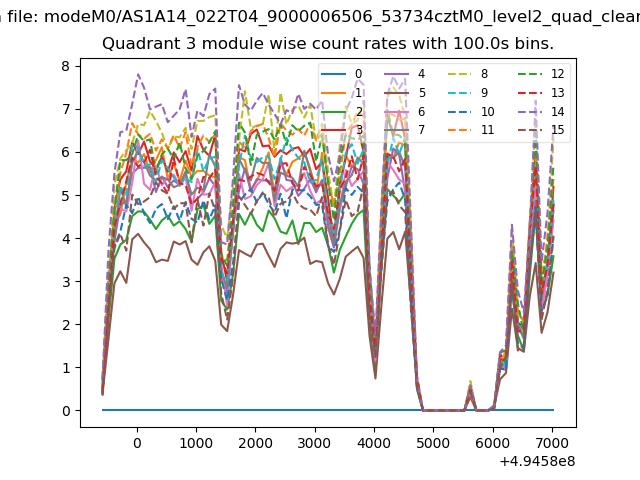 |
 |
| Parameter | Plot |
|---|---|
| CZT HV Monitor | 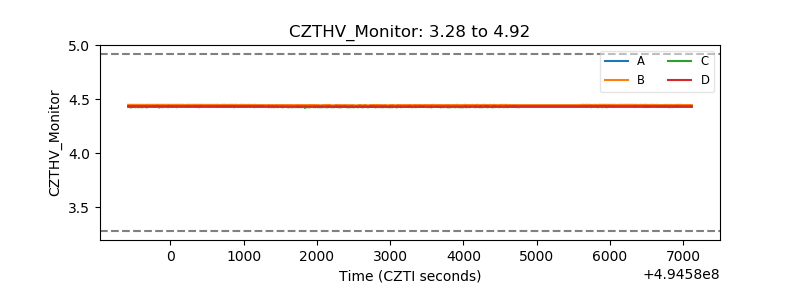 |
| D_VDD | 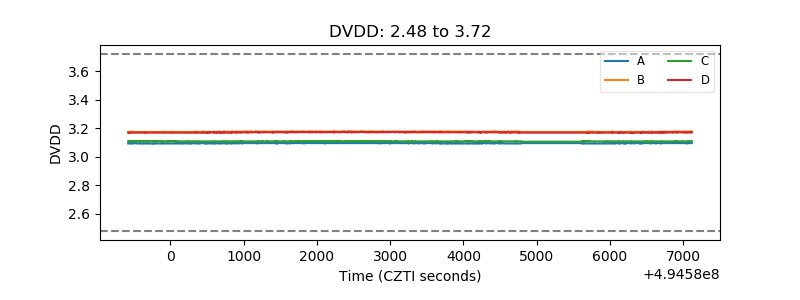 |
| Temperature 1 | 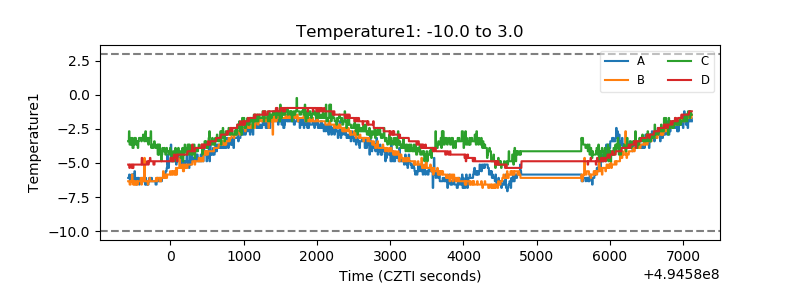 |
| Veto HV Monitor | 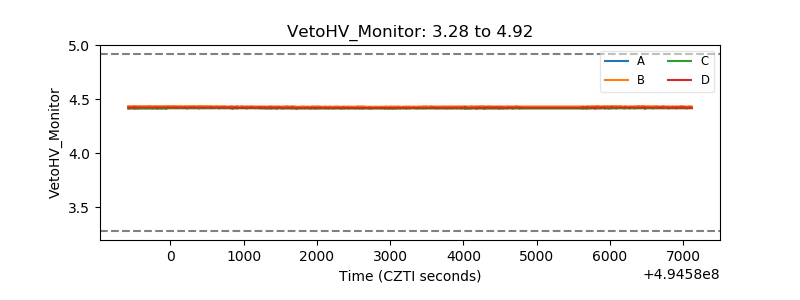 |
| Veto LLD | 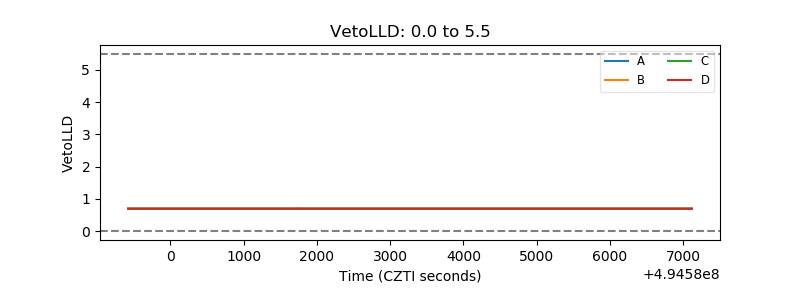 |
| Alpha Counter | 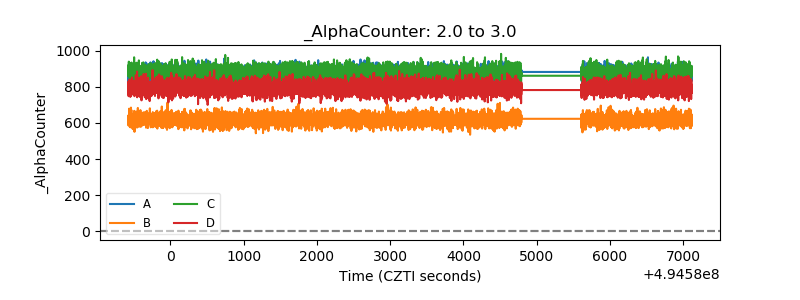 |
| _CPM_Rate | 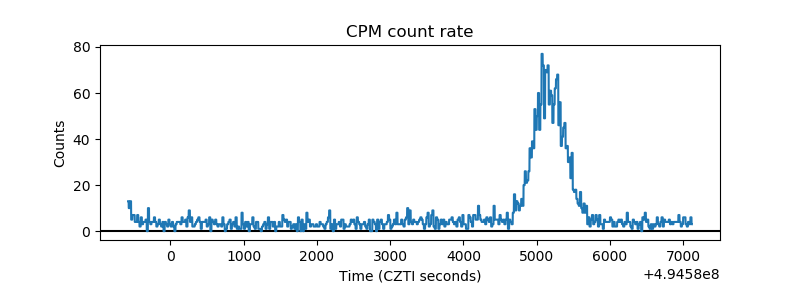 |
| CZT Counter | 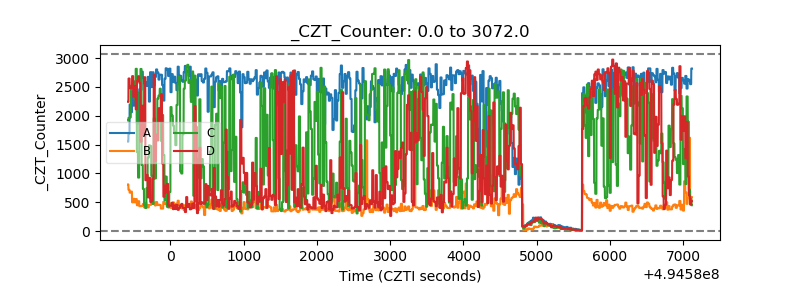 |
| +2.5 Volts monitor | 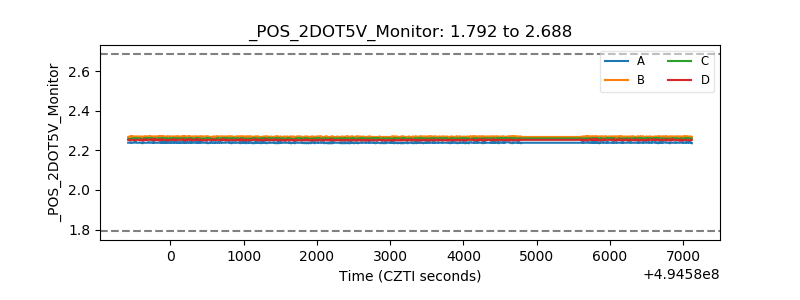 |
| +5 Volts monitor | 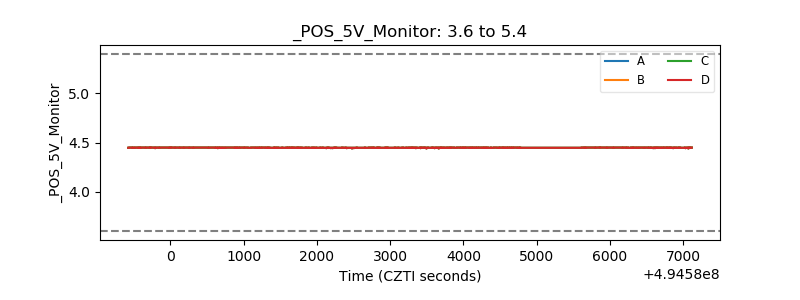 |
| _ROLL_ROT | 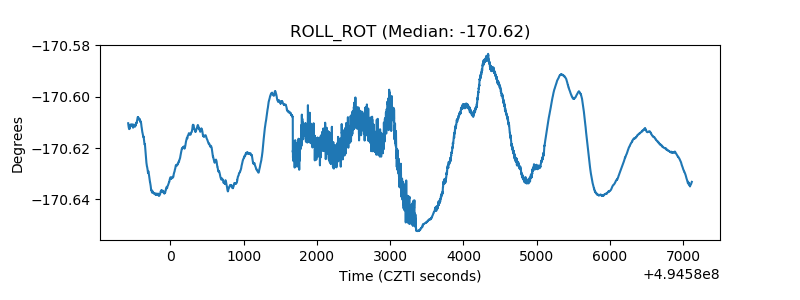 |
| _Roll_DEC | 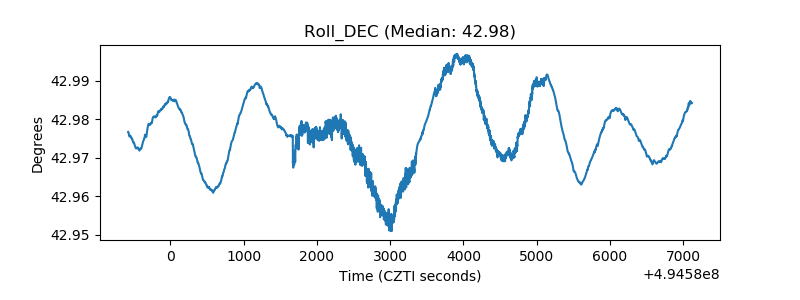 |
| _Roll_RA | 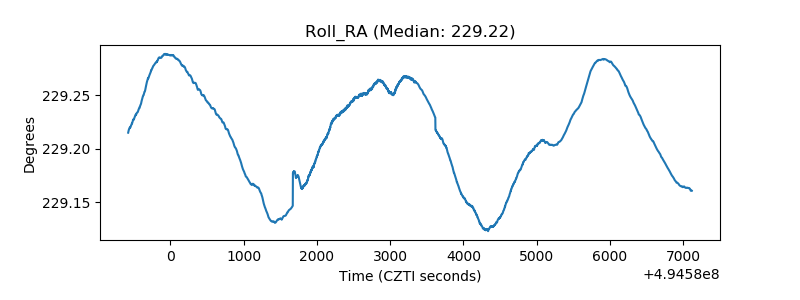 |
| Veto Counter | 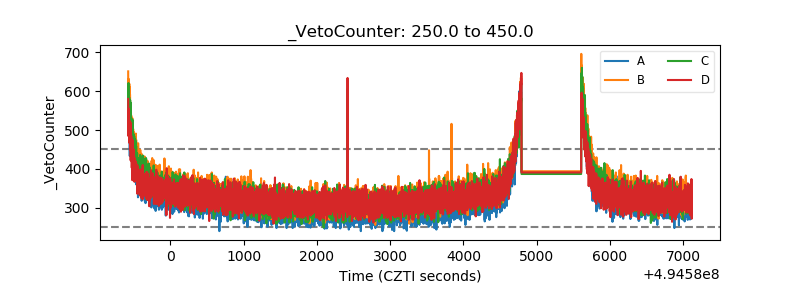 |