| Param | Original file | Final file |
|---|---|---|
| Filename | modeM0/AS1A14_022T04_9000006506_53736cztM0_level2.fits | modeM0/AS1A14_022T04_9000006506_53736cztM0_level2_quad_clean.evt |
| Size (bytes) | 1,184,993,280 | 67,006,080 |
| Size | 1.1 GB | 63.9 MB |
| Events in quadrant A | 17,397,480 | 26,027 |
| Events in quadrant B | 3,325,187 | 709,705 |
| Events in quadrant C | 12,516,649 | 363,514 |
| Events in quadrant D | 10,078,062 | 435,540 |
| Mode M0 | |||
|---|---|---|---|
| Quadrant | BADHDUFLAG | Total packets | Discarded packets |
| A | 0 | 56594 | 14 |
| B | 0 | 15210 | 1 |
| C | 0 | 41973 | 15 |
| D | 0 | 34902 | 5 |
| Mode SS | |||
|---|---|---|---|
| Quadrant | BADHDUFLAG | Total packets | Discarded packets |
| A | 0 | 140 | 0 |
| B | 0 | 140 | 0 |
| C | 0 | 140 | 0 |
| D | 0 | 140 | 0 |
| Quadrant | Total seconds | Saturated seconds | Saturation percentage |
|---|---|---|---|
| A | 7094 | 6888 | 97.096138% |
| B | 7095 | 37 | 0.521494% |
| C | 7094 | 3346 | 47.166620% |
| D | 7094 | 2173 | 30.631520% |
Noise dominated data is calculated using 1-second bins in cleaned event files. If a bin has >2000 counts, and if more than 50% of those come from <1% of pixels, then it is considered to be noise-dominated and hence unusable.
| Quadrant | # 1 sec bins | Bins with >0 counts | Bins with >2000 counts | High rate bins dominated by noise | Noise dominated (total time) | Noise dominated (detector-on time) | Marked lightcurve |
|---|---|---|---|---|---|---|---|
| A | 7095 | 7093 | 6219 | 6219 | 87.65% | 87.68% | 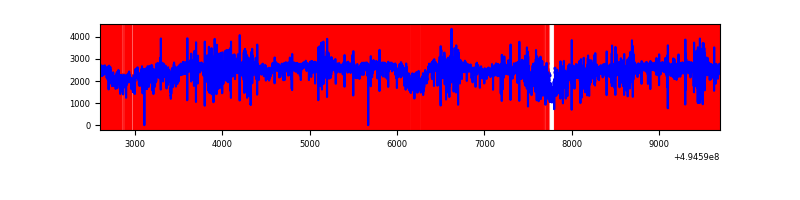 |
| B | 7095 | 7095 | 14 | 14 | 0.20% | 0.20% | 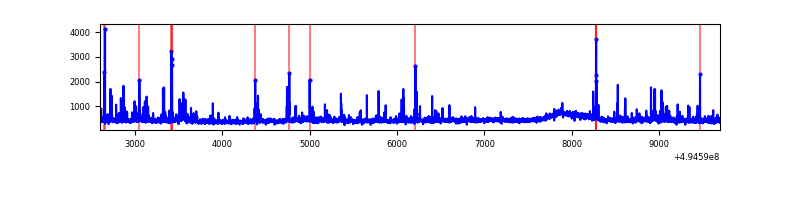 |
| C | 7096 | 7094 | 3054 | 3054 | 43.04% | 43.05% | 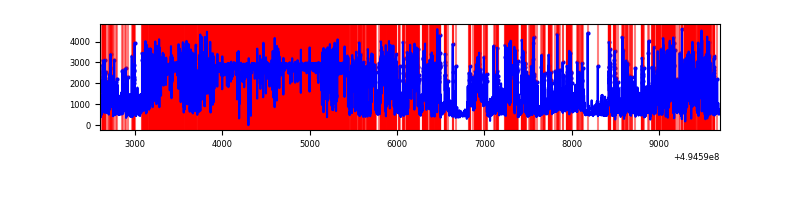 |
| D | 7096 | 7095 | 1922 | 1922 | 27.09% | 27.09% | 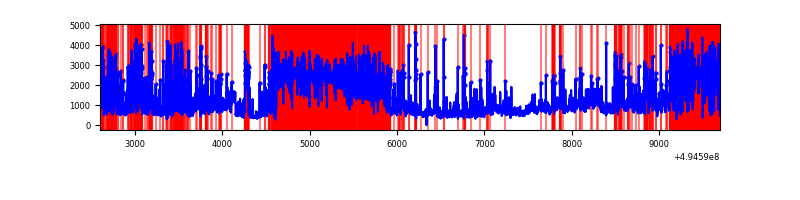 |
Top three noisy pixels from each quadrant. If the there are fewer than three noisy pixels in the level2.evt file, extra rows are filled as -1
| Pixel properties | Quadrant properties | ||||||
|---|---|---|---|---|---|---|---|
| Quadrant | DetID | PixID | Counts | Sigma | Mean | Median | Sigma |
| A | 3 | 63 | 15778193 | 259293.56 | 240 | 234 | 60.8 |
| A | 3 | 78 | 250470 | 4112.36 | 240 | 234 | 60.8 |
| A | 8 | 245 | 222686 | 3655.76 | 240 | 234 | 60.8 |
| B | 0 | 213 | 109807 | 692.0 | 736 | 711 | 157.7 |
| B | 5 | 185 | 55993 | 350.66 | 736 | 711 | 157.7 |
| B | 7 | 0 | 52494 | 328.46 | 736 | 711 | 157.7 |
| C | 1 | 241 | 5575987 | 37512.25 | 535 | 531 | 148.6 |
| C | 15 | 224 | 3284919 | 22097.7 | 535 | 531 | 148.6 |
| C | 13 | 3 | 625043 | 4201.78 | 535 | 531 | 148.6 |
| D | 2 | 172 | 3891985 | 21786.12 | 622 | 595 | 178.6 |
| D | 1 | 241 | 1943507 | 10877.48 | 622 | 595 | 178.6 |
| D | 6 | 239 | 730034 | 4083.8 | 622 | 595 | 178.6 |
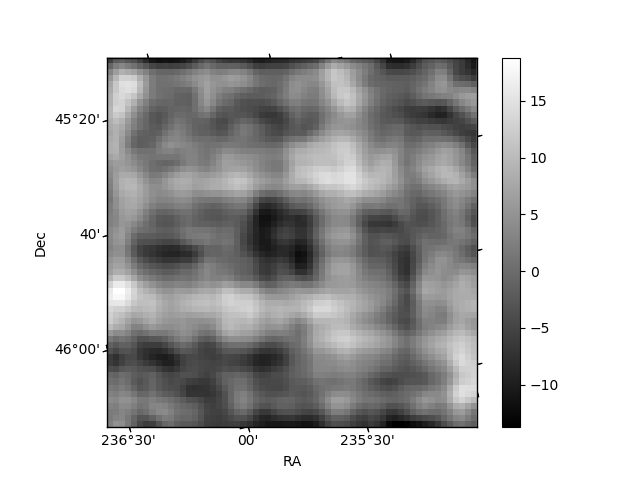
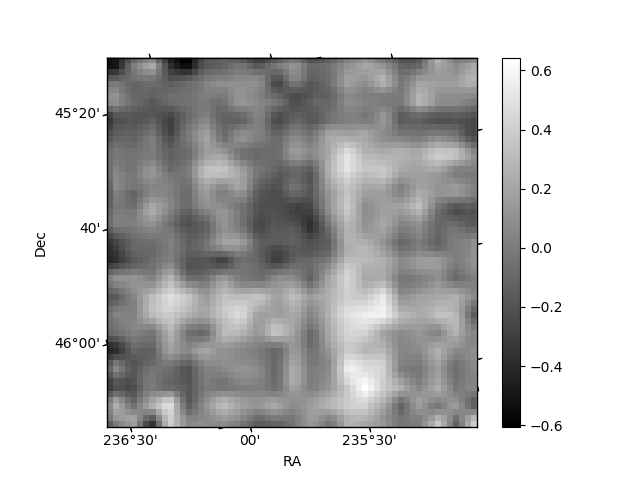
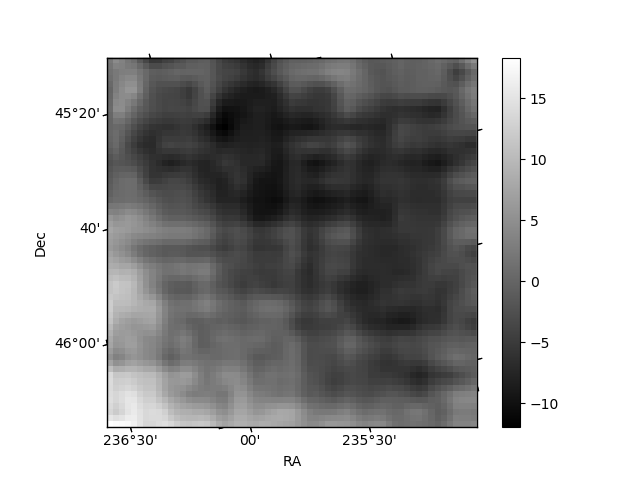
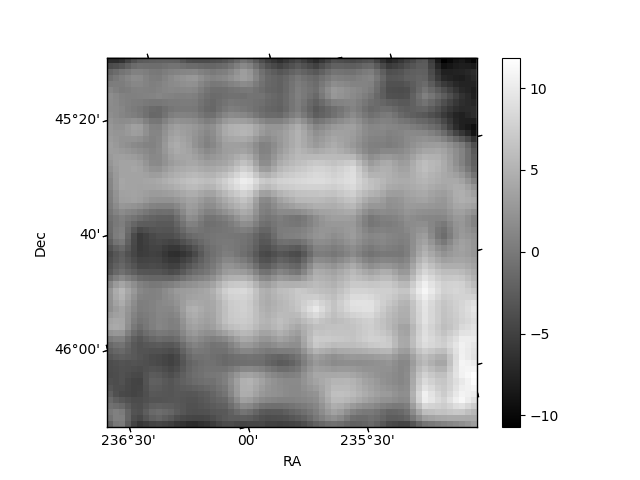
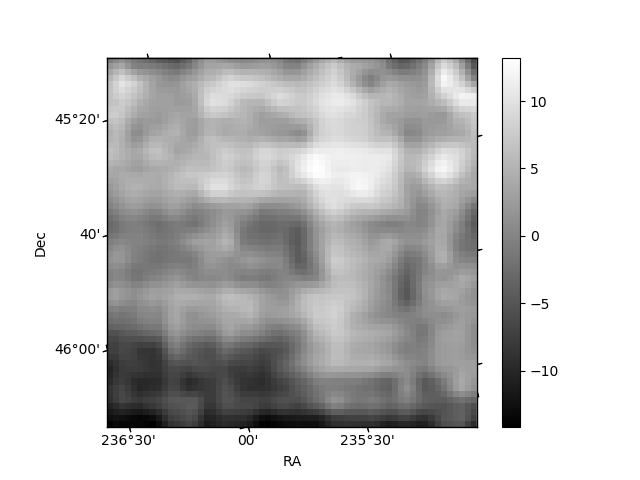
Histogram calculated using DETX and DETY for each event in the final _common_clean file
| Quadrant A | 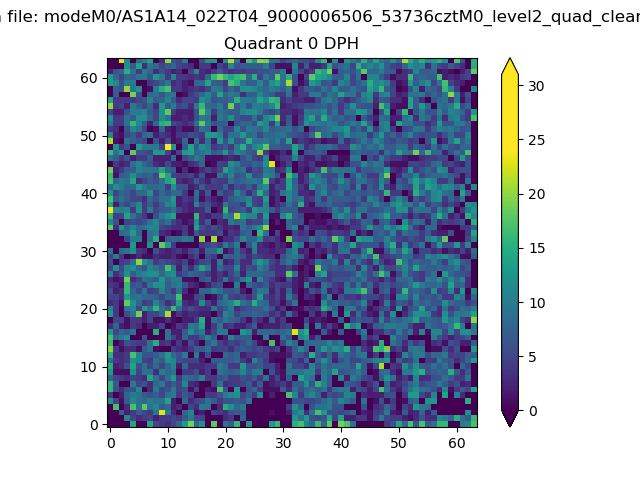 |
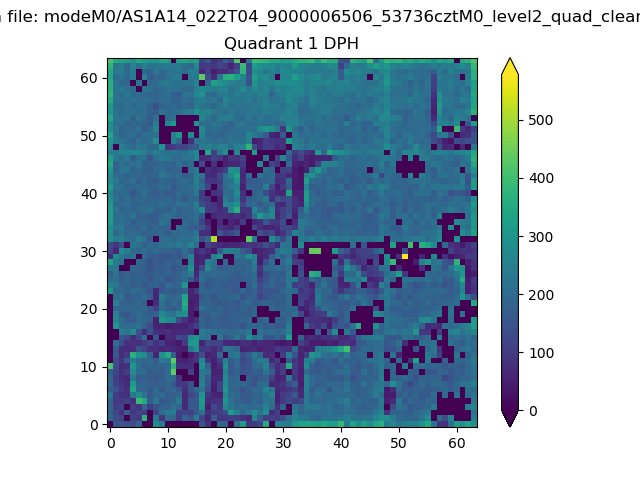 |
Quadrant B |
|---|---|---|---|
| Quadrant D | 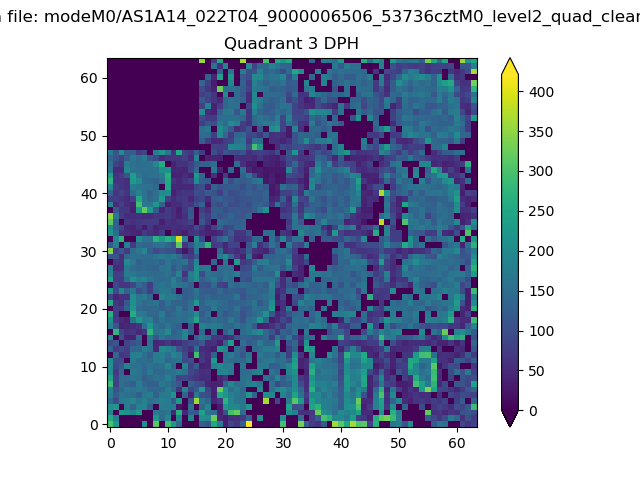 |
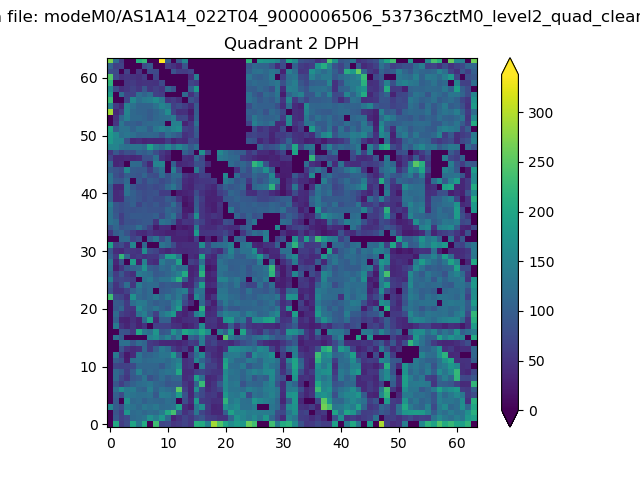 |
Quadrant C |
| Plot type | Count rate plots | Images |
|---|---|---|
| Comparison with Poisson distribution Blue bars denote a histogram of data divided into 1 sec bins. Red curve is a Poisson curve with rate = median count rate of data. |
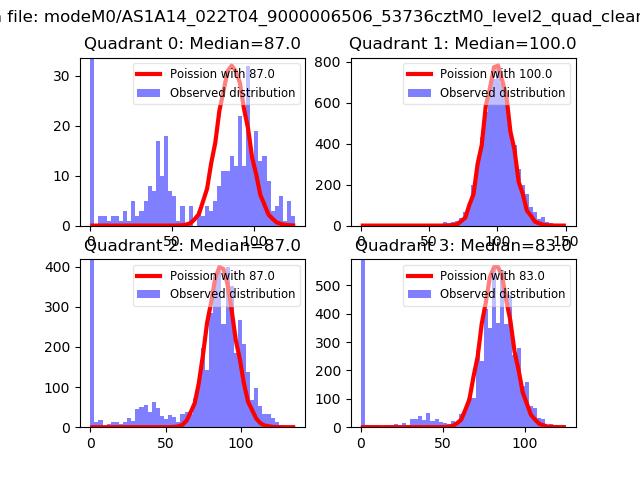 |
 |
| Quadrant-wise count rates Data is divided into 100 sec bins |
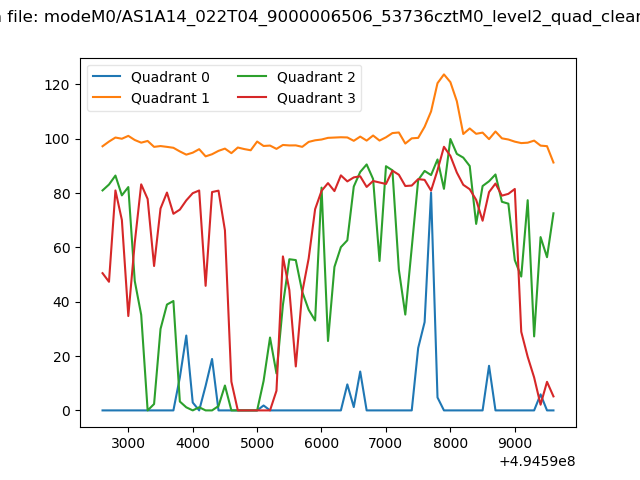 |
|
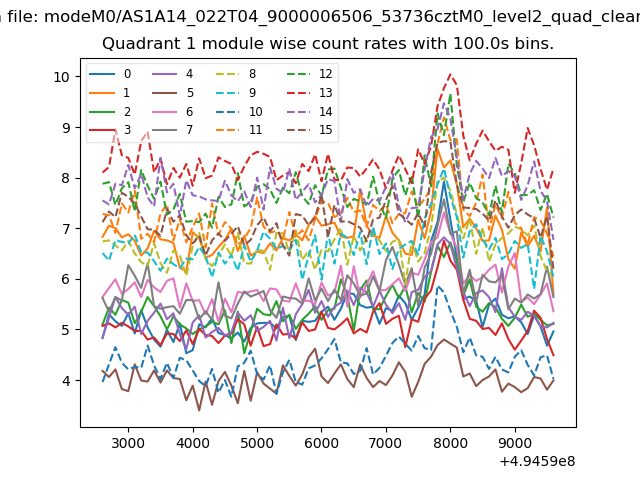
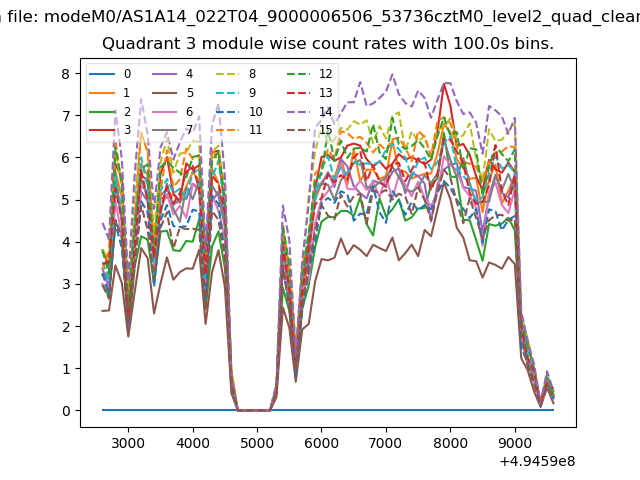
| Module-wise count rates for Quadrant A Data is divided into 100 sec bins |
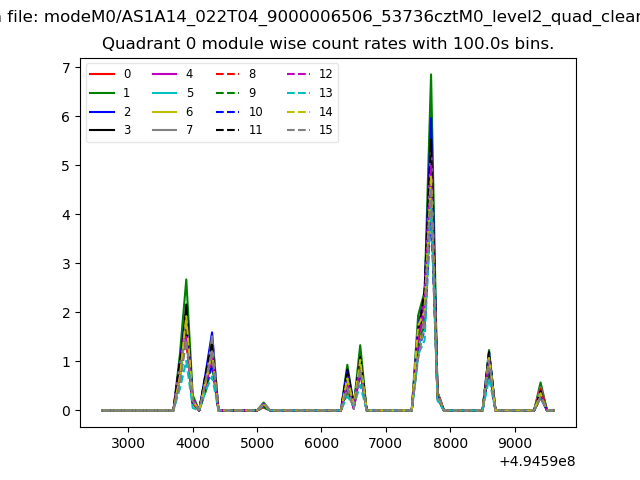 |
 |
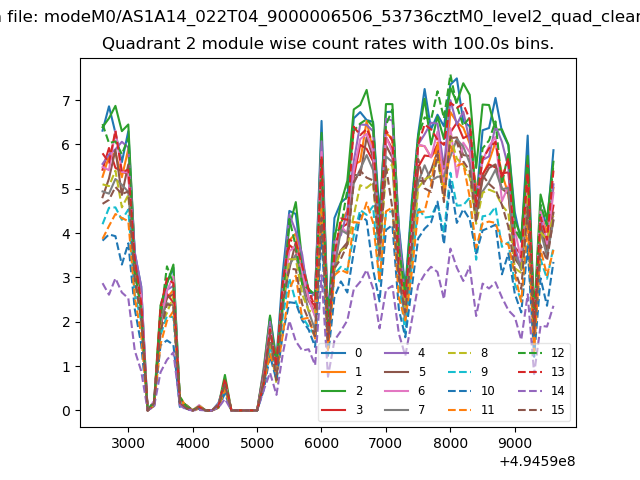
| Module-wise count rates for Quadrant B Data is divided into 100 sec bins |
 |
 |
| Module-wise count rates for Quadrant C Data is divided into 100 sec bins |
 |
 |
| Module-wise count rates for Quadrant D Data is divided into 100 sec bins |
 |
 |
| Parameter | Plot |
|---|---|
| CZT HV Monitor | 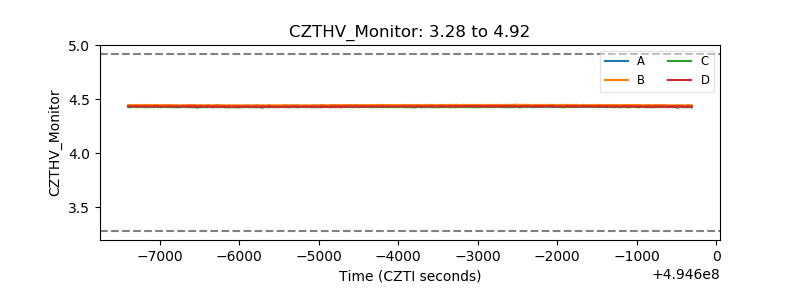 |
| D_VDD | 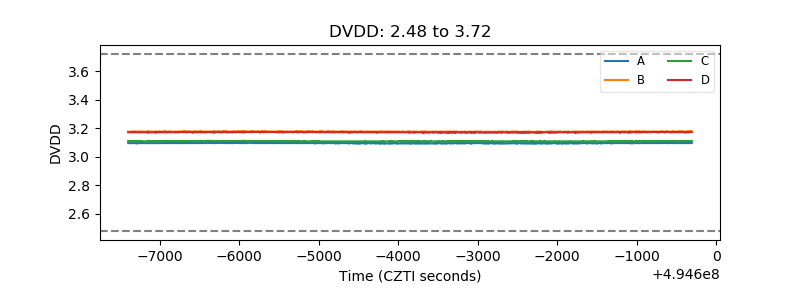 |
| Temperature 1 | 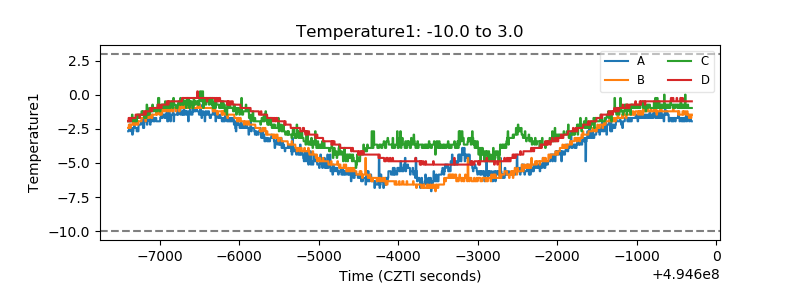 |
| Veto HV Monitor | 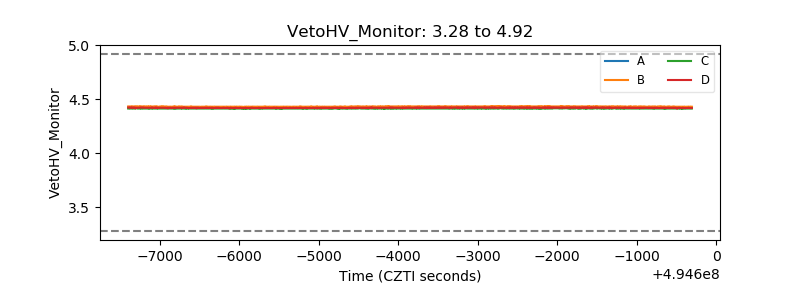 |
| Veto LLD | 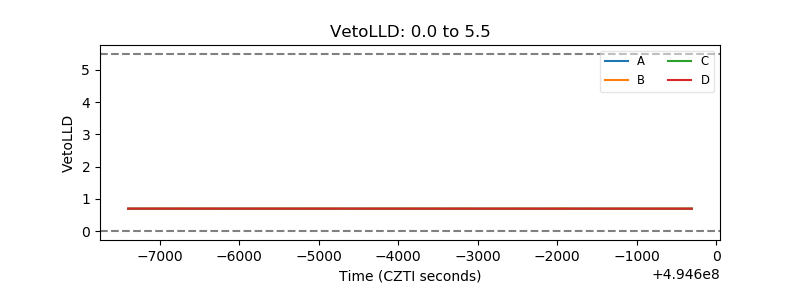 |
| Alpha Counter | 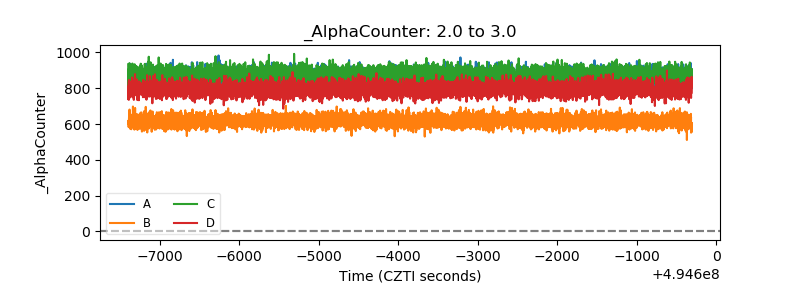 |
| _CPM_Rate | 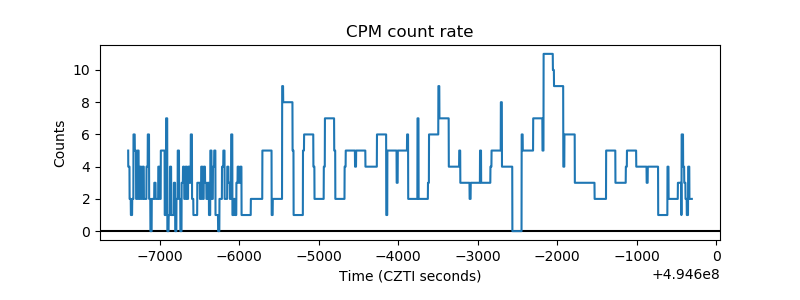 |
| CZT Counter | 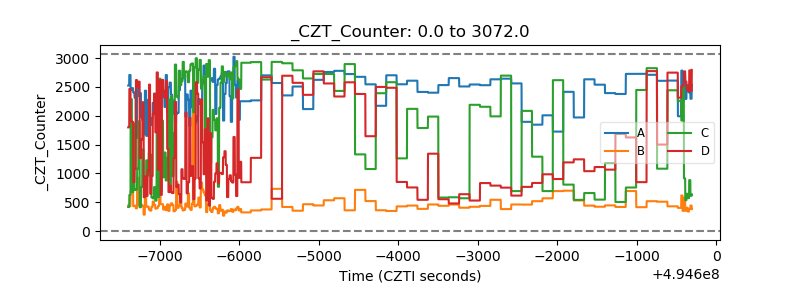 |
| +2.5 Volts monitor |  |
| +5 Volts monitor |  |
| _ROLL_ROT | 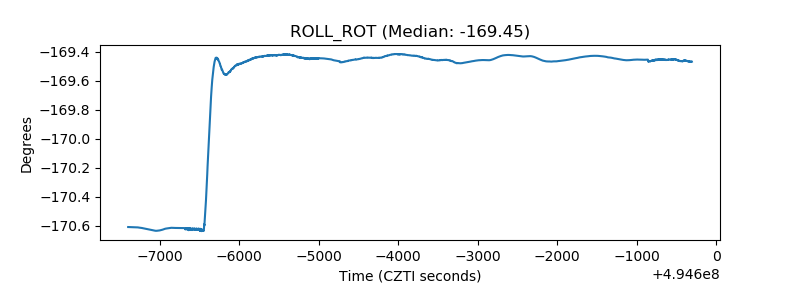 |
| _Roll_DEC | 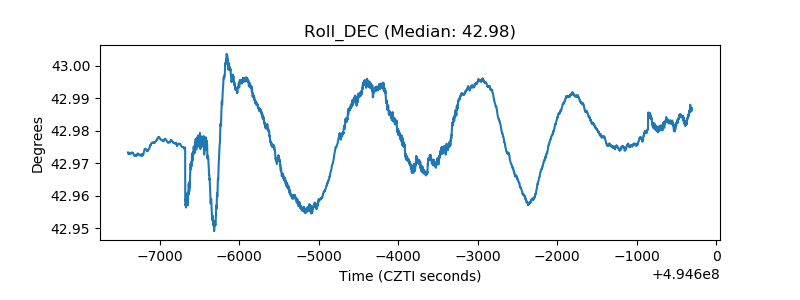 |
| _Roll_RA | 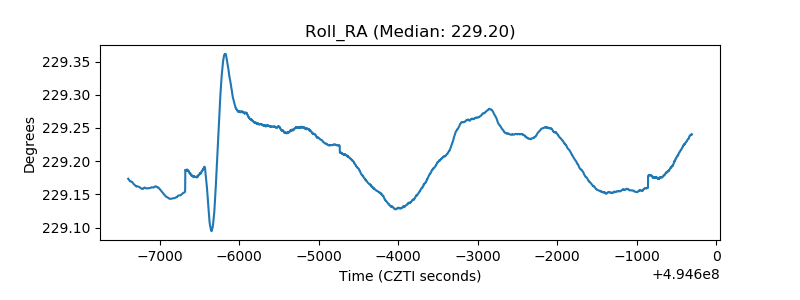 |
| Veto Counter | 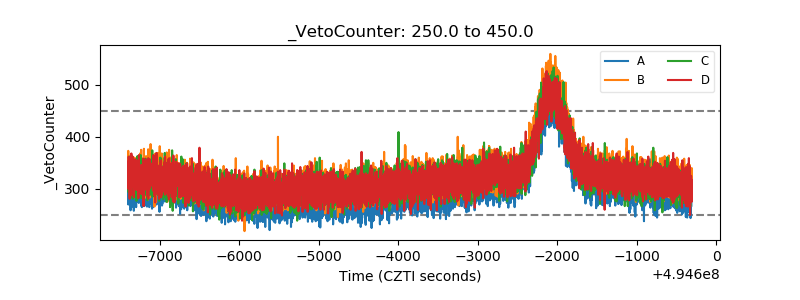 |