| Param | Original file | Final file |
|---|---|---|
| Filename | modeM0/AS1A14_022T04_9000006506_53737cztM0_level2.fits | modeM0/AS1A14_022T04_9000006506_53737cztM0_level2_quad_clean.evt |
| Size (bytes) | 1,138,340,160 | 78,209,280 |
| Size | 1.1 GB | 74.6 MB |
| Events in quadrant A | 16,946,955 | 154,943 |
| Events in quadrant B | 3,848,595 | 728,817 |
| Events in quadrant C | 11,258,140 | 457,745 |
| Events in quadrant D | 9,514,754 | 512,372 |
| Mode M0 | |||
|---|---|---|---|
| Quadrant | BADHDUFLAG | Total packets | Discarded packets |
| A | 0 | 55470 | 0 |
| B | 0 | 16923 | 0 |
| C | 0 | 38603 | 4 |
| D | 0 | 33491 | 0 |
| Mode SS | |||
|---|---|---|---|
| Quadrant | BADHDUFLAG | Total packets | Discarded packets |
| A | 0 | 146 | 0 |
| B | 0 | 146 | 0 |
| C | 0 | 146 | 0 |
| D | 0 | 146 | 0 |
| Quadrant | Total seconds | Saturated seconds | Saturation percentage |
|---|---|---|---|
| A | 7384 | 5876 | 79.577465% |
| B | 7384 | 102 | 1.381365% |
| C | 7383 | 2596 | 35.161858% |
| D | 7384 | 1575 | 21.329902% |
Noise dominated data is calculated using 1-second bins in cleaned event files. If a bin has >2000 counts, and if more than 50% of those come from <1% of pixels, then it is considered to be noise-dominated and hence unusable.
| Quadrant | # 1 sec bins | Bins with >0 counts | Bins with >2000 counts | High rate bins dominated by noise | Noise dominated (total time) | Noise dominated (detector-on time) | Marked lightcurve |
|---|---|---|---|---|---|---|---|
| A | 7384 | 7384 | 5591 | 5591 | 75.72% | 75.72% | 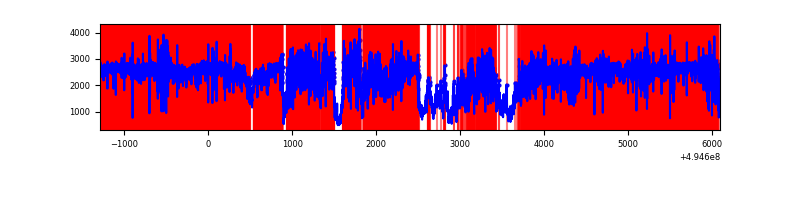 |
| B | 7384 | 7384 | 57 | 57 | 0.77% | 0.77% | 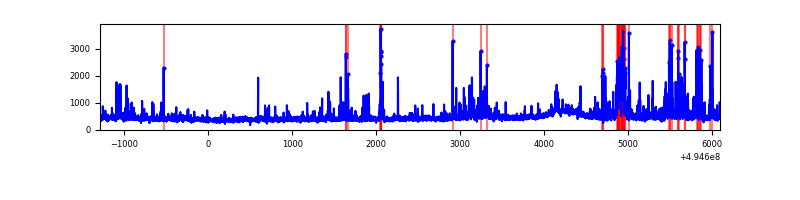 |
| C | 7384 | 7384 | 2216 | 2216 | 30.01% | 30.01% | 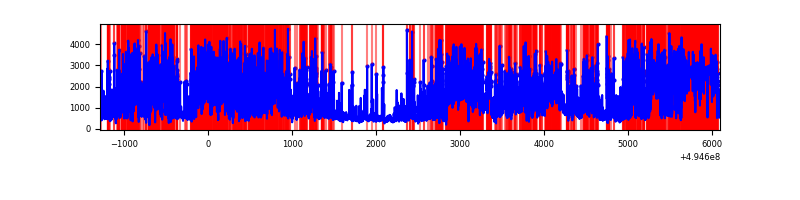 |
| D | 7384 | 7384 | 1469 | 1469 | 19.89% | 19.89% | 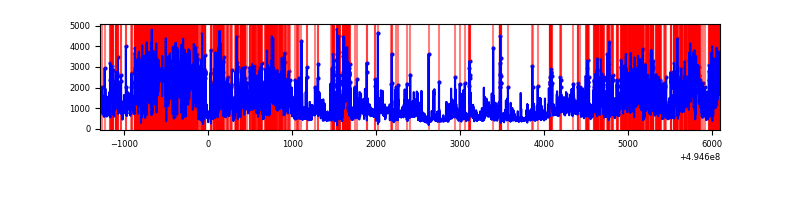 |
Top three noisy pixels from each quadrant. If the there are fewer than three noisy pixels in the level2.evt file, extra rows are filled as -1
| Pixel properties | Quadrant properties | ||||||
|---|---|---|---|---|---|---|---|
| Quadrant | DetID | PixID | Counts | Sigma | Mean | Median | Sigma |
| A | 3 | 63 | 13732303 | 140335.45 | 392 | 381 | 97.9 |
| A | 3 | 78 | 1310752 | 13391.53 | 392 | 381 | 97.9 |
| A | 3 | 30 | 80117 | 814.87 | 392 | 381 | 97.9 |
| B | 12 | 3 | 208163 | 1285.6 | 754 | 729 | 161.4 |
| B | 3 | 233 | 139941 | 862.79 | 754 | 729 | 161.4 |
| B | 5 | 185 | 118048 | 727.1 | 754 | 729 | 161.4 |
| C | 15 | 224 | 3886398 | 22381.4 | 630 | 625 | 173.6 |
| C | 1 | 241 | 1315636 | 7574.24 | 630 | 625 | 173.6 |
| C | 6 | 13 | 1249746 | 7194.73 | 630 | 625 | 173.6 |
| D | 1 | 241 | 2689954 | 13896.17 | 679 | 649 | 193.5 |
| D | 2 | 172 | 1509654 | 7797.33 | 679 | 649 | 193.5 |
| D | 2 | 153 | 1054997 | 5448.02 | 679 | 649 | 193.5 |
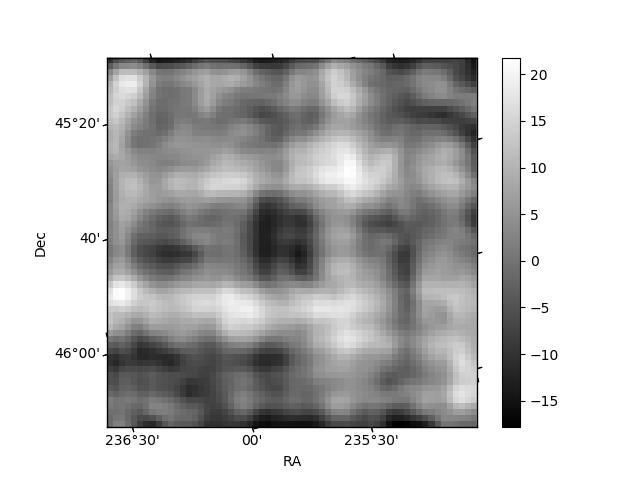
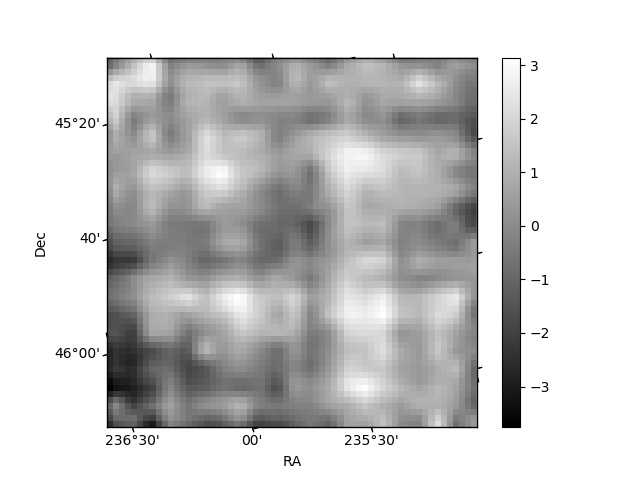
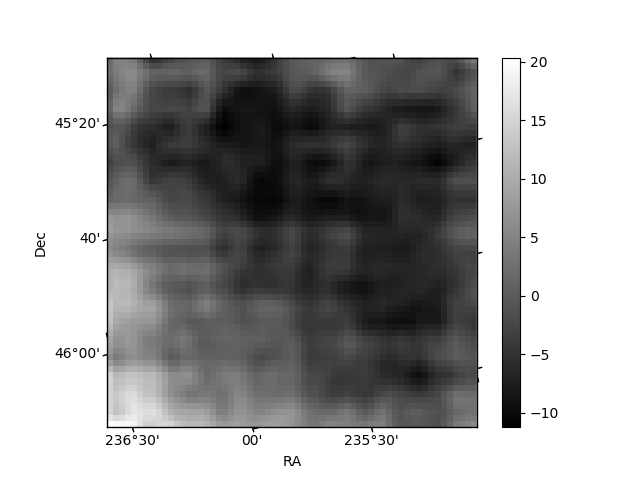
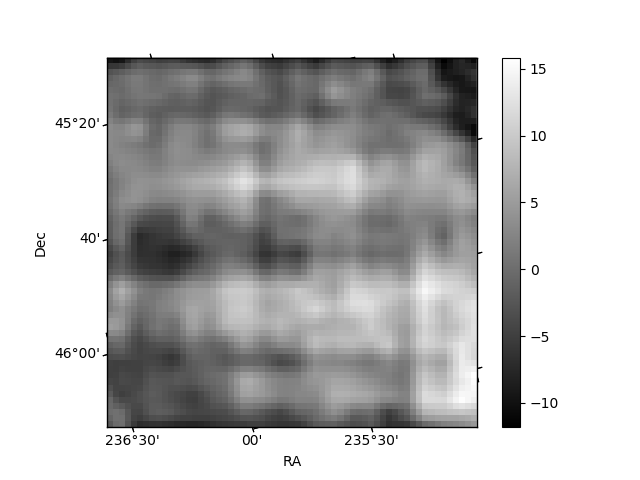
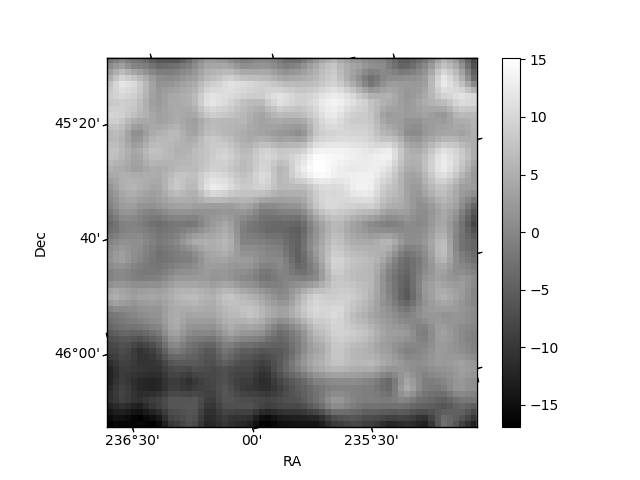
Histogram calculated using DETX and DETY for each event in the final _common_clean file
| Quadrant A | 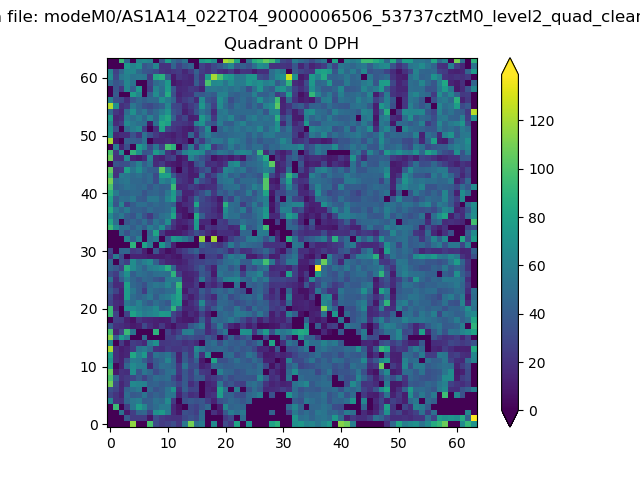 |
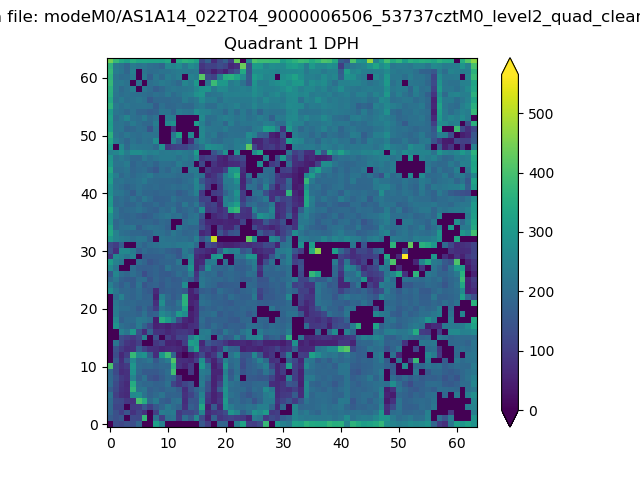 |
Quadrant B |
|---|---|---|---|
| Quadrant D | 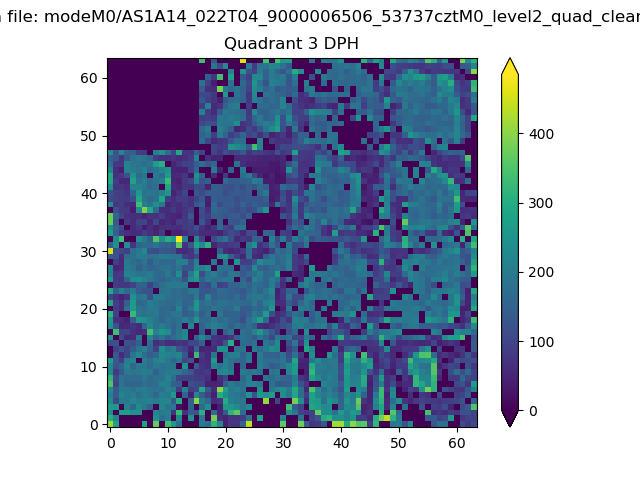 |
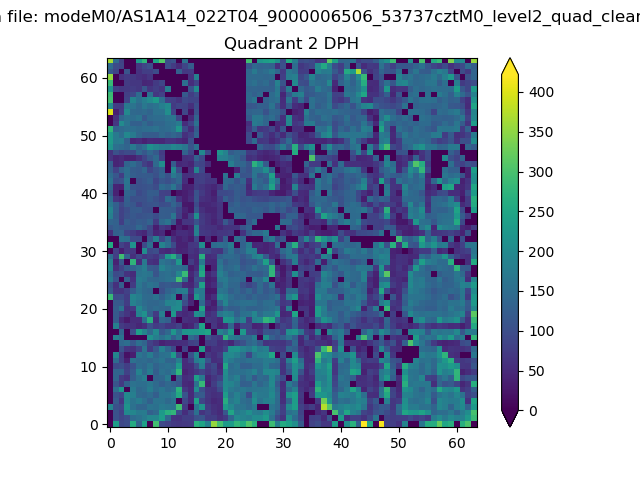 |
Quadrant C |
| Plot type | Count rate plots | Images |
|---|---|---|
| Comparison with Poisson distribution Blue bars denote a histogram of data divided into 1 sec bins. Red curve is a Poisson curve with rate = median count rate of data. |
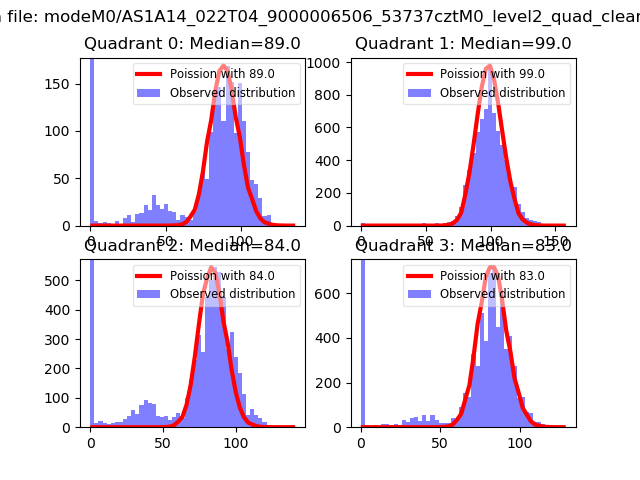 |
 |
| Quadrant-wise count rates Data is divided into 100 sec bins |
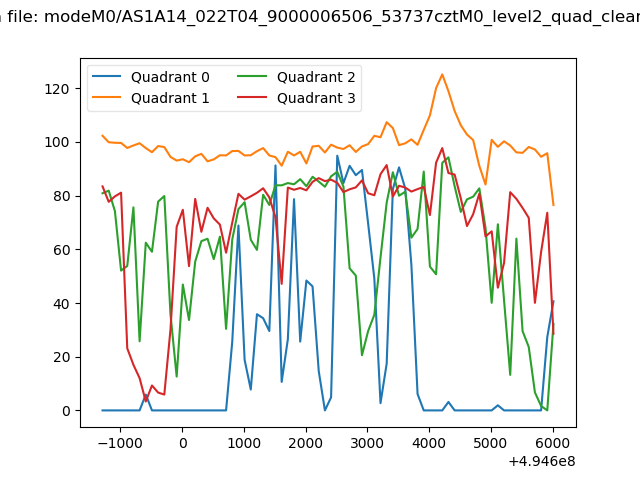 |
|
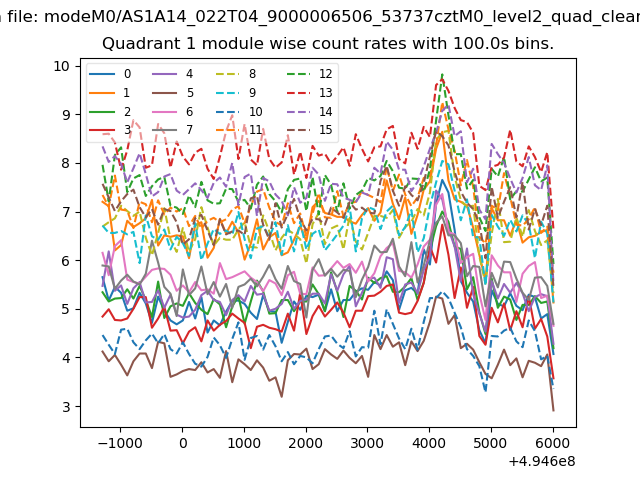
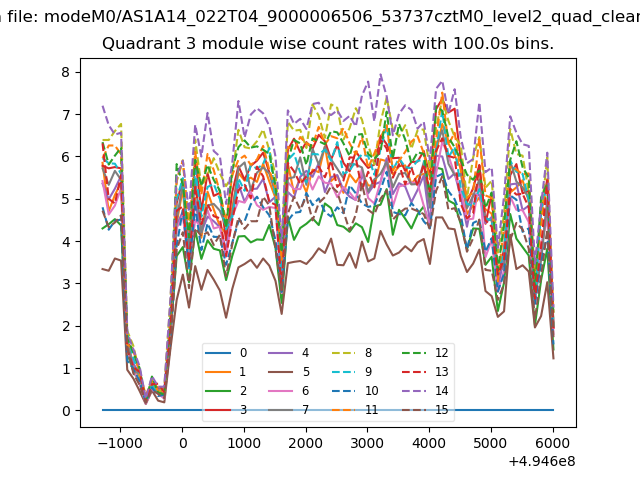
| Module-wise count rates for Quadrant A Data is divided into 100 sec bins |
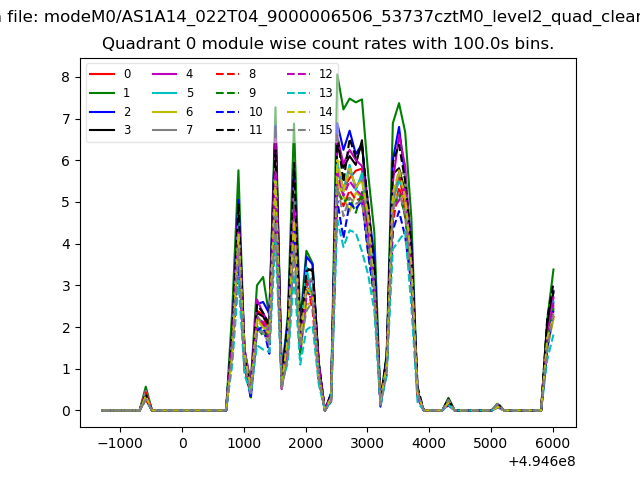 |
 |
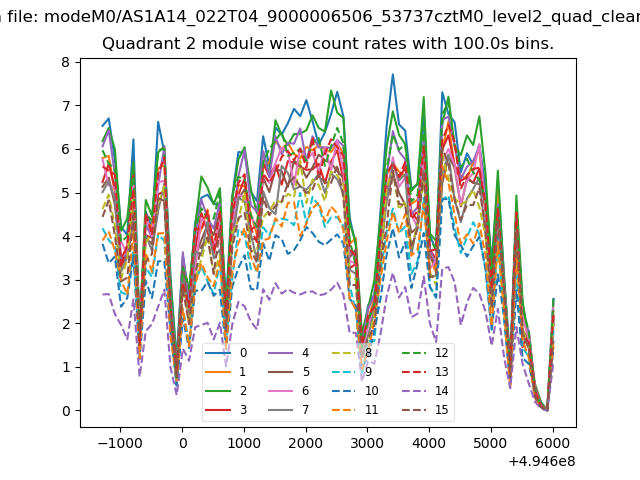
| Module-wise count rates for Quadrant B Data is divided into 100 sec bins |
 |
 |
| Module-wise count rates for Quadrant C Data is divided into 100 sec bins |
 |
 |
| Module-wise count rates for Quadrant D Data is divided into 100 sec bins |
 |
 |
| Parameter | Plot |
|---|---|
| CZT HV Monitor | 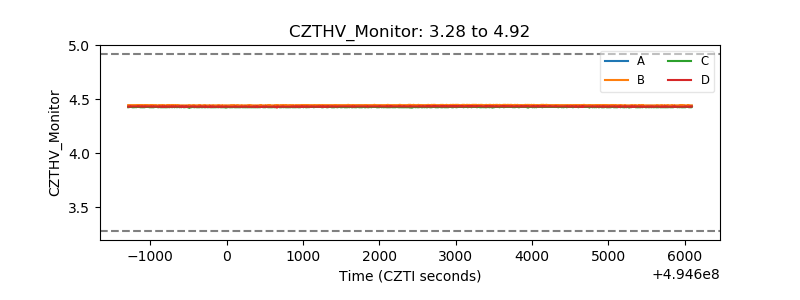 |
| D_VDD | 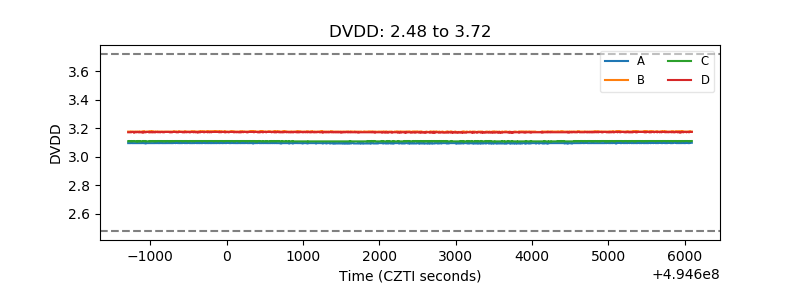 |
| Temperature 1 | 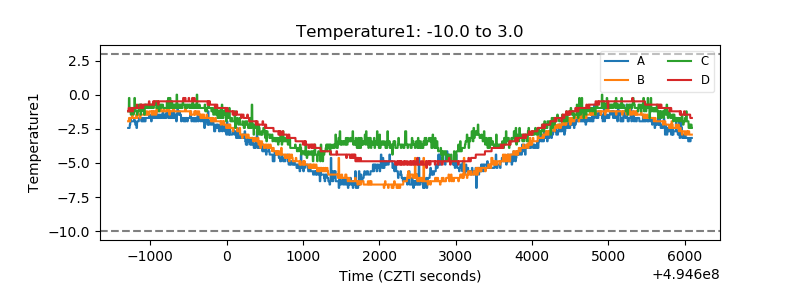 |
| Veto HV Monitor | 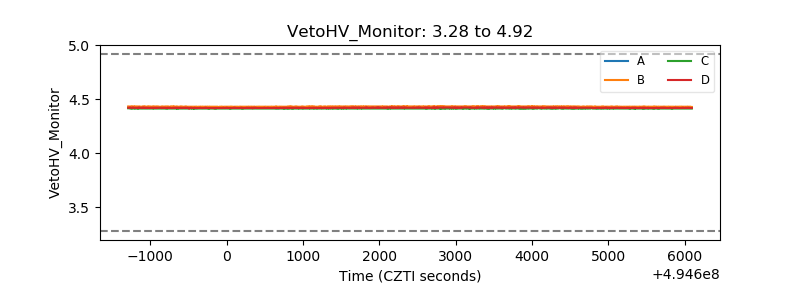 |
| Veto LLD | 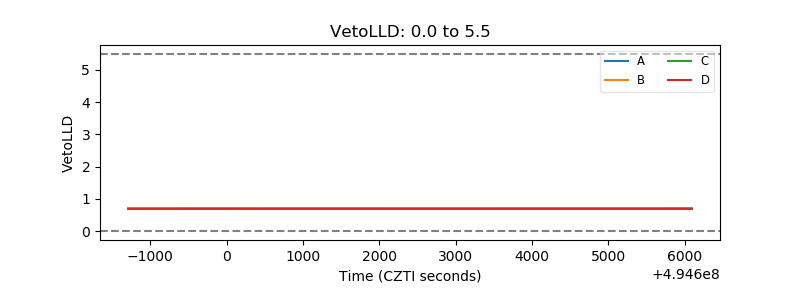 |
| Alpha Counter | 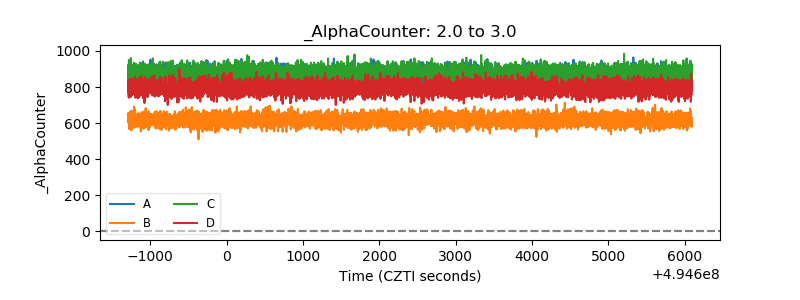 |
| _CPM_Rate | 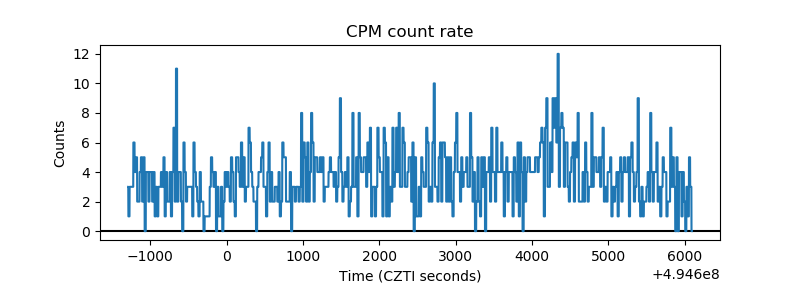 |
| CZT Counter | 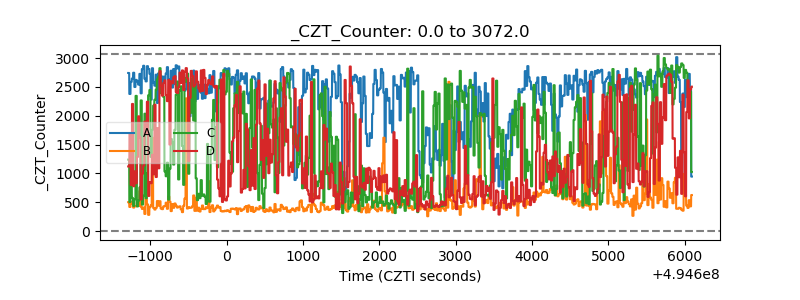 |
| +2.5 Volts monitor |  |
| +5 Volts monitor |  |
| _ROLL_ROT | 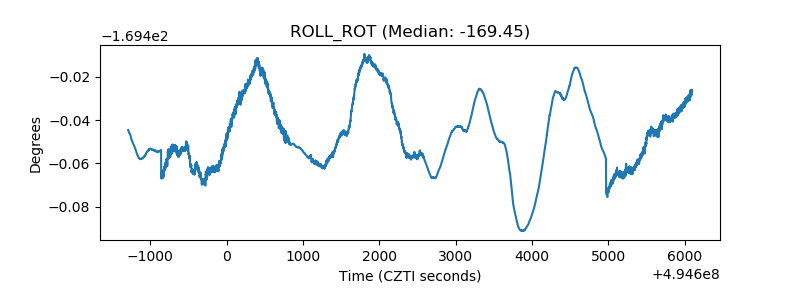 |
| _Roll_DEC | 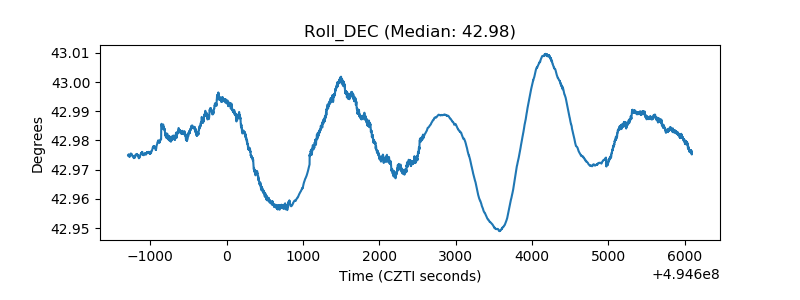 |
| _Roll_RA | 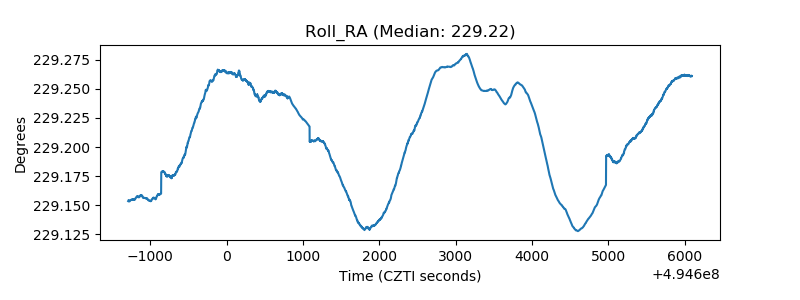 |
| Veto Counter | 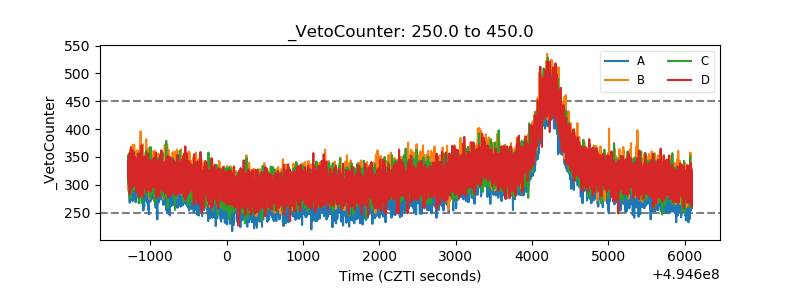 |