| Param | Original file | Final file |
|---|---|---|
| Filename | modeM0/AS1A14_022T04_9000006506_53740cztM0_level2.fits | modeM0/AS1A14_022T04_9000006506_53740cztM0_level2_quad_clean.evt |
| Size (bytes) | 1,792,828,800 | 98,720,640 |
| Size | 1.7 GB | 94.1 MB |
| Events in quadrant A | 25,533,860 | 152,958 |
| Events in quadrant B | 5,117,824 | 1,026,916 |
| Events in quadrant C | 22,401,838 | 344,315 |
| Events in quadrant D | 12,502,553 | 735,344 |
| Mode M0 | |||
|---|---|---|---|
| Quadrant | BADHDUFLAG | Total packets | Discarded packets |
| A | 0 | 83134 | 16 |
| B | 0 | 23112 | 1 |
| C | 0 | 73648 | 1 |
| D | 0 | 44428 | 1 |
| Mode SS | |||
|---|---|---|---|
| Quadrant | BADHDUFLAG | Total packets | Discarded packets |
| A | 0 | 212 | 0 |
| B | 0 | 212 | 0 |
| C | 0 | 212 | 0 |
| D | 0 | 212 | 0 |
| Quadrant | Total seconds | Saturated seconds | Saturation percentage |
|---|---|---|---|
| A | 10518 | 9068 | 86.214109% |
| B | 10520 | 136 | 1.292776% |
| C | 10520 | 6939 | 65.960076% |
| D | 10520 | 1989 | 18.906844% |
Noise dominated data is calculated using 1-second bins in cleaned event files. If a bin has >2000 counts, and if more than 50% of those come from <1% of pixels, then it is considered to be noise-dominated and hence unusable.
| Quadrant | # 1 sec bins | Bins with >0 counts | Bins with >2000 counts | High rate bins dominated by noise | Noise dominated (total time) | Noise dominated (detector-on time) | Marked lightcurve |
|---|---|---|---|---|---|---|---|
| A | 10553 | 10517 | 8606 | 8606 | 81.55% | 81.83% | 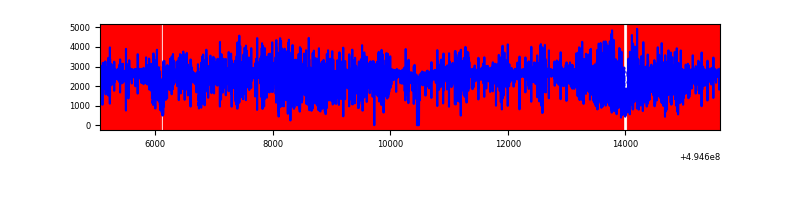 |
| B | 10555 | 10521 | 45 | 45 | 0.43% | 0.43% | 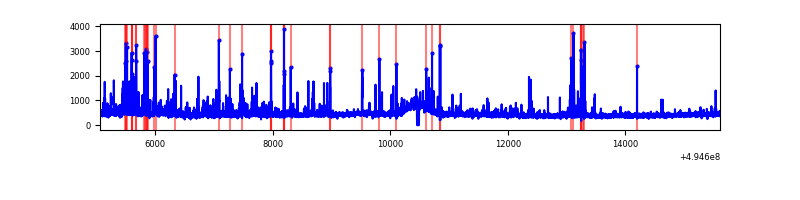 |
| C | 10555 | 10520 | 6495 | 6495 | 61.53% | 61.74% | 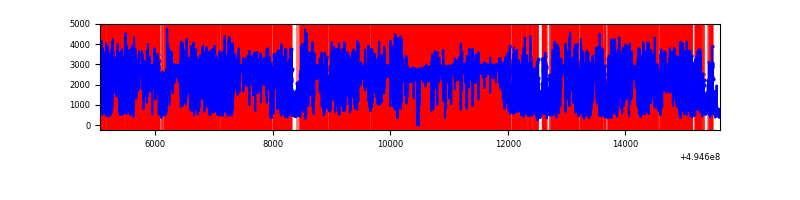 |
| D | 10555 | 10521 | 1760 | 1760 | 16.67% | 16.73% | 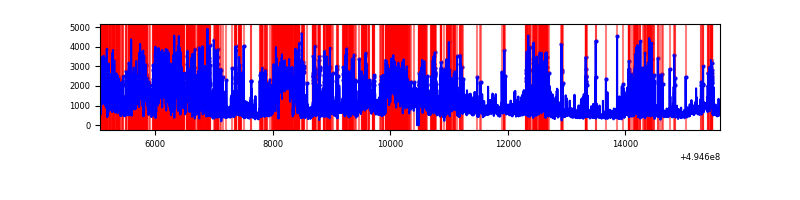 |
Top three noisy pixels from each quadrant. If the there are fewer than three noisy pixels in the level2.evt file, extra rows are filled as -1
| Pixel properties | Quadrant properties | ||||||
|---|---|---|---|---|---|---|---|
| Quadrant | DetID | PixID | Counts | Sigma | Mean | Median | Sigma |
| A | 3 | 63 | 13347465 | 98414.75 | 534 | 521 | 135.6 |
| A | 3 | 78 | 9615341 | 70895.64 | 534 | 521 | 135.6 |
| A | 5 | 241 | 180123 | 1324.31 | 534 | 521 | 135.6 |
| B | 12 | 3 | 194470 | 843.01 | 1069 | 1031 | 229.5 |
| B | 0 | 213 | 161717 | 700.28 | 1069 | 1031 | 229.5 |
| B | 5 | 185 | 116187 | 501.85 | 1069 | 1031 | 229.5 |
| C | 1 | 241 | 12836659 | 72309.19 | 639 | 632 | 177.5 |
| C | 15 | 224 | 5063257 | 28519.29 | 639 | 632 | 177.5 |
| C | 3 | 242 | 505568 | 2844.46 | 639 | 632 | 177.5 |
| D | 2 | 172 | 2378642 | 8514.26 | 983 | 942 | 279.3 |
| D | 2 | 153 | 2269171 | 8122.26 | 983 | 942 | 279.3 |
| D | 1 | 241 | 1133606 | 4055.93 | 983 | 942 | 279.3 |
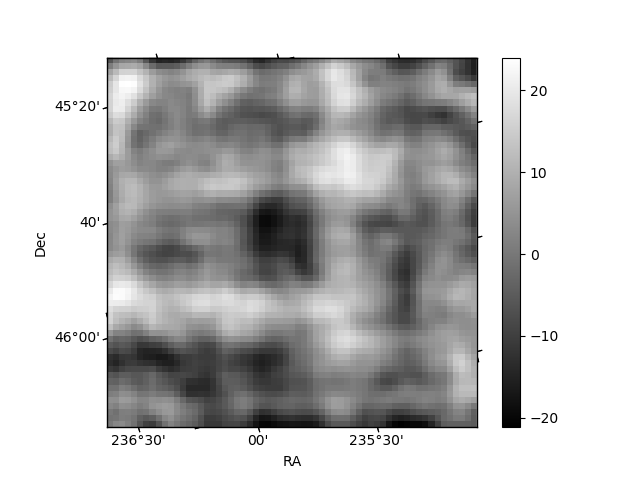
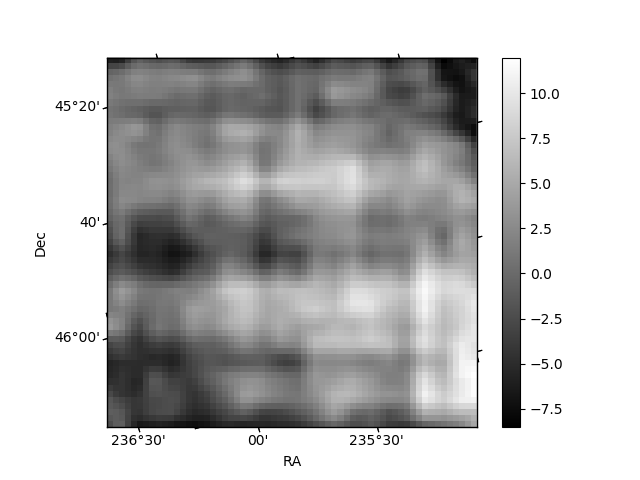
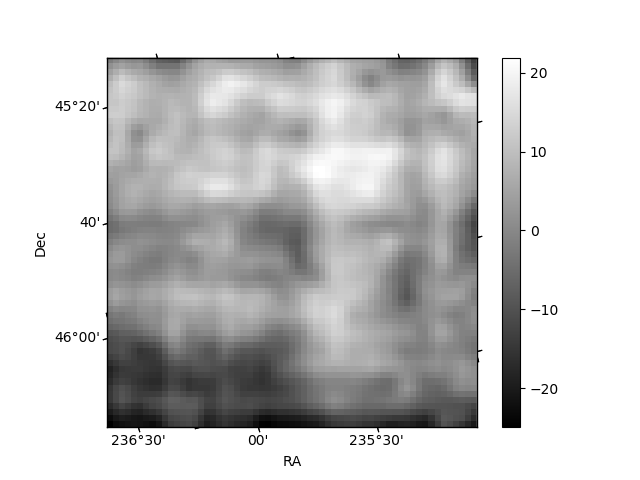
Histogram calculated using DETX and DETY for each event in the final _common_clean file
| Quadrant A | 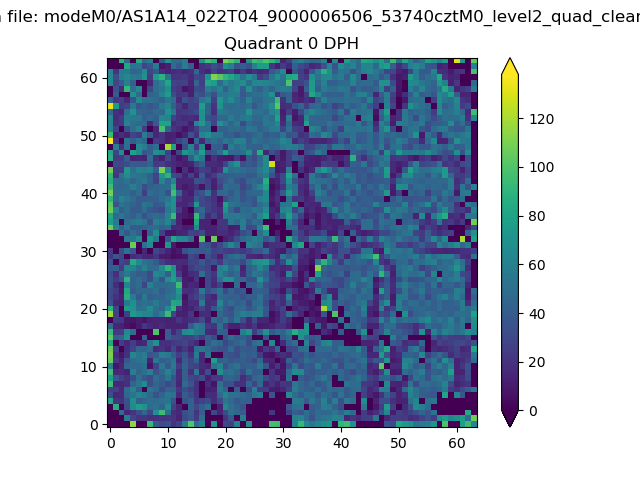 |
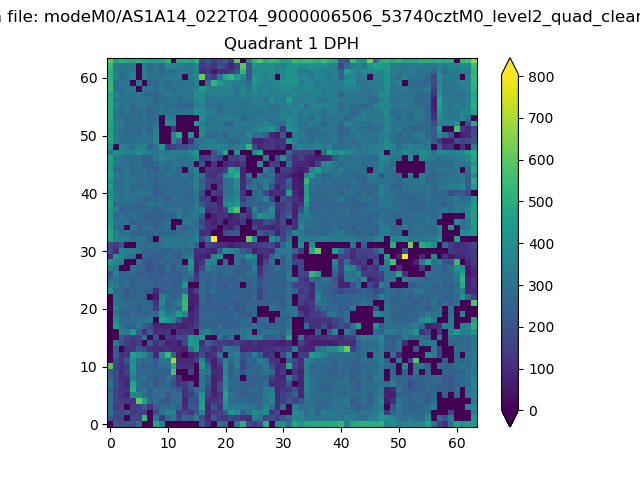 |
Quadrant B |
|---|---|---|---|
| Quadrant D | 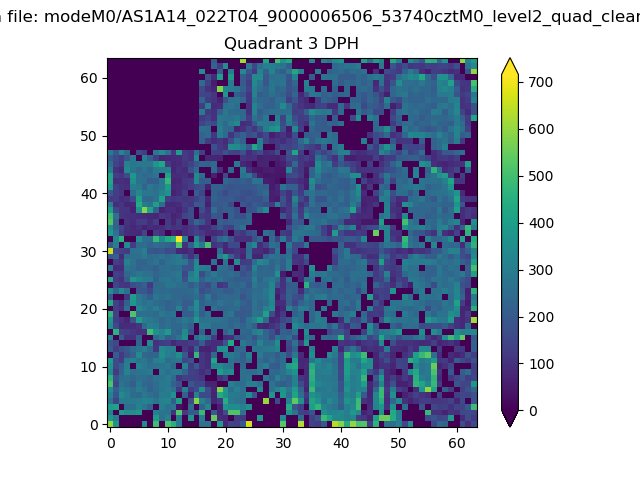 |
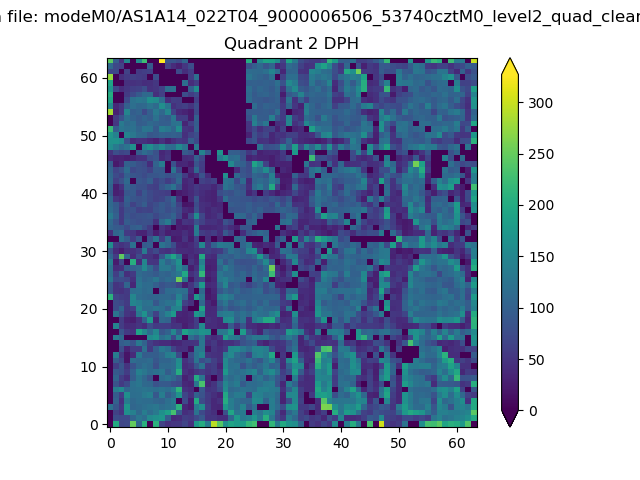 |
Quadrant C |
| Plot type | Count rate plots | Images |
|---|---|---|
| Comparison with Poisson distribution Blue bars denote a histogram of data divided into 1 sec bins. Red curve is a Poisson curve with rate = median count rate of data. |
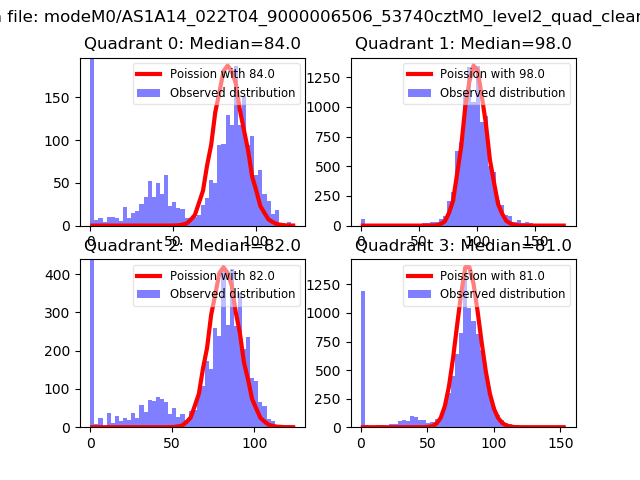 |
 |
| Quadrant-wise count rates Data is divided into 100 sec bins |
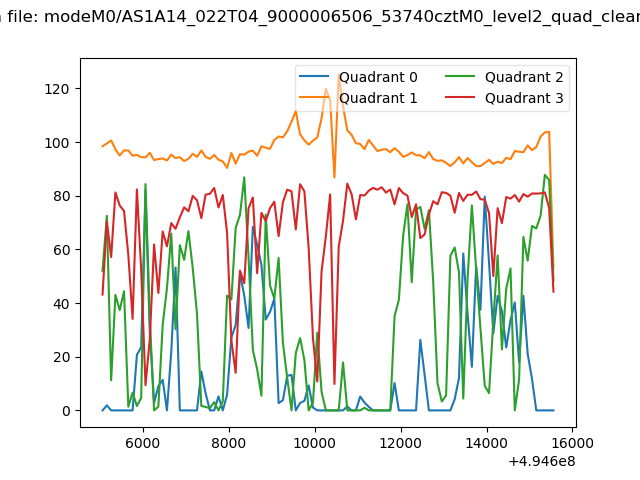 |
|
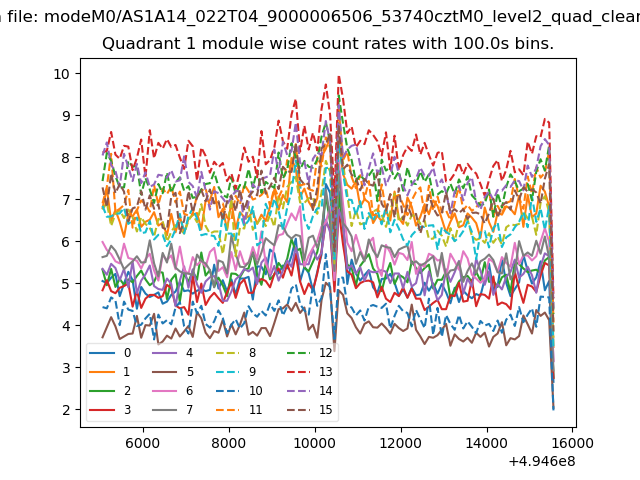
| Module-wise count rates for Quadrant A Data is divided into 100 sec bins |
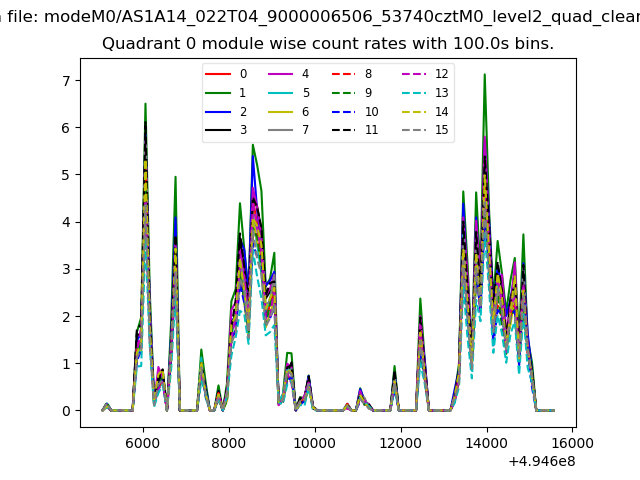 |
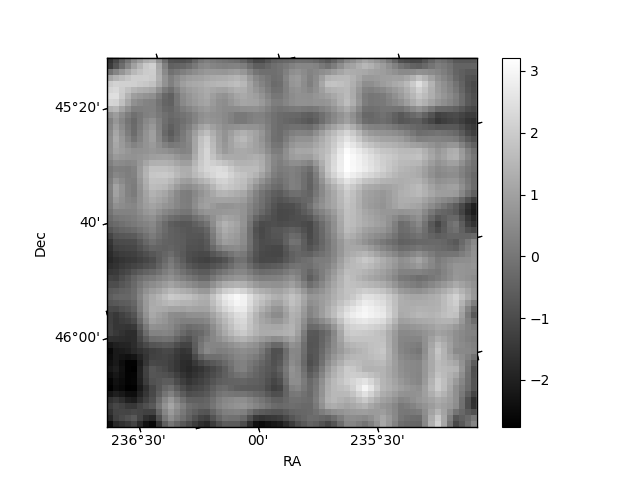 |
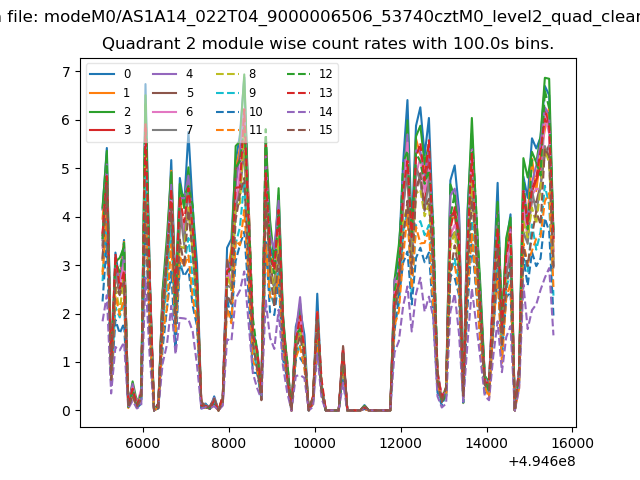
| Module-wise count rates for Quadrant B Data is divided into 100 sec bins |
 |
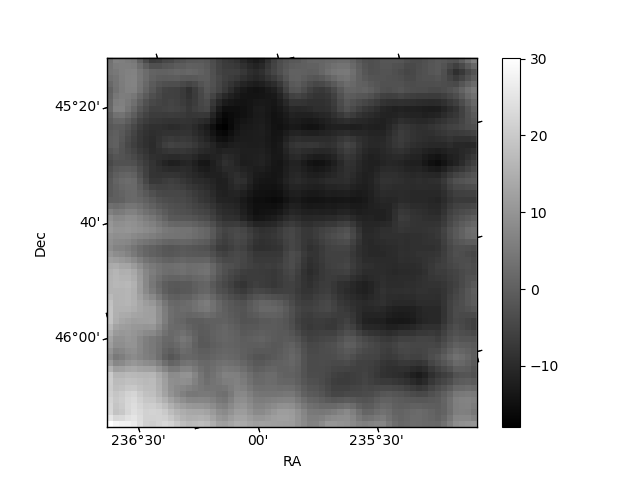 |
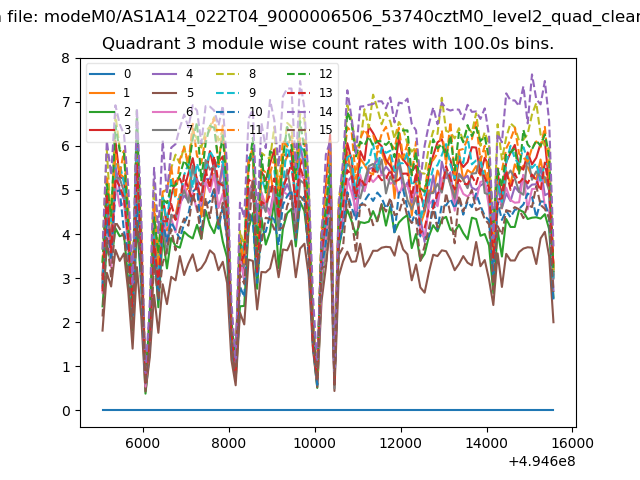
| Module-wise count rates for Quadrant C Data is divided into 100 sec bins |
 |
 |
| Module-wise count rates for Quadrant D Data is divided into 100 sec bins |
 |
 |
| Parameter | Plot |
|---|---|
| CZT HV Monitor | 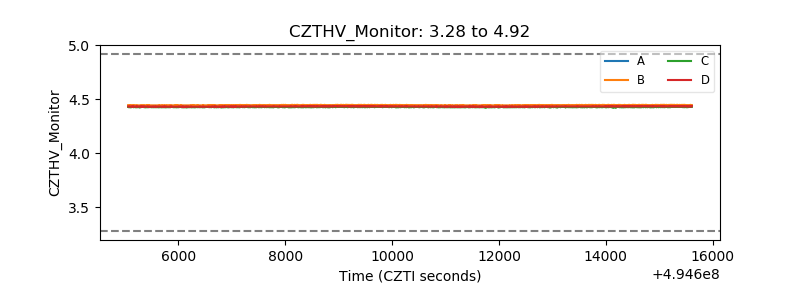 |
| D_VDD | 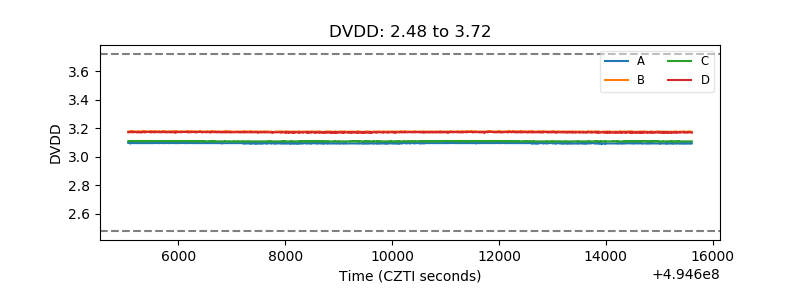 |
| Temperature 1 | 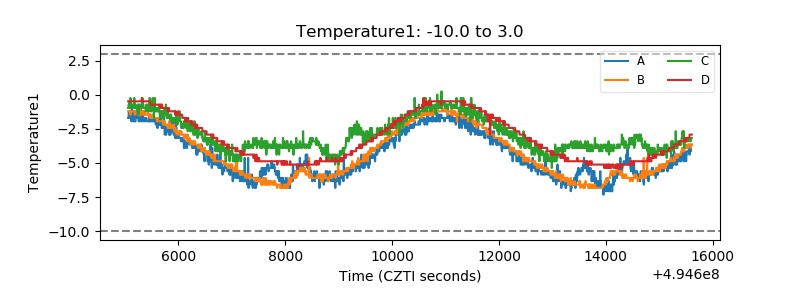 |
| Veto HV Monitor | 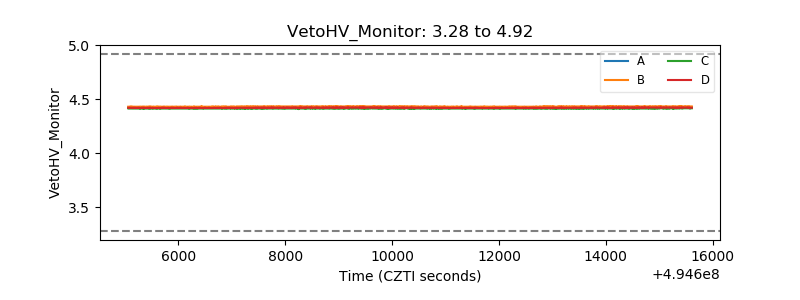 |
| Veto LLD | 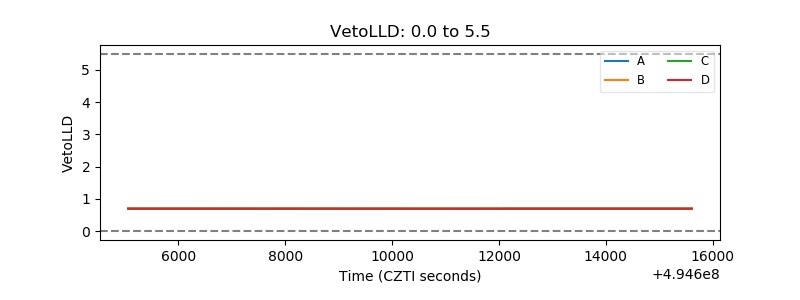 |
| Alpha Counter | 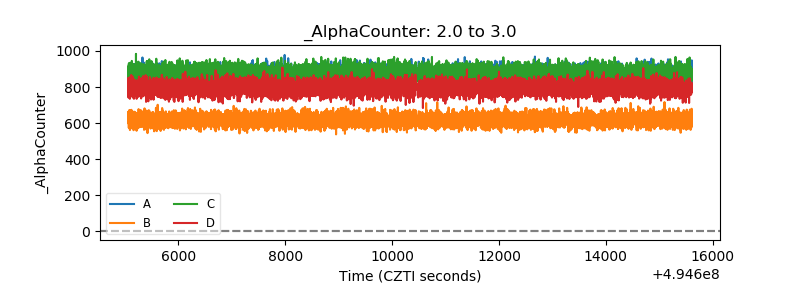 |
| _CPM_Rate | 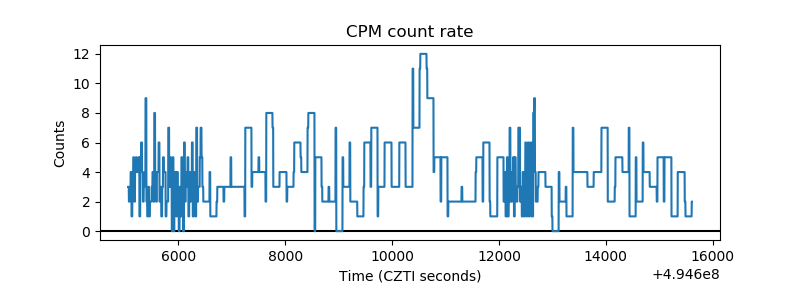 |
| CZT Counter | 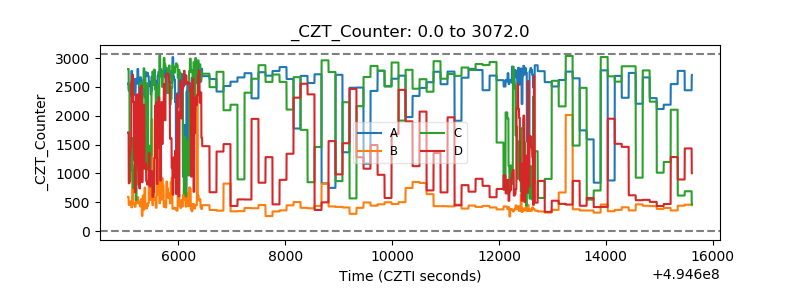 |
| +2.5 Volts monitor | 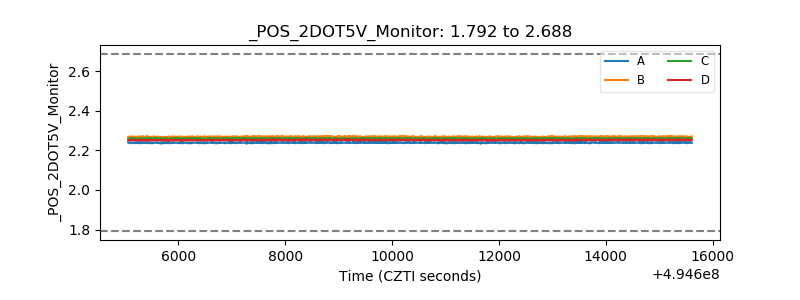 |
| +5 Volts monitor | 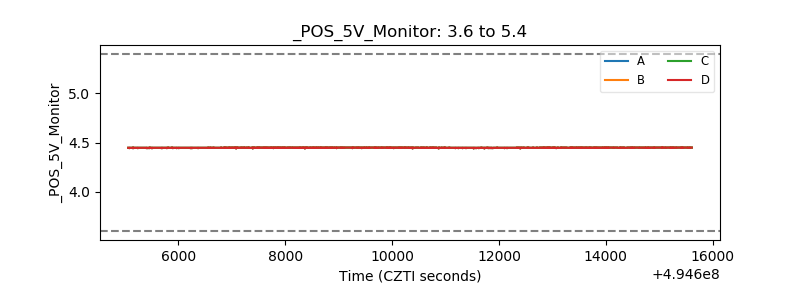 |
| _ROLL_ROT | 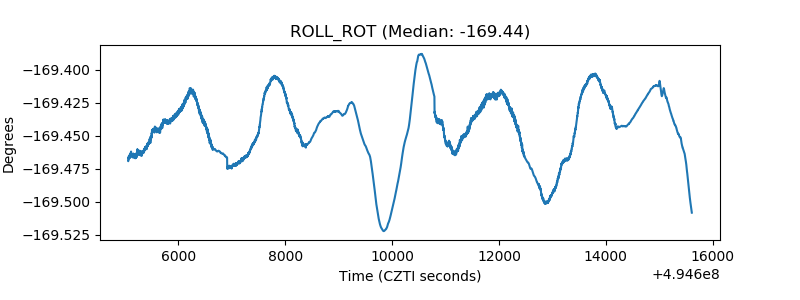 |
| _Roll_DEC | 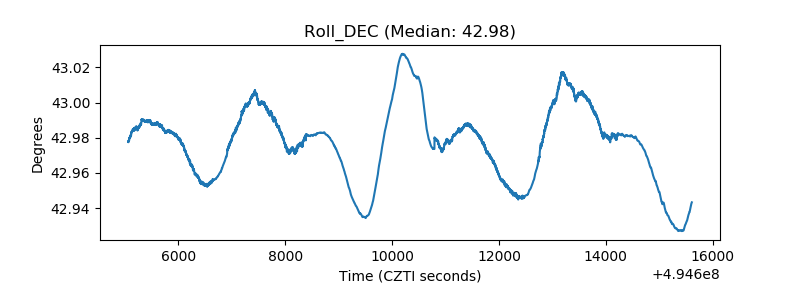 |
| _Roll_RA | 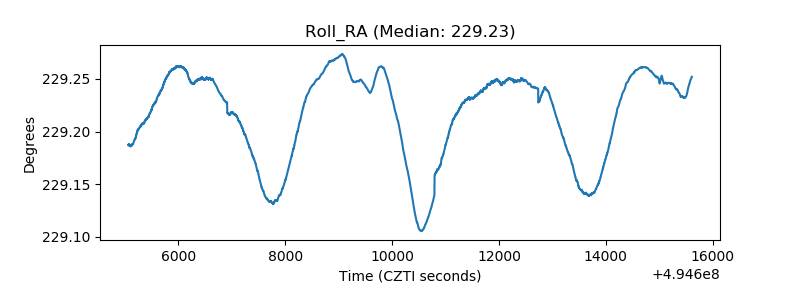 |
| Veto Counter | 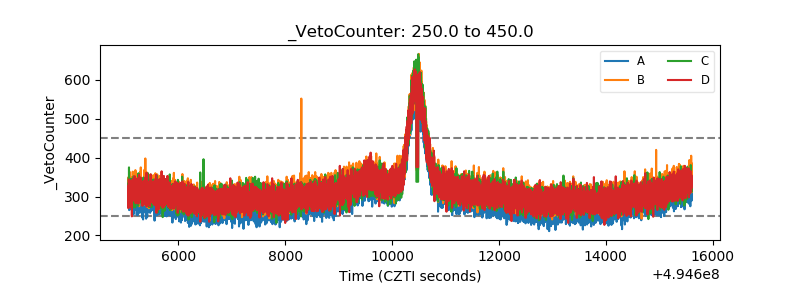 |