| Param | Original file | Final file |
|---|---|---|
| Filename | modeM0/AS1A14_022T04_9000006506_53741cztM0_level2.fits | modeM0/AS1A14_022T04_9000006506_53741cztM0_level2_quad_clean.evt |
| Size (bytes) | 2,215,402,560 | 135,069,120 |
| Size | 2.1 GB | 128.8 MB |
| Events in quadrant A | 35,894,277 | 71,284 |
| Events in quadrant B | 6,394,778 | 1,369,265 |
| Events in quadrant C | 26,500,902 | 592,119 |
| Events in quadrant D | 12,138,111 | 1,088,628 |
| Mode M0 | |||
|---|---|---|---|
| Quadrant | BADHDUFLAG | Total packets | Discarded packets |
| A | 0 | 116339 | 3 |
| B | 0 | 29686 | 3 |
| C | 0 | 88322 | 3 |
| D | 0 | 46123 | 4 |
| Mode SS | |||
|---|---|---|---|
| Quadrant | BADHDUFLAG | Total packets | Discarded packets |
| A | 0 | 284 | 0 |
| B | 0 | 284 | 0 |
| C | 0 | 284 | 0 |
| D | 0 | 284 | 0 |
| Mode M9 | |||
|---|---|---|---|
| Quadrant | BADHDUFLAG | Total packets | Discarded packets |
| A | 0 | 19 | 0 |
| B | 0 | 19 | 0 |
| C | 0 | 19 | 0 |
| D | 0 | 19 | 0 |
| Quadrant | Total seconds | Saturated seconds | Saturation percentage |
|---|---|---|---|
| A | 14016 | 13382 | 95.476598% |
| B | 14017 | 114 | 0.813298% |
| C | 14017 | 7762 | 55.375615% |
| D | 14016 | 1283 | 9.153824% |
Noise dominated data is calculated using 1-second bins in cleaned event files. If a bin has >2000 counts, and if more than 50% of those come from <1% of pixels, then it is considered to be noise-dominated and hence unusable.
| Quadrant | # 1 sec bins | Bins with >0 counts | Bins with >2000 counts | High rate bins dominated by noise | Noise dominated (total time) | Noise dominated (detector-on time) | Marked lightcurve |
|---|---|---|---|---|---|---|---|
| A | 15805 | 14015 | 13089 | 13089 | 82.82% | 93.39% | 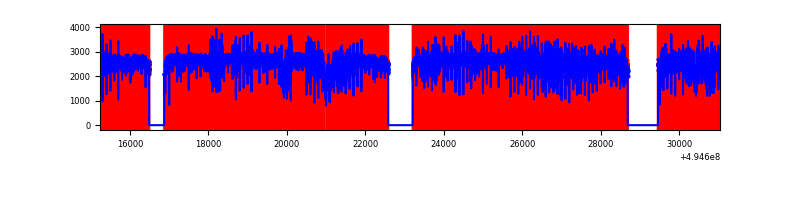 |
| B | 15807 | 14020 | 22 | 22 | 0.14% | 0.16% | 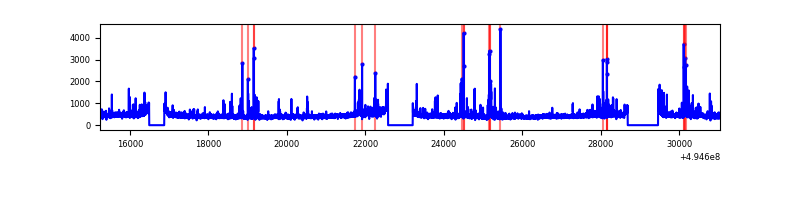 |
| C | 15806 | 14017 | 7105 | 7105 | 44.95% | 50.69% | 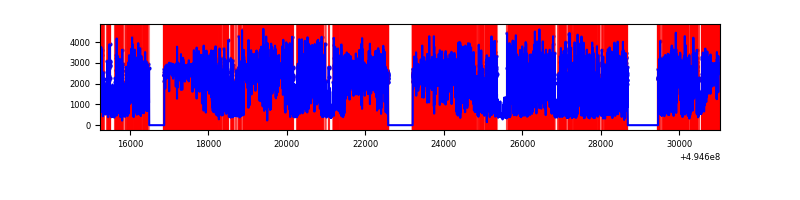 |
| D | 15806 | 14019 | 1077 | 1077 | 6.81% | 7.68% | 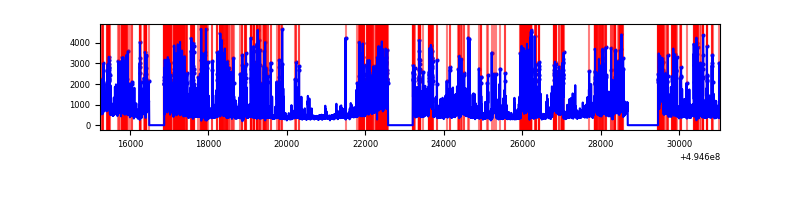 |
Top three noisy pixels from each quadrant. If the there are fewer than three noisy pixels in the level2.evt file, extra rows are filled as -1
| Pixel properties | Quadrant properties | ||||||
|---|---|---|---|---|---|---|---|
| Quadrant | DetID | PixID | Counts | Sigma | Mean | Median | Sigma |
| A | 3 | 63 | 29859366 | 196000.04 | 611 | 597 | 152.3 |
| A | 3 | 78 | 3081921 | 20226.54 | 611 | 597 | 152.3 |
| A | 8 | 249 | 155156 | 1014.56 | 611 | 597 | 152.3 |
| B | 2 | 136 | 139643 | 449.19 | 1447 | 1391 | 307.8 |
| B | 5 | 185 | 123534 | 396.85 | 1447 | 1391 | 307.8 |
| B | 0 | 213 | 91311 | 292.15 | 1447 | 1391 | 307.8 |
| C | 1 | 241 | 12762668 | 47185.8 | 989 | 982 | 270.5 |
| C | 15 | 224 | 7093239 | 26223.32 | 989 | 982 | 270.5 |
| C | 13 | 3 | 746400 | 2756.15 | 989 | 982 | 270.5 |
| D | 1 | 241 | 2467323 | 6329.68 | 1377 | 1319 | 389.6 |
| D | 2 | 172 | 1670811 | 4285.21 | 1377 | 1319 | 389.6 |
| D | 3 | 12 | 536234 | 1373.01 | 1377 | 1319 | 389.6 |
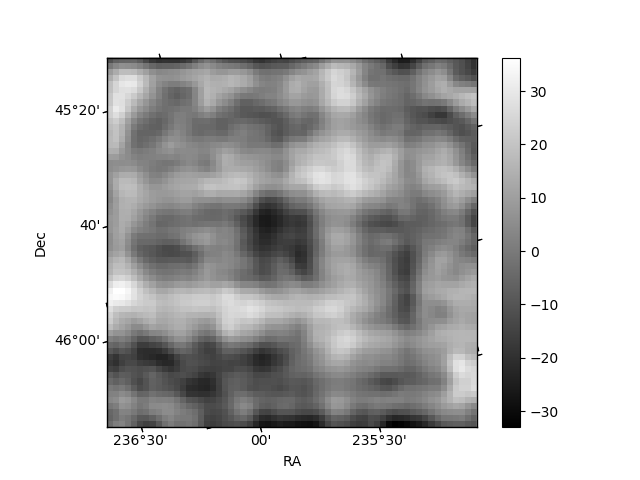
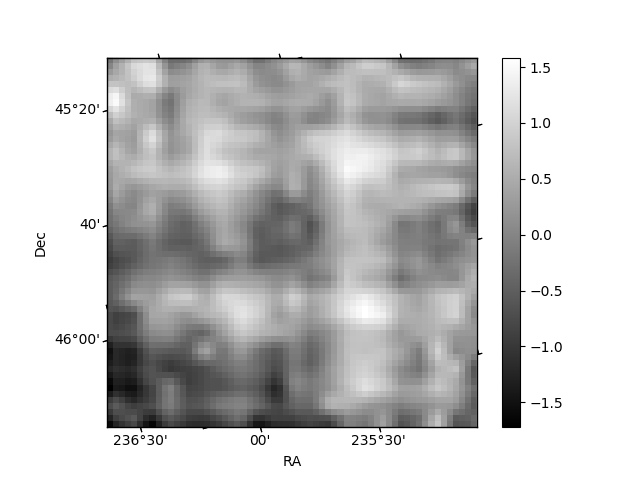
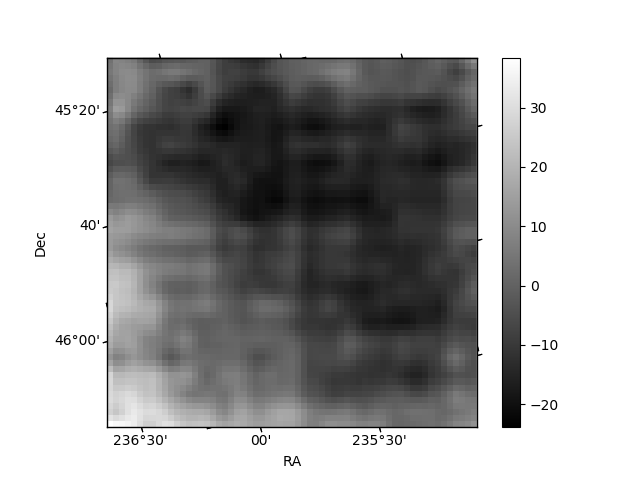
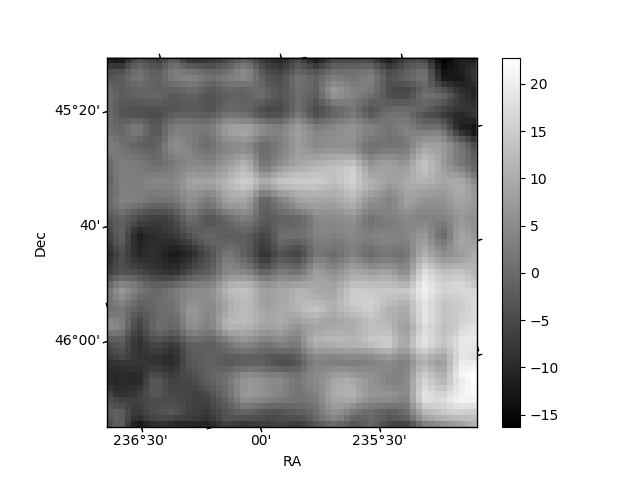
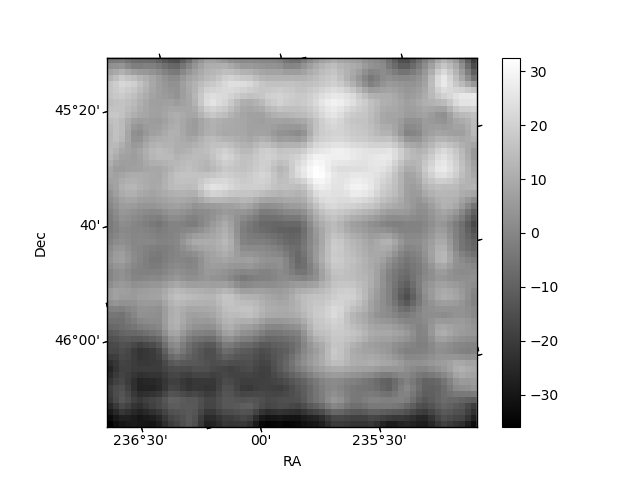
Histogram calculated using DETX and DETY for each event in the final _common_clean file
| Quadrant A | 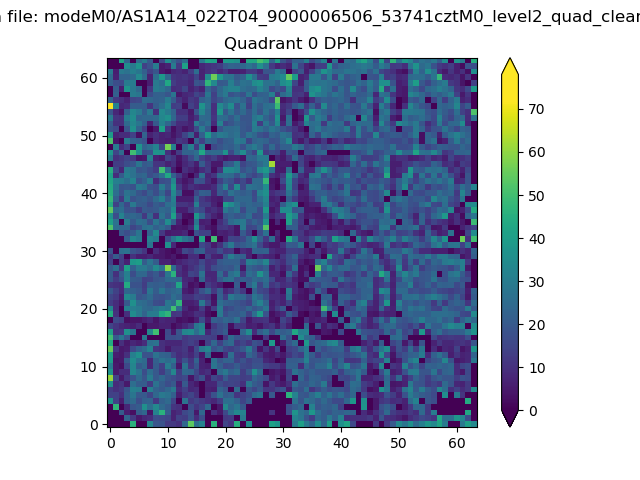 |
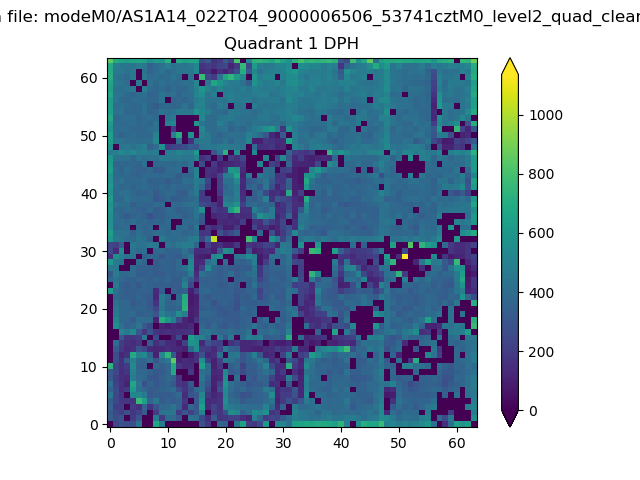 |
Quadrant B |
|---|---|---|---|
| Quadrant D | 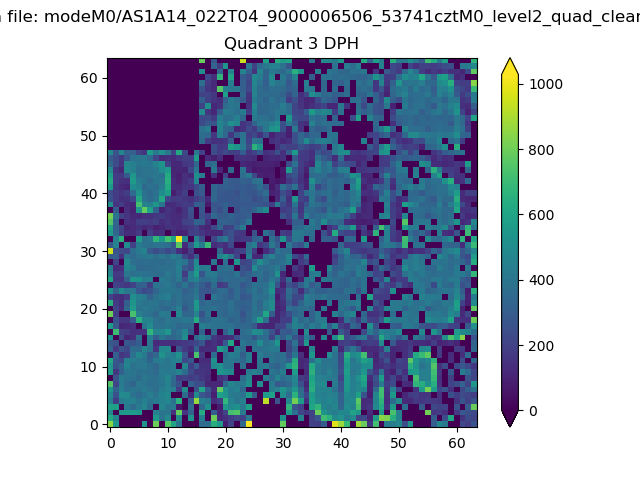 |
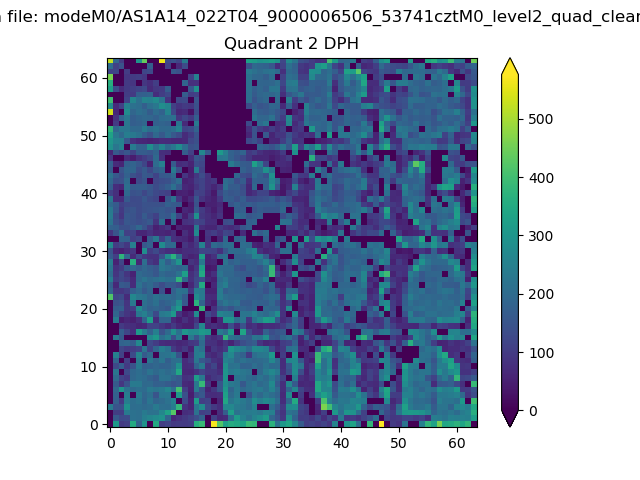 |
Quadrant C |
| Plot type | Count rate plots | Images |
|---|---|---|
| Comparison with Poisson distribution Blue bars denote a histogram of data divided into 1 sec bins. Red curve is a Poisson curve with rate = median count rate of data. |
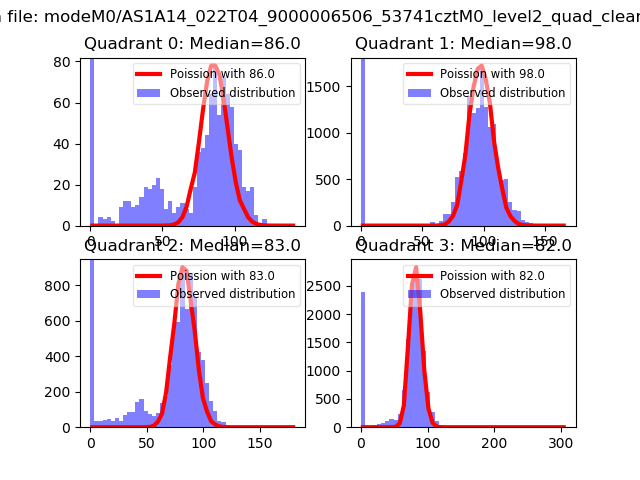 |
 |
| Quadrant-wise count rates Data is divided into 100 sec bins |
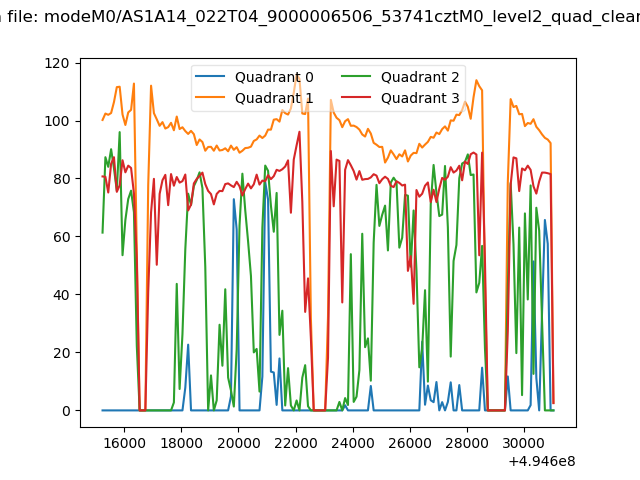 |
|
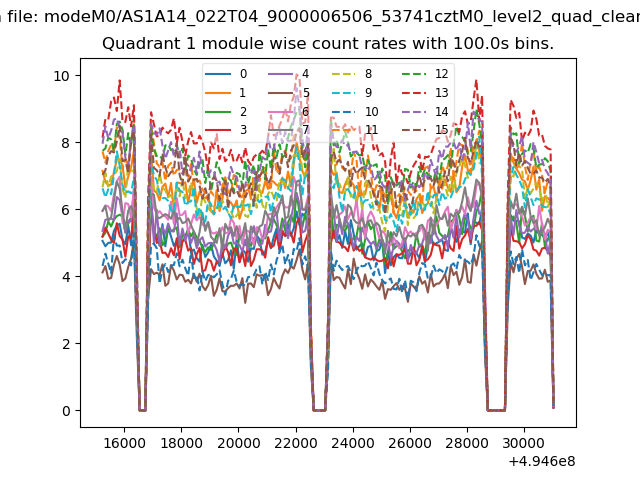
| Module-wise count rates for Quadrant A Data is divided into 100 sec bins |
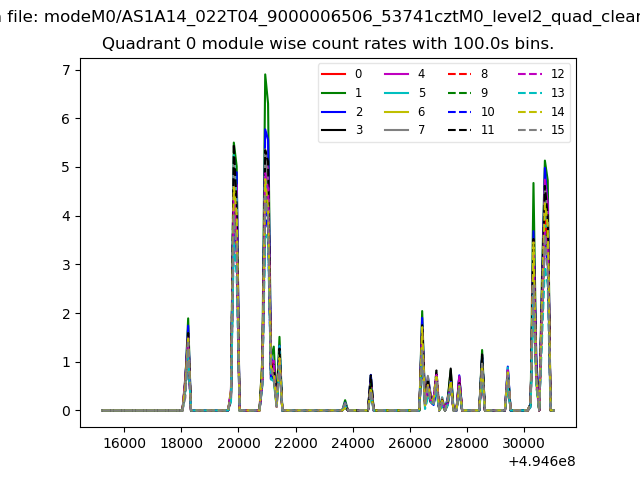 |
 |
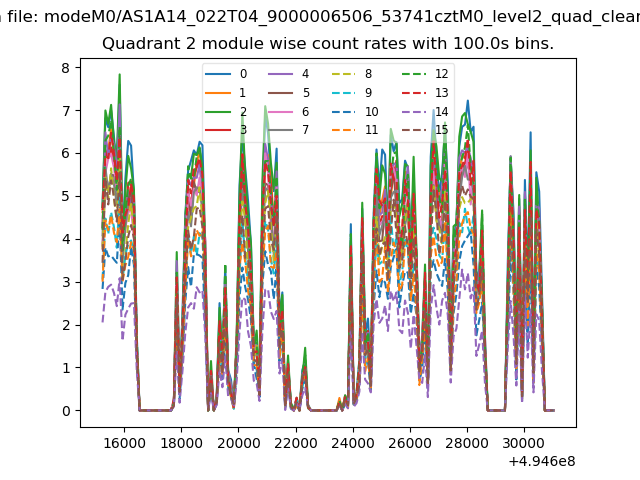
| Module-wise count rates for Quadrant B Data is divided into 100 sec bins |
 |
 |
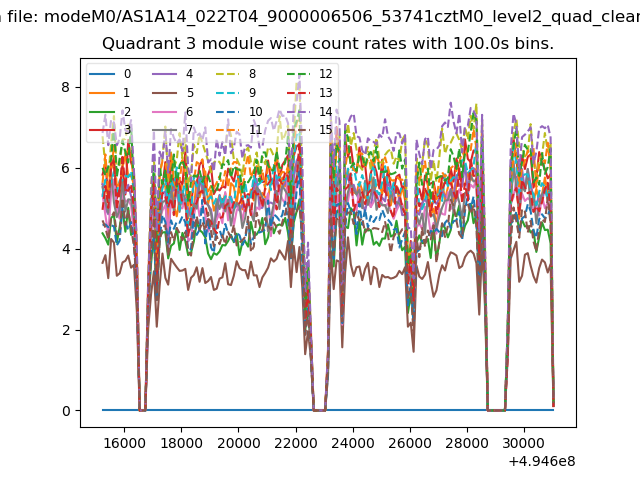
| Module-wise count rates for Quadrant C Data is divided into 100 sec bins |
 |
 |
| Module-wise count rates for Quadrant D Data is divided into 100 sec bins |
 |
 |
| Parameter | Plot |
|---|---|
| CZT HV Monitor | 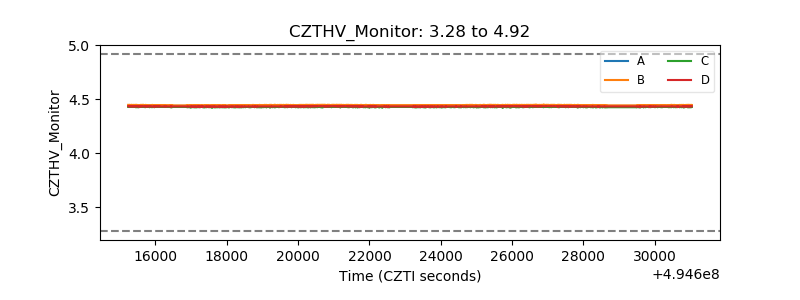 |
| D_VDD | 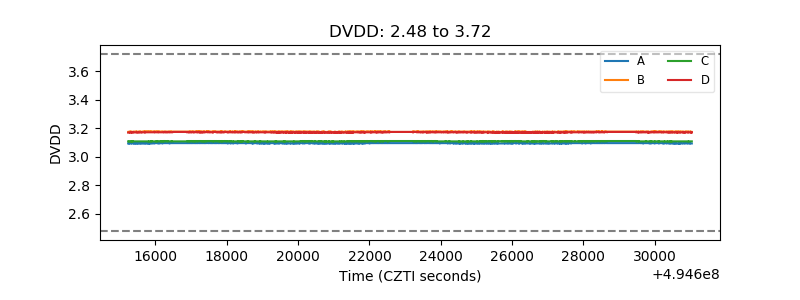 |
| Temperature 1 | 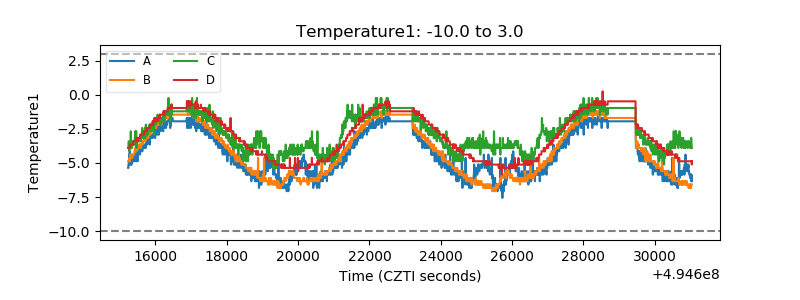 |
| Veto HV Monitor | 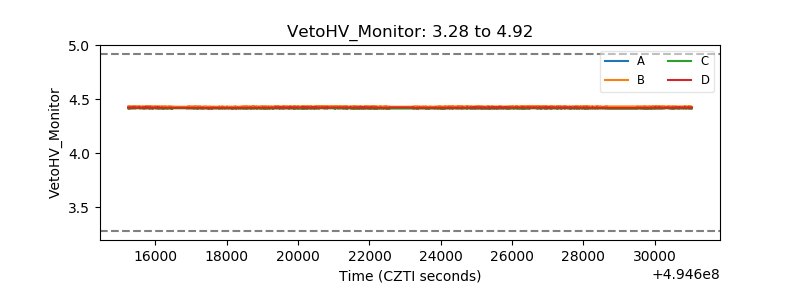 |
| Veto LLD | 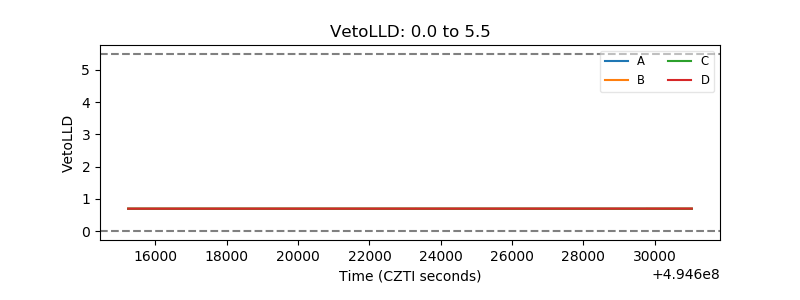 |
| Alpha Counter | 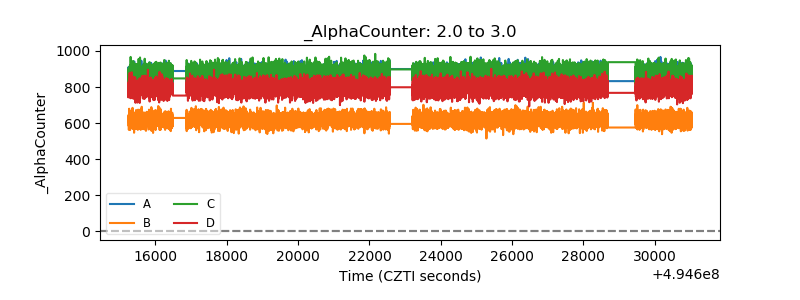 |
| _CPM_Rate | 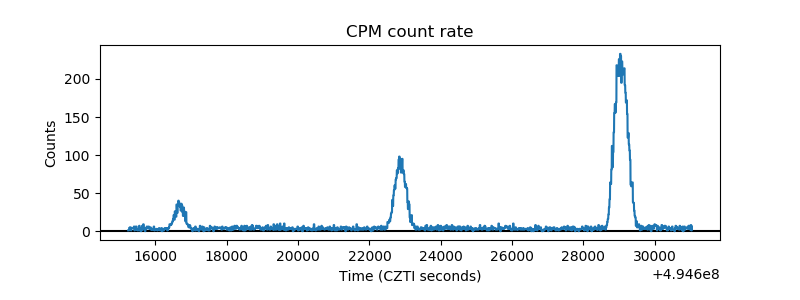 |
| CZT Counter | 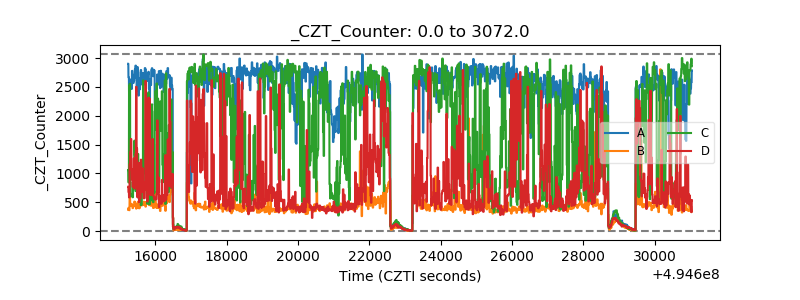 |
| +2.5 Volts monitor |  |
| +5 Volts monitor | 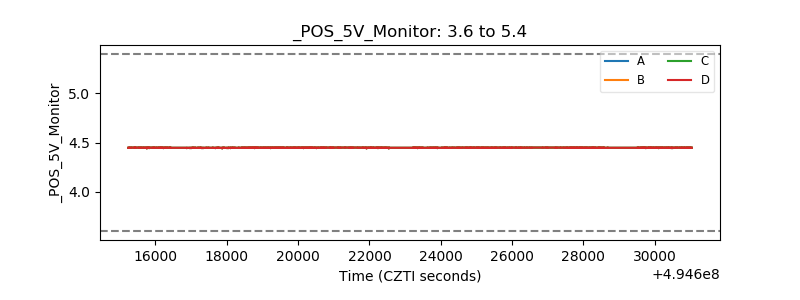 |
| _ROLL_ROT | 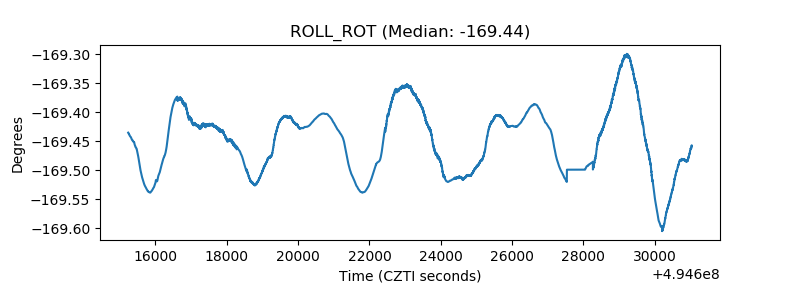 |
| _Roll_DEC | 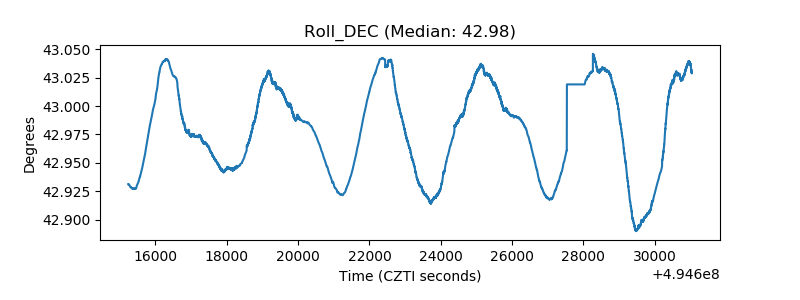 |
| _Roll_RA | 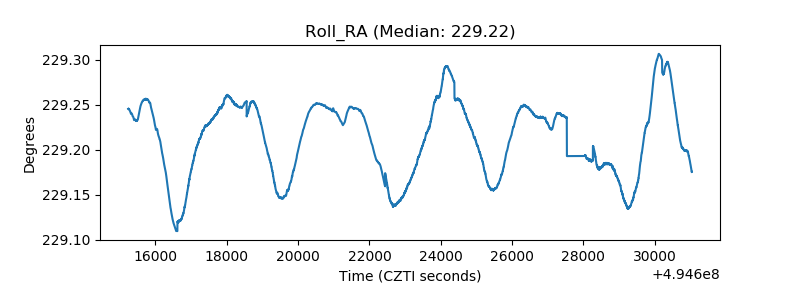 |
| Veto Counter |  |