| Param | Original file | Final file |
|---|---|---|
| Filename | modeM0/AS1A14_022T04_9000006506_53742cztM0_level2.fits | modeM0/AS1A14_022T04_9000006506_53742cztM0_level2_quad_clean.evt |
| Size (bytes) | 1,039,222,080 | 67,608,000 |
| Size | 991.1 MB | 64.5 MB |
| Events in quadrant A | 16,342,301 | 104,441 |
| Events in quadrant B | 3,152,855 | 659,139 |
| Events in quadrant C | 13,303,699 | 263,769 |
| Events in quadrant D | 5,153,001 | 553,310 |
| Mode M0 | |||
|---|---|---|---|
| Quadrant | BADHDUFLAG | Total packets | Discarded packets |
| A | 0 | 53223 | 1 |
| B | 0 | 14498 | 1 |
| C | 0 | 43959 | 1 |
| D | 0 | 20217 | 1 |
| Mode SS | |||
|---|---|---|---|
| Quadrant | BADHDUFLAG | Total packets | Discarded packets |
| A | 0 | 136 | 0 |
| B | 0 | 136 | 0 |
| C | 0 | 136 | 0 |
| D | 0 | 136 | 0 |
| Mode M9 | |||
|---|---|---|---|
| Quadrant | BADHDUFLAG | Total packets | Discarded packets |
| A | 0 | 9 | 0 |
| B | 0 | 9 | 0 |
| C | 0 | 9 | 0 |
| D | 0 | 9 | 0 |
| Quadrant | Total seconds | Saturated seconds | Saturation percentage |
|---|---|---|---|
| A | 6685 | 5804 | 86.821242% |
| B | 6685 | 91 | 1.361257% |
| C | 6686 | 4034 | 60.335028% |
| D | 6685 | 320 | 4.786836% |
Noise dominated data is calculated using 1-second bins in cleaned event files. If a bin has >2000 counts, and if more than 50% of those come from <1% of pixels, then it is considered to be noise-dominated and hence unusable.
| Quadrant | # 1 sec bins | Bins with >0 counts | Bins with >2000 counts | High rate bins dominated by noise | Noise dominated (total time) | Noise dominated (detector-on time) | Marked lightcurve |
|---|---|---|---|---|---|---|---|
| A | 7619 | 6684 | 5761 | 5761 | 75.61% | 86.19% | 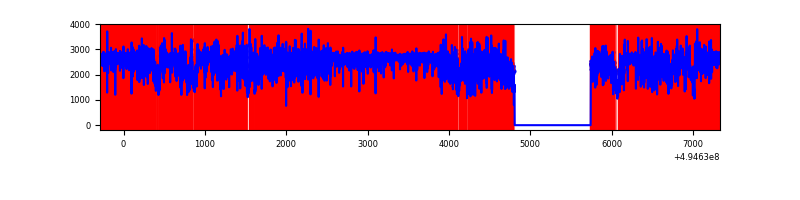 |
| B | 7620 | 6686 | 28 | 28 | 0.37% | 0.42% | 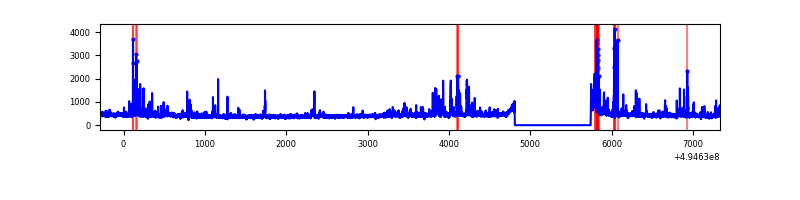 |
| C | 7621 | 6687 | 3763 | 3763 | 49.38% | 56.27% | 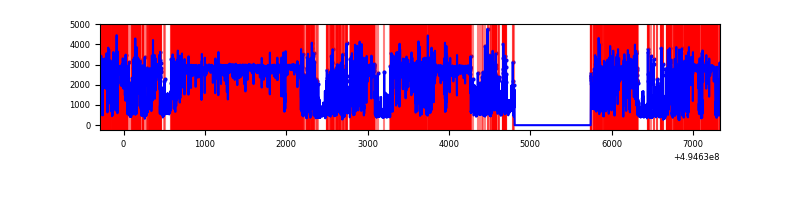 |
| D | 7620 | 6686 | 277 | 277 | 3.64% | 4.14% | 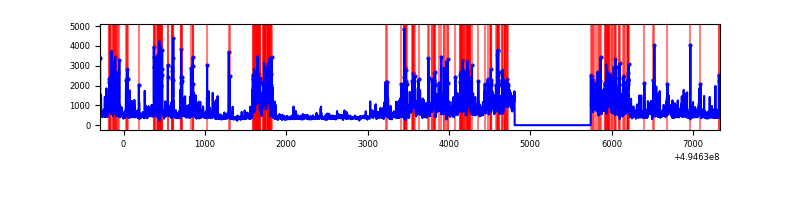 |
Top three noisy pixels from each quadrant. If the there are fewer than three noisy pixels in the level2.evt file, extra rows are filled as -1
| Pixel properties | Quadrant properties | ||||||
|---|---|---|---|---|---|---|---|
| Quadrant | DetID | PixID | Counts | Sigma | Mean | Median | Sigma |
| A | 3 | 63 | 13570106 | 133589.36 | 406 | 397 | 101.6 |
| A | 3 | 78 | 559879 | 5507.91 | 406 | 397 | 101.6 |
| A | 0 | 8 | 156245 | 1534.27 | 406 | 397 | 101.6 |
| B | 4 | 171 | 148203 | 1006.24 | 682 | 656 | 146.6 |
| B | 2 | 136 | 63221 | 426.68 | 682 | 656 | 146.6 |
| B | 4 | 81 | 60061 | 405.13 | 682 | 656 | 146.6 |
| C | 1 | 241 | 7281693 | 60400.4 | 432 | 428 | 120.5 |
| C | 15 | 224 | 3213411 | 26652.71 | 432 | 428 | 120.5 |
| C | 13 | 3 | 759853 | 6299.67 | 432 | 428 | 120.5 |
| D | 2 | 172 | 1040221 | 5529.12 | 661 | 632 | 188.0 |
| D | 2 | 153 | 567124 | 3012.92 | 661 | 632 | 188.0 |
| D | 2 | 37 | 356227 | 1891.25 | 661 | 632 | 188.0 |
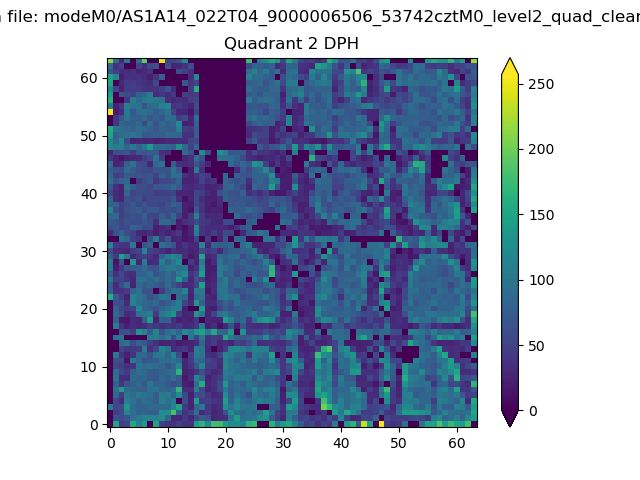
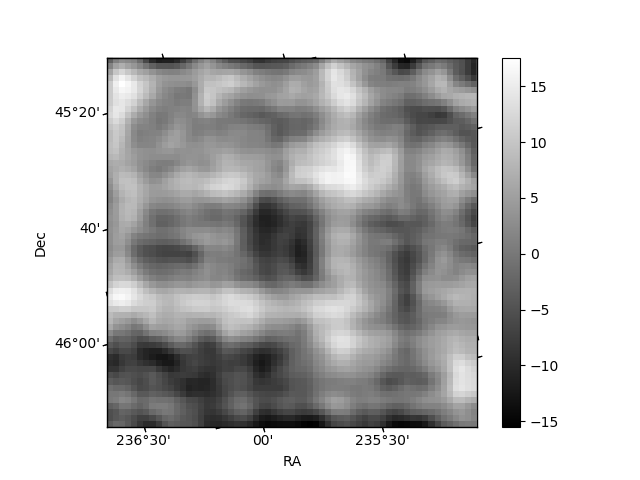
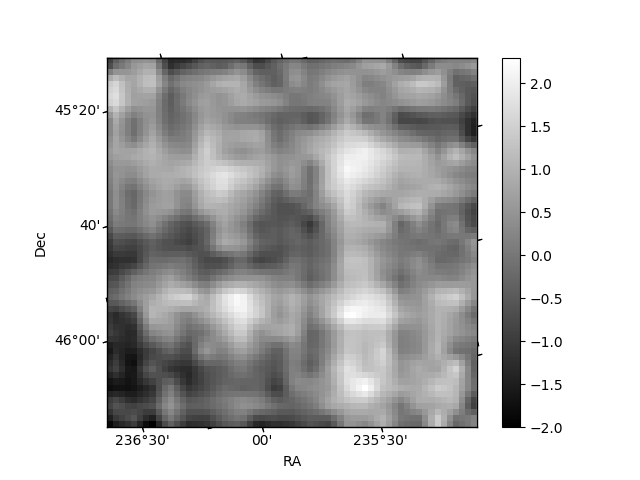
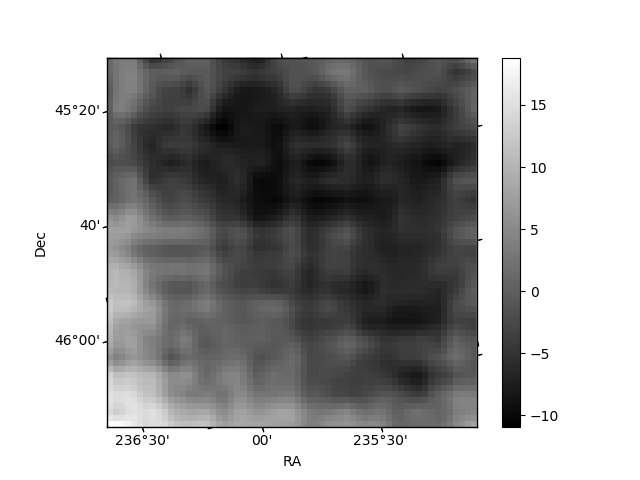
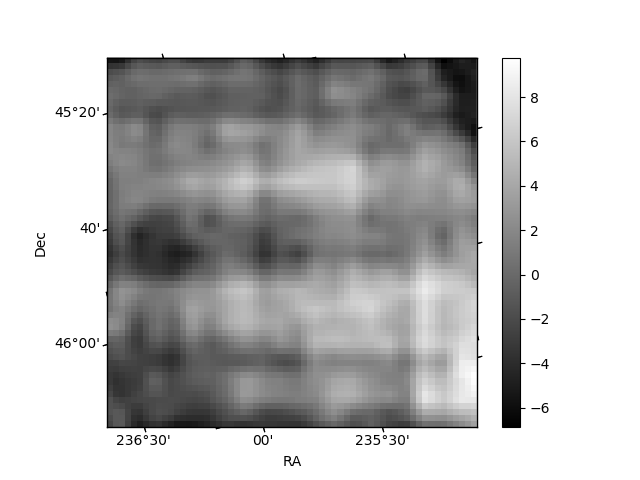
Histogram calculated using DETX and DETY for each event in the final _common_clean file
| Quadrant A | 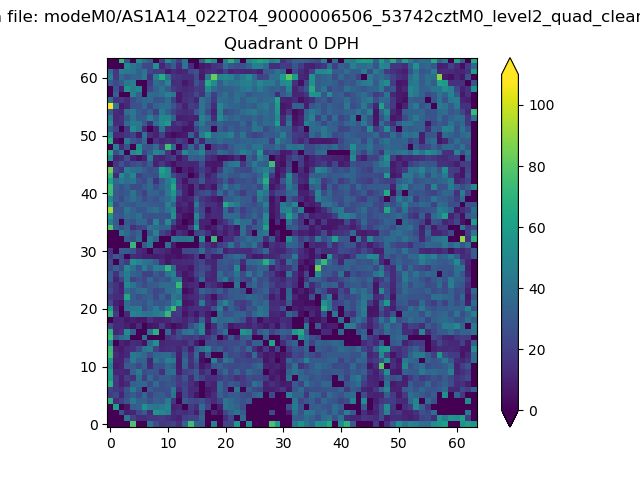 |
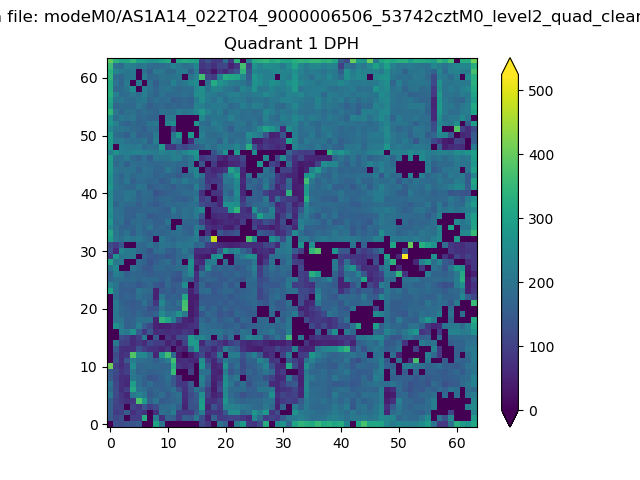 |
Quadrant B |
|---|---|---|---|
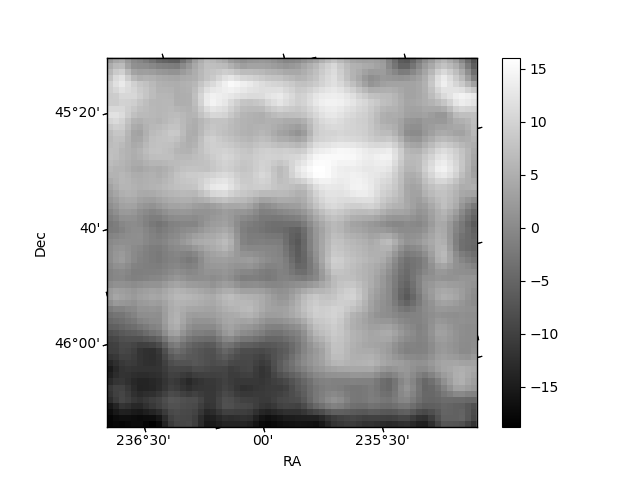
| Quadrant D | 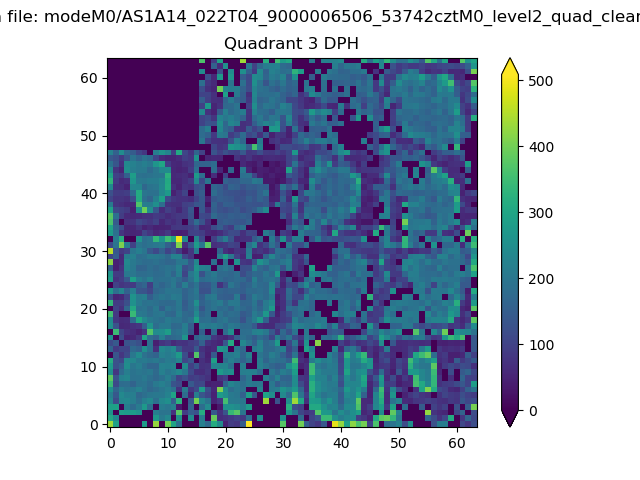 |
 |
Quadrant C |
| Plot type | Count rate plots | Images |
|---|---|---|
| Comparison with Poisson distribution Blue bars denote a histogram of data divided into 1 sec bins. Red curve is a Poisson curve with rate = median count rate of data. |
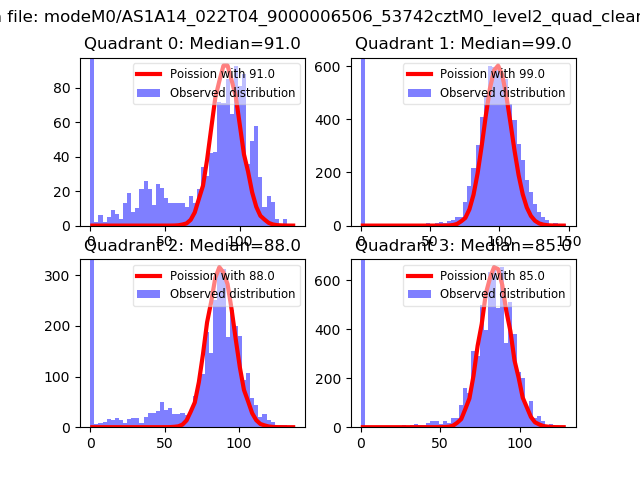 |
 |
| Quadrant-wise count rates Data is divided into 100 sec bins |
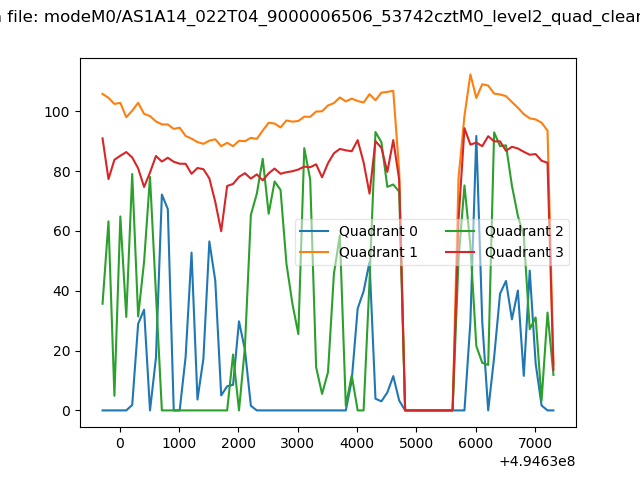 |
|
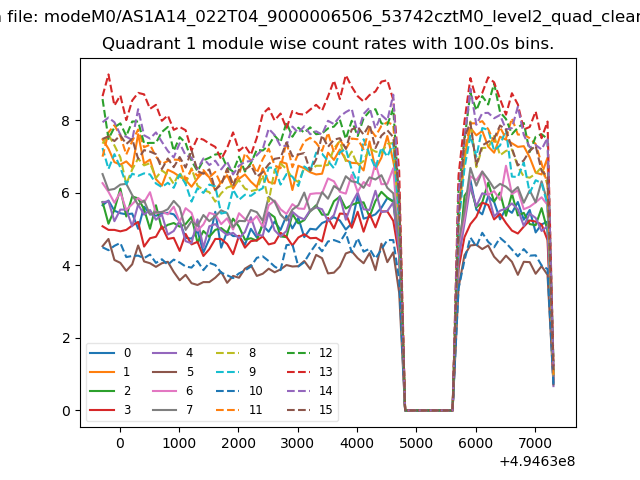
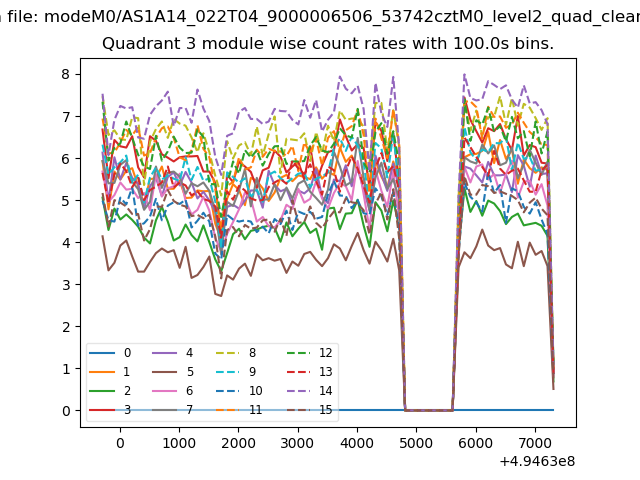
| Module-wise count rates for Quadrant A Data is divided into 100 sec bins |
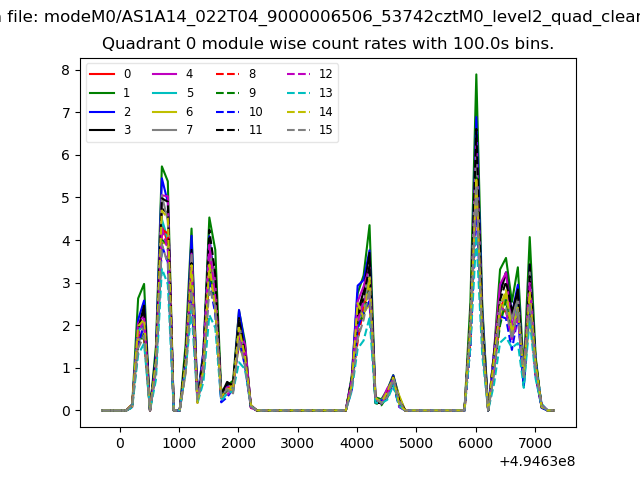 |
 |
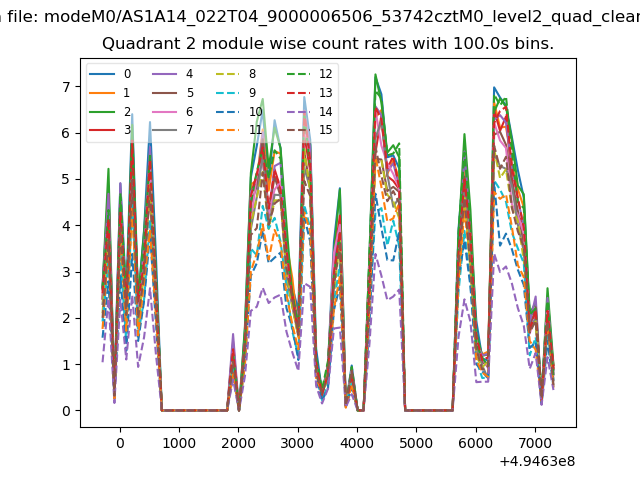
| Module-wise count rates for Quadrant B Data is divided into 100 sec bins |
 |
 |
| Module-wise count rates for Quadrant C Data is divided into 100 sec bins |
 |
 |
| Module-wise count rates for Quadrant D Data is divided into 100 sec bins |
 |
 |
| Parameter | Plot |
|---|---|
| CZT HV Monitor | 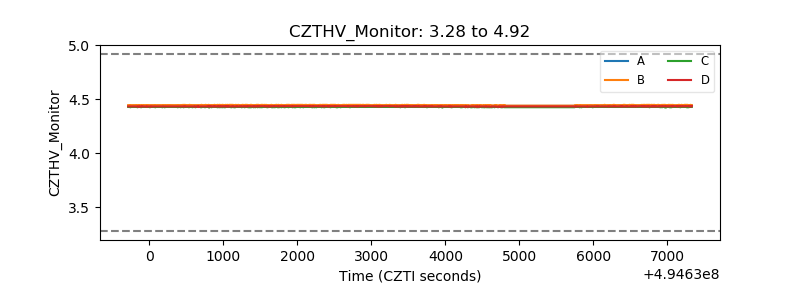 |
| D_VDD | 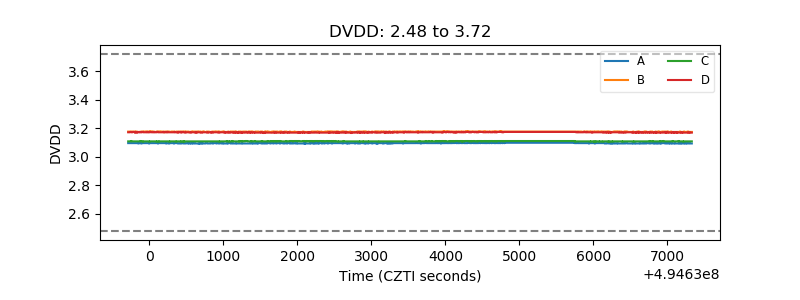 |
| Temperature 1 | 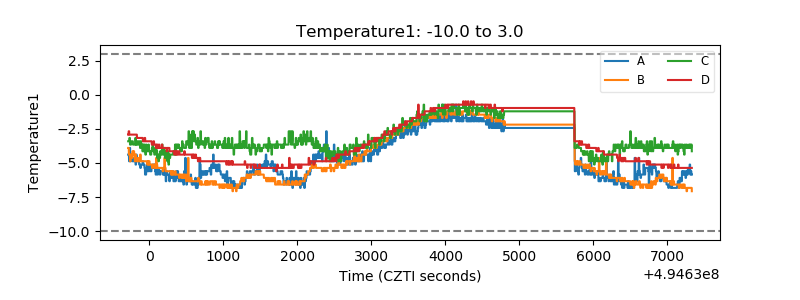 |
| Veto HV Monitor | 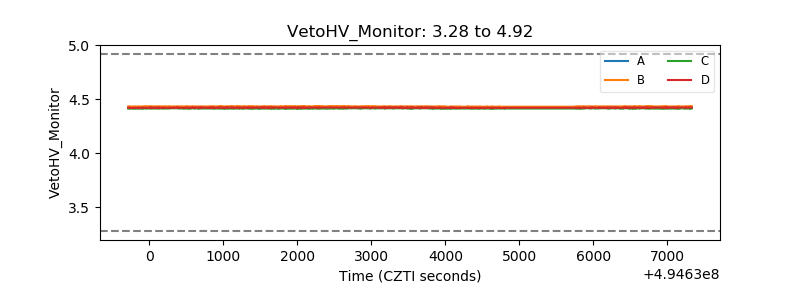 |
| Veto LLD | 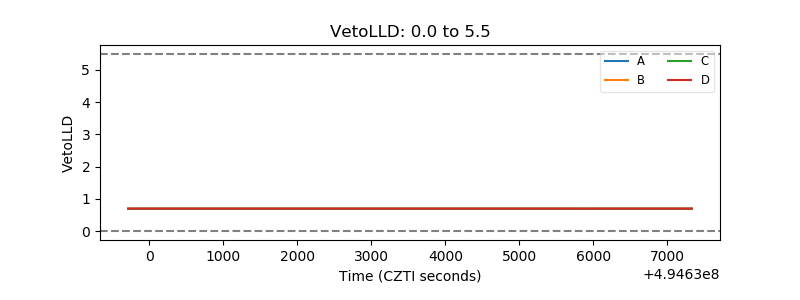 |
| Alpha Counter | 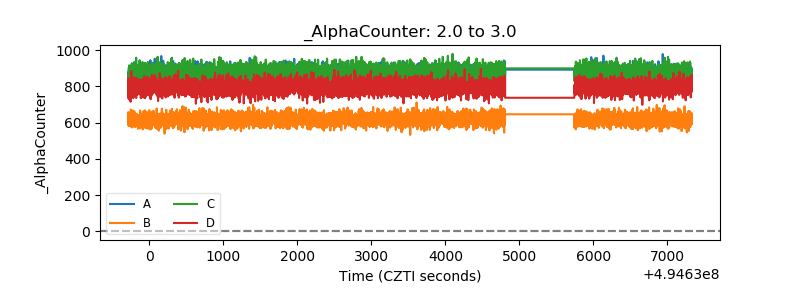 |
| _CPM_Rate | 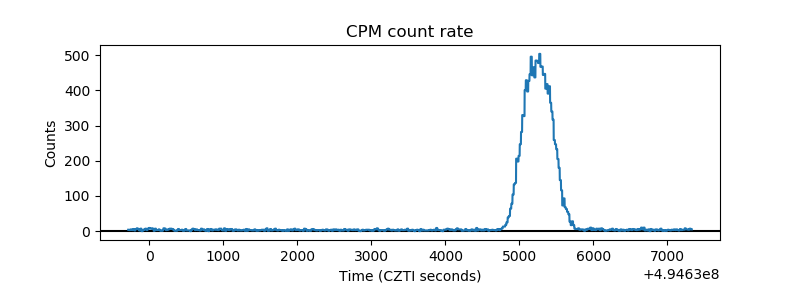 |
| CZT Counter | 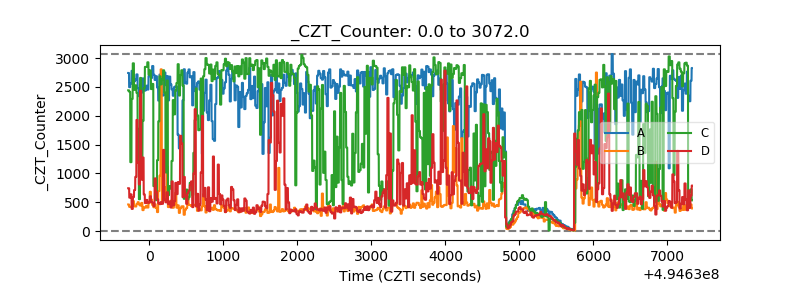 |
| +2.5 Volts monitor | 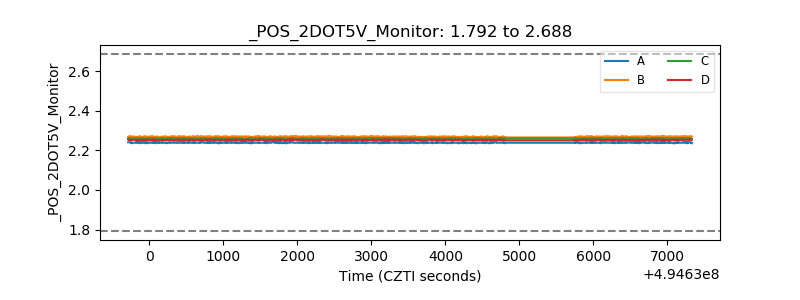 |
| +5 Volts monitor | 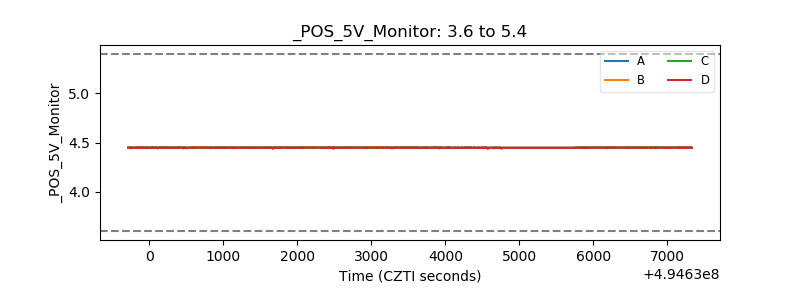 |
| _ROLL_ROT | 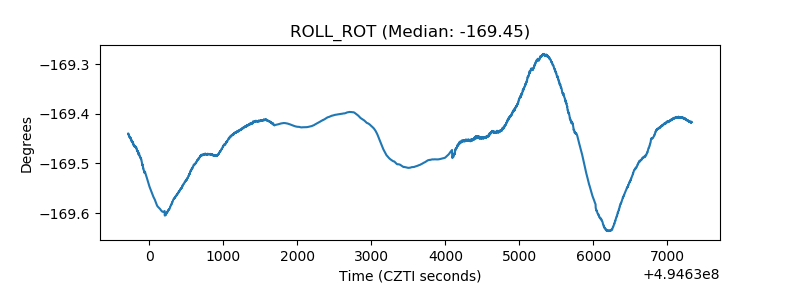 |
| _Roll_DEC | 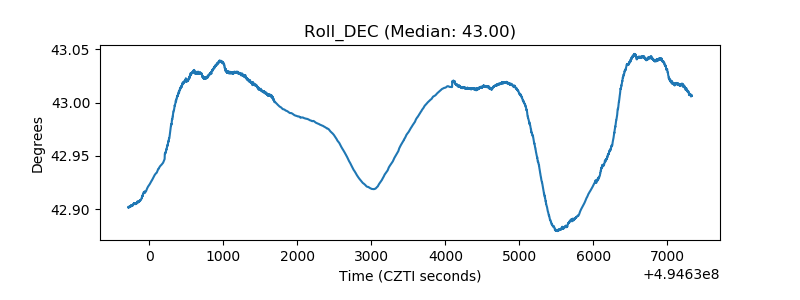 |
| _Roll_RA | 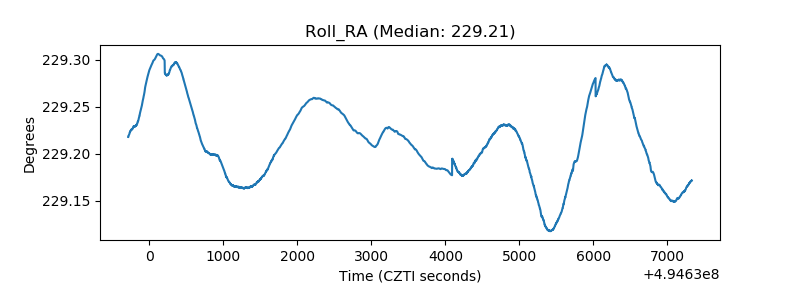 |
| Veto Counter | 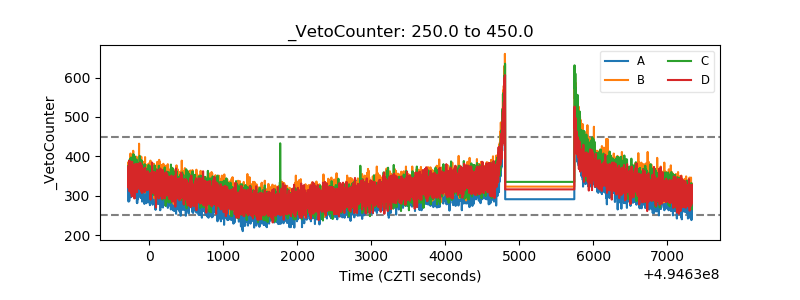 |