| Param | Original file | Final file |
|---|---|---|
| Filename | modeM0/AS1A14_022T04_9000006506_53744cztM0_level2.fits | modeM0/AS1A14_022T04_9000006506_53744cztM0_level2_quad_clean.evt |
| Size (bytes) | 953,202,240 | 74,583,360 |
| Size | 909.0 MB | 71.1 MB |
| Events in quadrant A | 16,532,068 | 92,278 |
| Events in quadrant B | 3,275,540 | 682,209 |
| Events in quadrant C | 8,803,030 | 460,953 |
| Events in quadrant D | 6,153,080 | 553,388 |
| Mode M0 | |||
|---|---|---|---|
| Quadrant | BADHDUFLAG | Total packets | Discarded packets |
| A | 0 | 53763 | 2 |
| B | 0 | 14679 | 2 |
| C | 0 | 30821 | 7 |
| D | 0 | 23022 | 2 |
| Mode SS | |||
|---|---|---|---|
| Quadrant | BADHDUFLAG | Total packets | Discarded packets |
| A | 0 | 138 | 0 |
| B | 0 | 138 | 0 |
| C | 0 | 138 | 0 |
| D | 0 | 138 | 0 |
| Mode M9 | |||
|---|---|---|---|
| Quadrant | BADHDUFLAG | Total packets | Discarded packets |
| A | 0 | 10 | 0 |
| B | 0 | 10 | 0 |
| C | 0 | 11 | 0 |
| D | 0 | 11 | 0 |
| Quadrant | Total seconds | Saturated seconds | Saturation percentage |
|---|---|---|---|
| A | 6729 | 6001 | 89.181156% |
| B | 6729 | 106 | 1.575271% |
| C | 6728 | 1923 | 28.582045% |
| D | 6728 | 526 | 7.818074% |
Noise dominated data is calculated using 1-second bins in cleaned event files. If a bin has >2000 counts, and if more than 50% of those come from <1% of pixels, then it is considered to be noise-dominated and hence unusable.
| Quadrant | # 1 sec bins | Bins with >0 counts | Bins with >2000 counts | High rate bins dominated by noise | Noise dominated (total time) | Noise dominated (detector-on time) | Marked lightcurve |
|---|---|---|---|---|---|---|---|
| A | 7798 | 6728 | 5915 | 5915 | 75.85% | 87.92% | 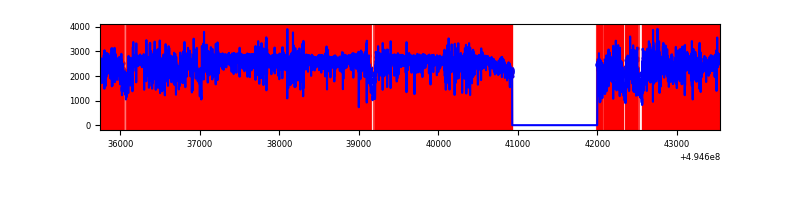 |
| B | 7799 | 6730 | 42 | 42 | 0.54% | 0.62% | 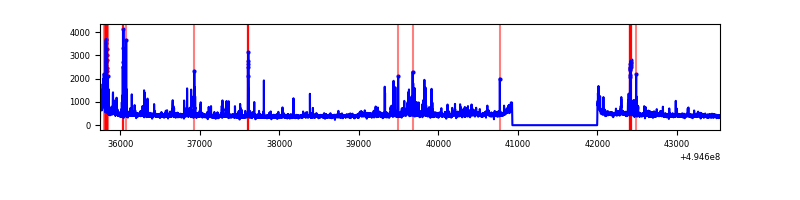 |
| C | 7797 | 6728 | 1632 | 1632 | 20.93% | 24.26% | 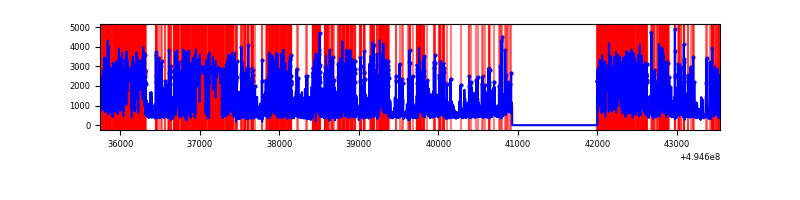 |
| D | 7798 | 6729 | 482 | 482 | 6.18% | 7.16% | 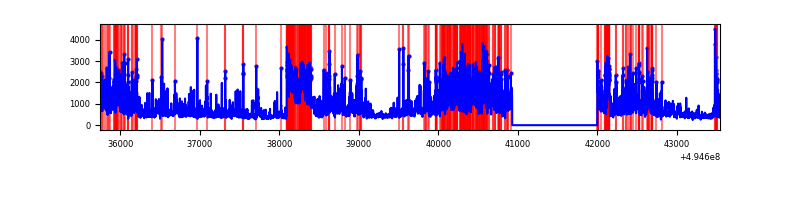 |
Top three noisy pixels from each quadrant. If the there are fewer than three noisy pixels in the level2.evt file, extra rows are filled as -1
| Pixel properties | Quadrant properties | ||||||
|---|---|---|---|---|---|---|---|
| Quadrant | DetID | PixID | Counts | Sigma | Mean | Median | Sigma |
| A | 3 | 63 | 13005251 | 141010.06 | 367 | 358 | 92.2 |
| A | 3 | 78 | 1855350 | 20113.39 | 367 | 358 | 92.2 |
| A | 8 | 249 | 87605 | 946.01 | 367 | 358 | 92.2 |
| B | 5 | 185 | 109773 | 730.79 | 700 | 676 | 149.3 |
| B | 4 | 81 | 106344 | 707.82 | 700 | 676 | 149.3 |
| B | 4 | 171 | 96073 | 639.02 | 700 | 676 | 149.3 |
| C | 15 | 224 | 4668776 | 28749.22 | 590 | 583 | 162.4 |
| C | 1 | 241 | 1475859 | 9085.53 | 590 | 583 | 162.4 |
| C | 15 | 147 | 52884 | 322.1 | 590 | 583 | 162.4 |
| D | 2 | 172 | 2097376 | 10911.56 | 670 | 641 | 192.2 |
| D | 2 | 37 | 420908 | 2187.1 | 670 | 641 | 192.2 |
| D | 3 | 224 | 209067 | 1084.66 | 670 | 641 | 192.2 |
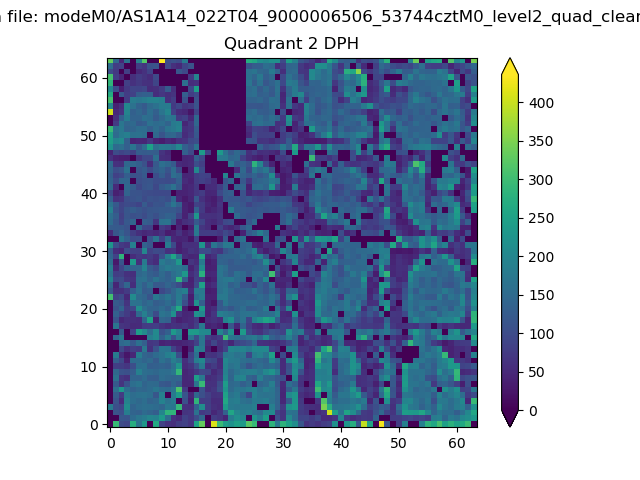
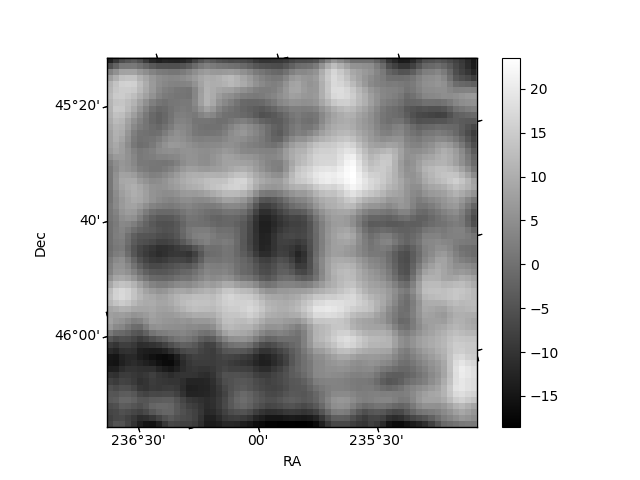
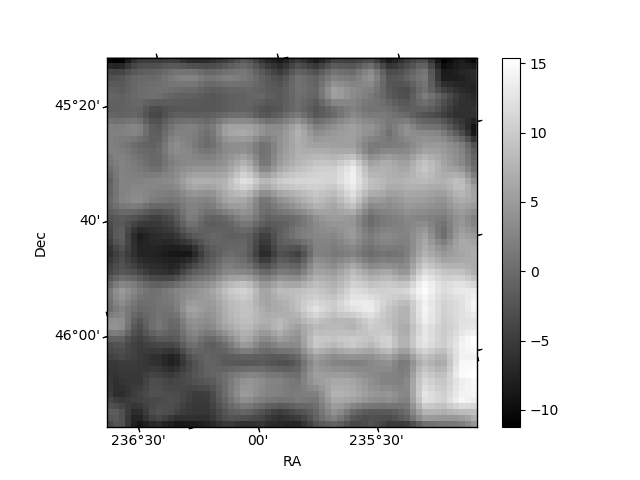
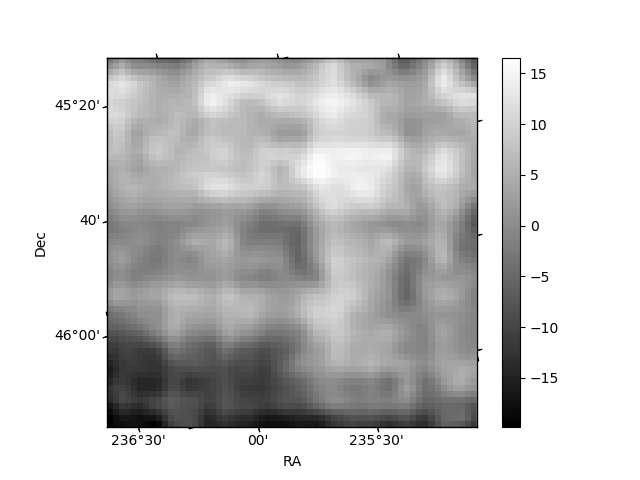
Histogram calculated using DETX and DETY for each event in the final _common_clean file
| Quadrant A | 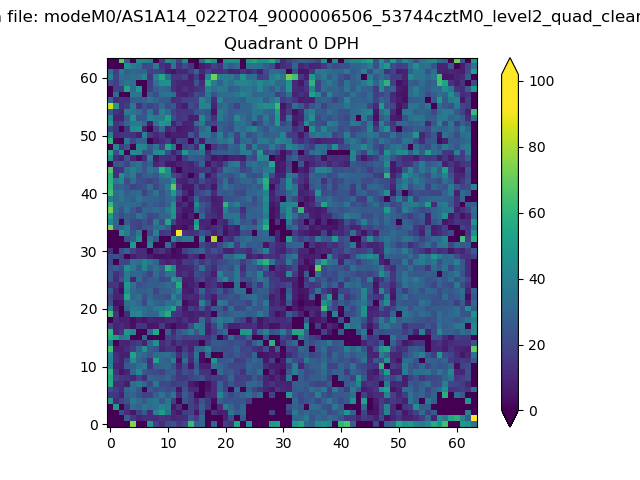 |
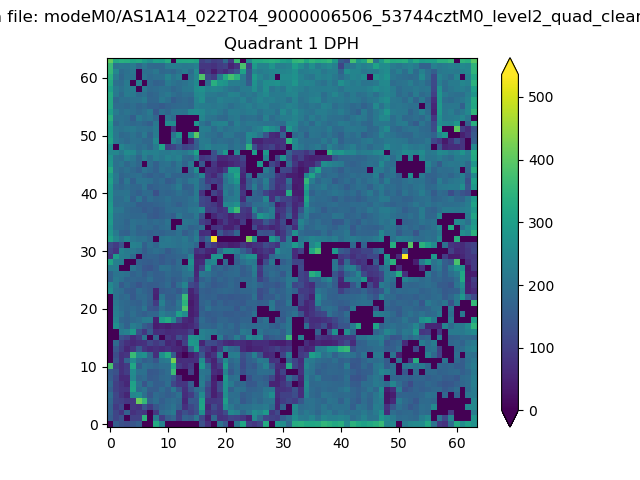 |
Quadrant B |
|---|---|---|---|
| Quadrant D | 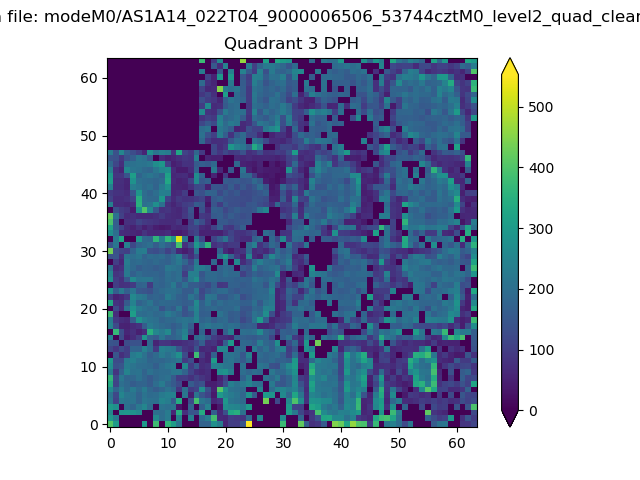 |
 |
Quadrant C |
| Plot type | Count rate plots | Images |
|---|---|---|
| Comparison with Poisson distribution Blue bars denote a histogram of data divided into 1 sec bins. Red curve is a Poisson curve with rate = median count rate of data. |
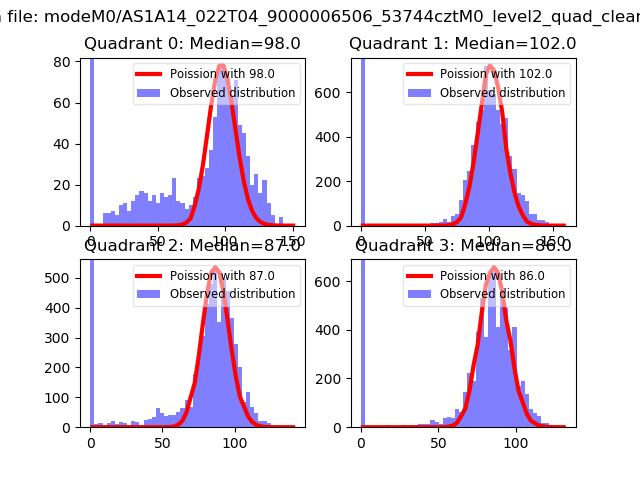 |
 |
| Quadrant-wise count rates Data is divided into 100 sec bins |
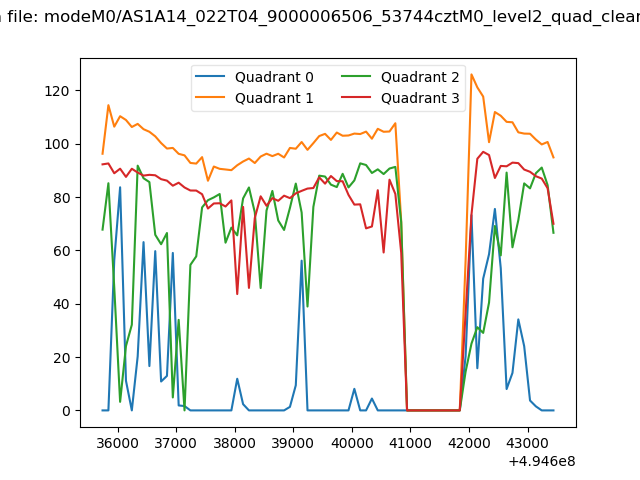 |
|
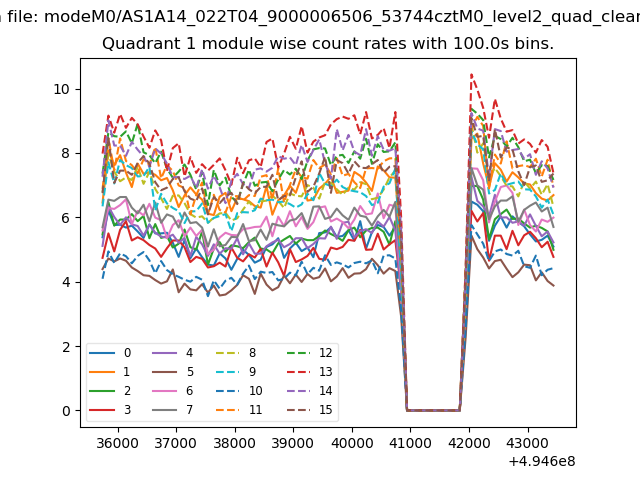
| Module-wise count rates for Quadrant A Data is divided into 100 sec bins |
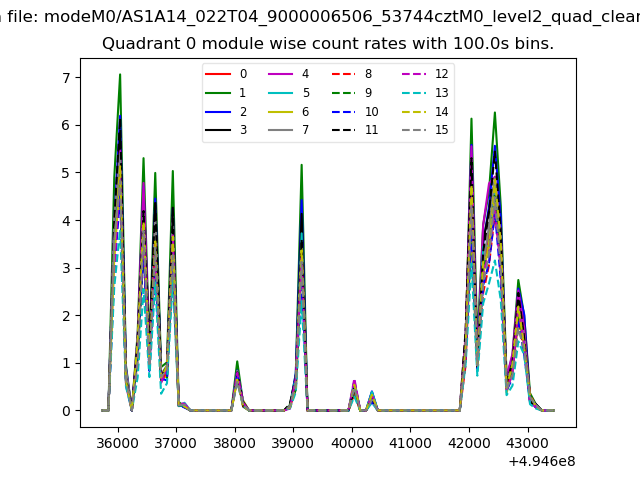 |
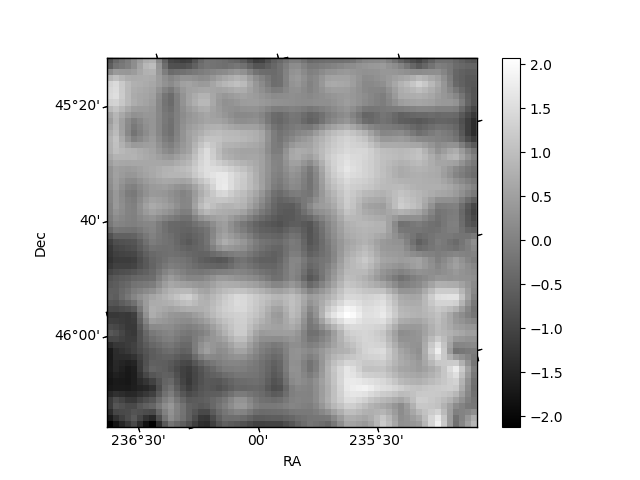 |
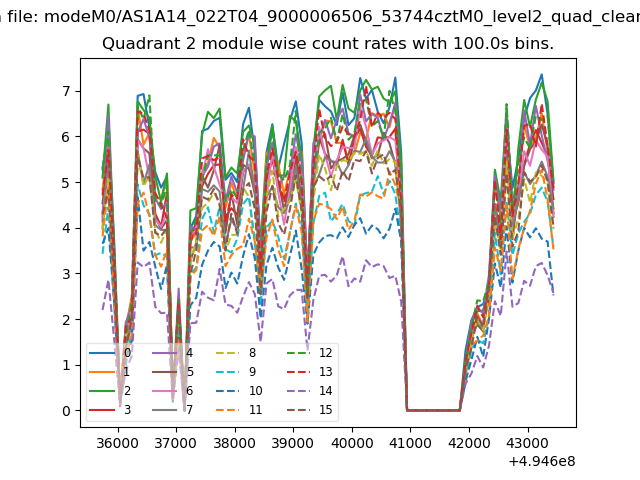
| Module-wise count rates for Quadrant B Data is divided into 100 sec bins |
 |
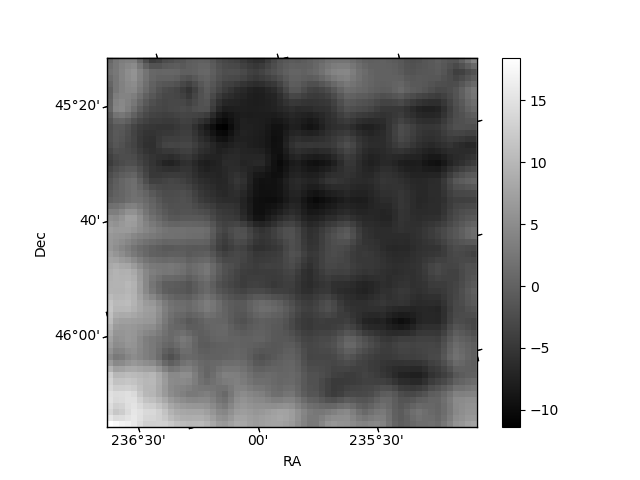 |
| Module-wise count rates for Quadrant C Data is divided into 100 sec bins |
 |
 |
| Module-wise count rates for Quadrant D Data is divided into 100 sec bins |
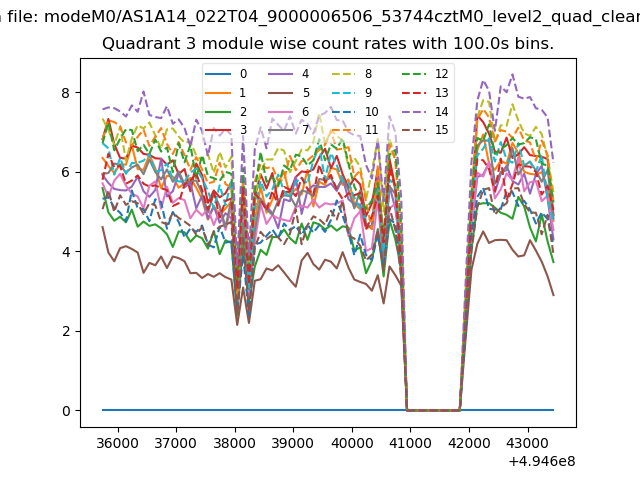 |
 |
| Parameter | Plot |
|---|---|
| CZT HV Monitor | 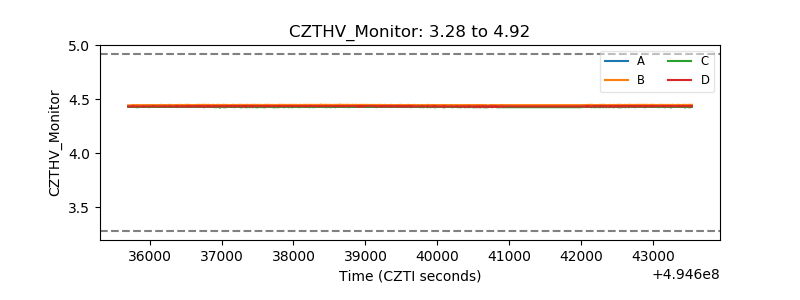 |
| D_VDD | 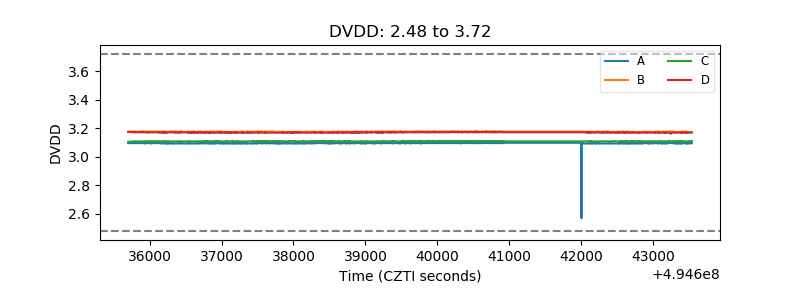 |
| Temperature 1 | 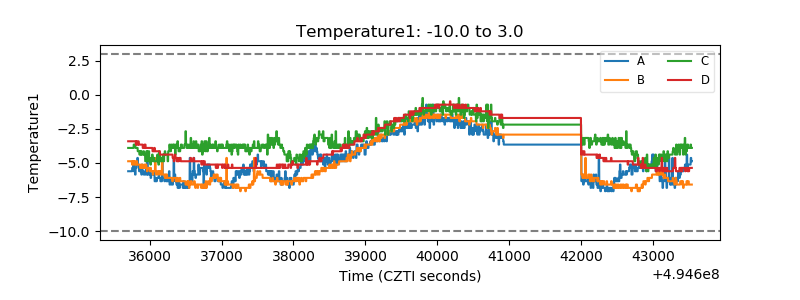 |
| Veto HV Monitor |  |
| Veto LLD | 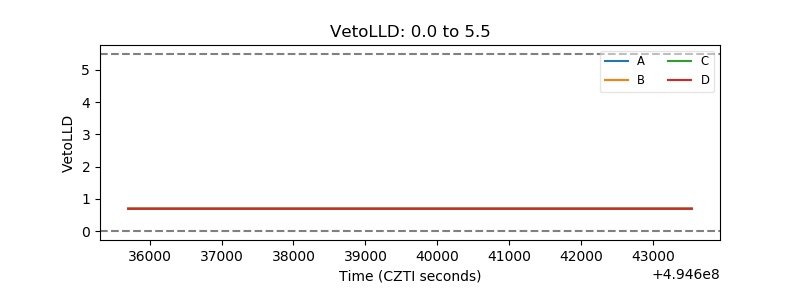 |
| Alpha Counter | 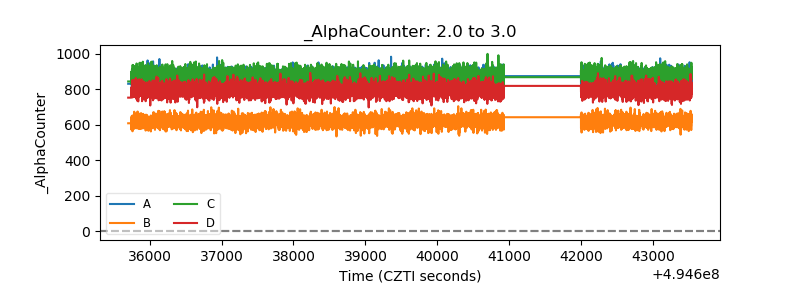 |
| _CPM_Rate | 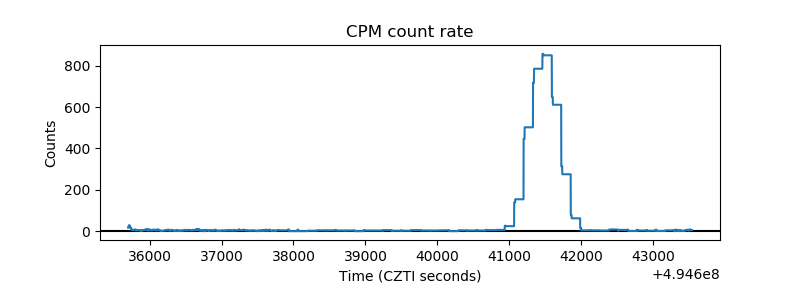 |
| CZT Counter | 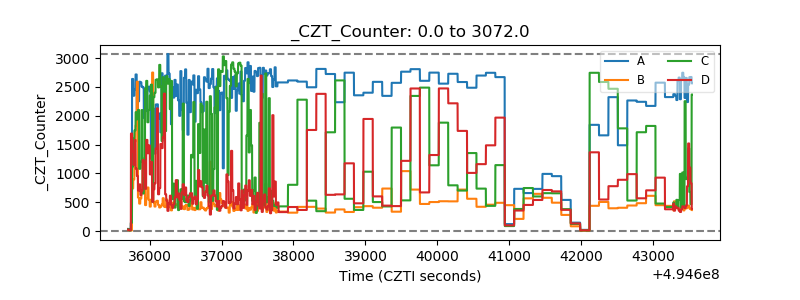 |
| +2.5 Volts monitor |  |
| +5 Volts monitor | 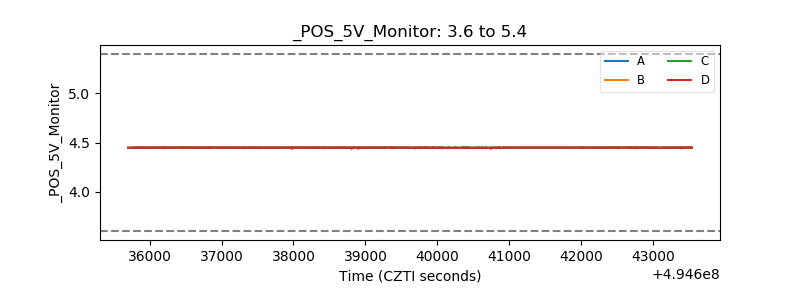 |
| _ROLL_ROT | 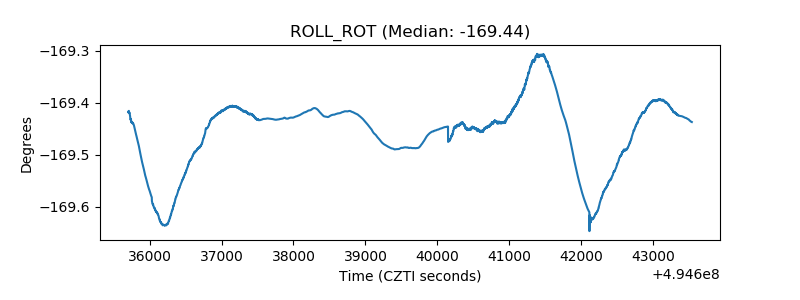 |
| _Roll_DEC | 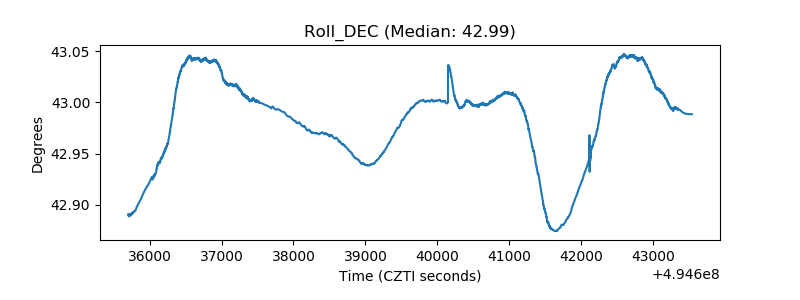 |
| _Roll_RA | 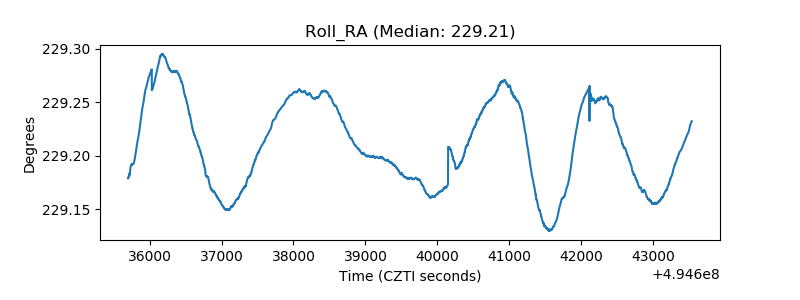 |
| Veto Counter | 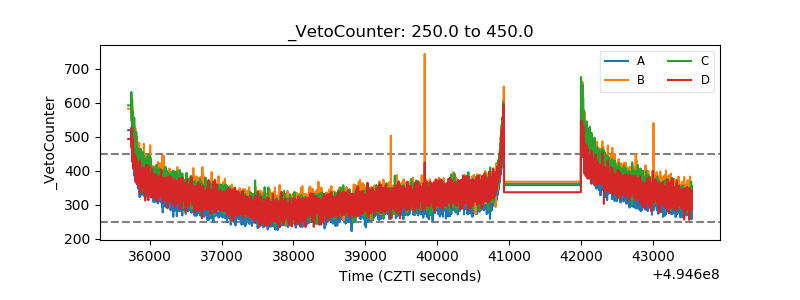 |