| Param | Original file | Final file |
|---|---|---|
| Filename | modeM0/AS1A14_022T04_9000006506_53745cztM0_level2.fits | modeM0/AS1A14_022T04_9000006506_53745cztM0_level2_quad_clean.evt |
| Size (bytes) | 979,781,760 | 71,599,680 |
| Size | 934.4 MB | 68.3 MB |
| Events in quadrant A | 16,141,436 | 84,615 |
| Events in quadrant B | 3,133,522 | 685,831 |
| Events in quadrant C | 7,832,806 | 502,927 |
| Events in quadrant D | 8,653,546 | 436,727 |
| Mode M0 | |||
|---|---|---|---|
| Quadrant | BADHDUFLAG | Total packets | Discarded packets |
| A | 0 | 52479 | 2 |
| B | 0 | 14136 | 2 |
| C | 0 | 27852 | 3 |
| D | 0 | 30278 | 2 |
| Mode SS | |||
|---|---|---|---|
| Quadrant | BADHDUFLAG | Total packets | Discarded packets |
| A | 0 | 134 | 0 |
| B | 0 | 134 | 0 |
| C | 0 | 134 | 0 |
| D | 0 | 134 | 0 |
| Mode M9 | |||
|---|---|---|---|
| Quadrant | BADHDUFLAG | Total packets | Discarded packets |
| A | 0 | 12 | 0 |
| B | 0 | 13 | 0 |
| C | 0 | 13 | 0 |
| D | 0 | 13 | 0 |
| Quadrant | Total seconds | Saturated seconds | Saturation percentage |
|---|---|---|---|
| A | 6560 | 5882 | 89.664634% |
| B | 6560 | 102 | 1.554878% |
| C | 6559 | 1449 | 22.091782% |
| D | 6559 | 1793 | 27.336484% |
Noise dominated data is calculated using 1-second bins in cleaned event files. If a bin has >2000 counts, and if more than 50% of those come from <1% of pixels, then it is considered to be noise-dominated and hence unusable.
| Quadrant | # 1 sec bins | Bins with >0 counts | Bins with >2000 counts | High rate bins dominated by noise | Noise dominated (total time) | Noise dominated (detector-on time) | Marked lightcurve |
|---|---|---|---|---|---|---|---|
| A | 7674 | 6559 | 5734 | 5734 | 74.72% | 87.42% | 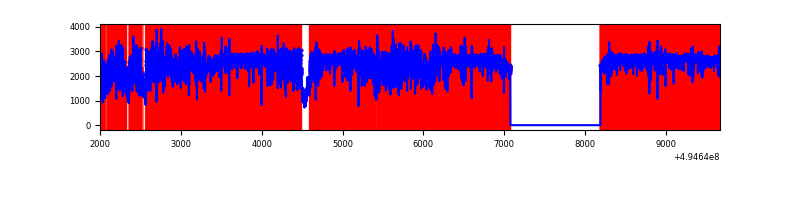 |
| B | 7675 | 6560 | 20 | 20 | 0.26% | 0.30% | 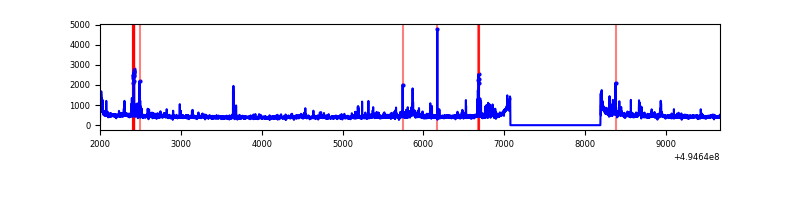 |
| C | 7674 | 6560 | 1202 | 1202 | 15.66% | 18.32% | 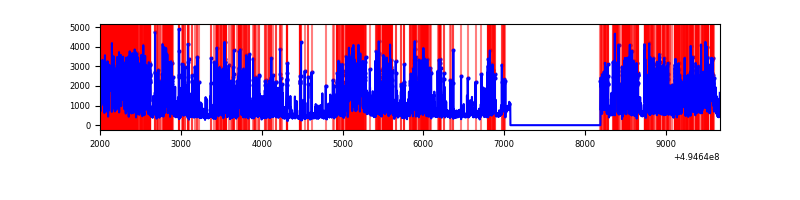 |
| D | 7673 | 6559 | 1646 | 1646 | 21.45% | 25.10% | 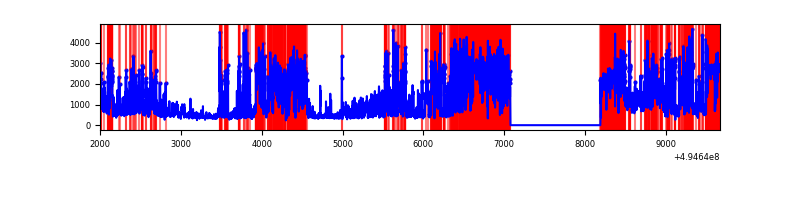 |
Top three noisy pixels from each quadrant. If the there are fewer than three noisy pixels in the level2.evt file, extra rows are filled as -1
| Pixel properties | Quadrant properties | ||||||
|---|---|---|---|---|---|---|---|
| Quadrant | DetID | PixID | Counts | Sigma | Mean | Median | Sigma |
| A | 3 | 63 | 14189199 | 149685.93 | 379 | 370 | 94.8 |
| A | 0 | 8 | 197817 | 2082.98 | 379 | 370 | 94.8 |
| A | 8 | 249 | 143753 | 1512.63 | 379 | 370 | 94.8 |
| B | 5 | 185 | 123672 | 810.77 | 705 | 680 | 151.7 |
| B | 4 | 81 | 69795 | 455.61 | 705 | 680 | 151.7 |
| B | 4 | 171 | 26071 | 167.38 | 705 | 680 | 151.7 |
| C | 15 | 224 | 4215111 | 24603.78 | 621 | 618 | 171.3 |
| C | 15 | 147 | 345519 | 2013.5 | 621 | 618 | 171.3 |
| C | 13 | 3 | 197404 | 1148.82 | 621 | 618 | 171.3 |
| D | 1 | 241 | 2879124 | 17269.5 | 581 | 555 | 166.7 |
| D | 2 | 172 | 1861078 | 11161.9 | 581 | 555 | 166.7 |
| D | 2 | 120 | 588188 | 3525.41 | 581 | 555 | 166.7 |
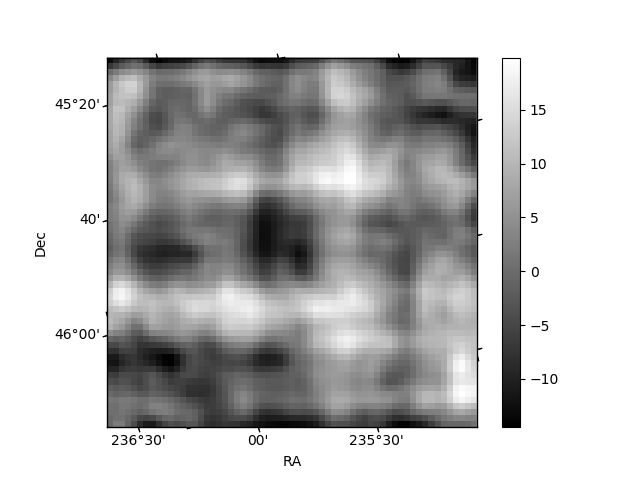
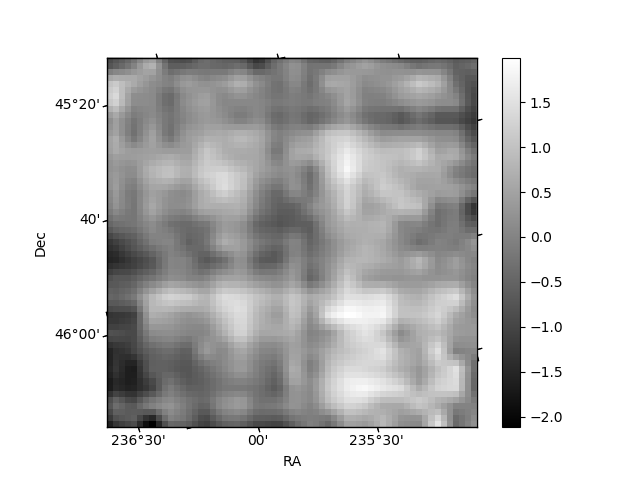
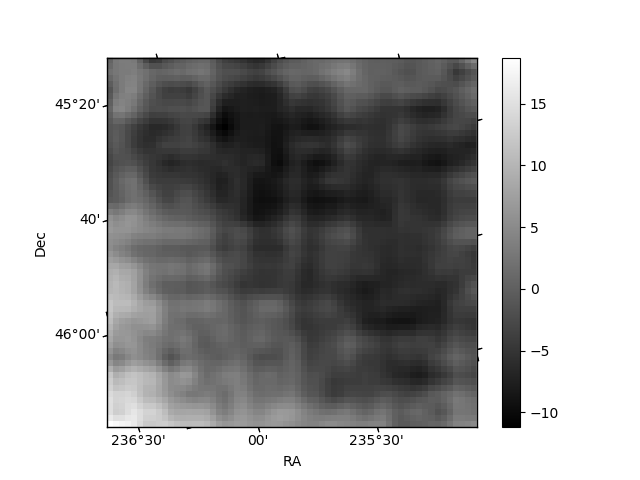
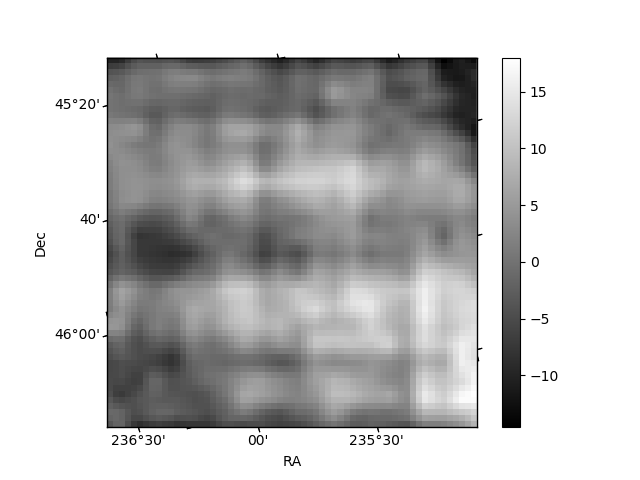
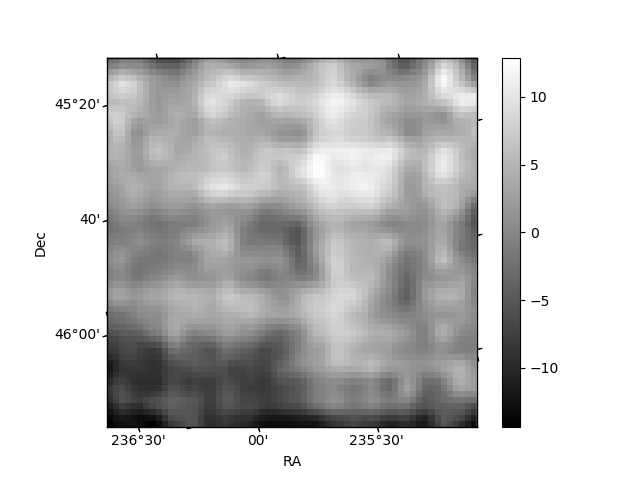
Histogram calculated using DETX and DETY for each event in the final _common_clean file
| Quadrant A | 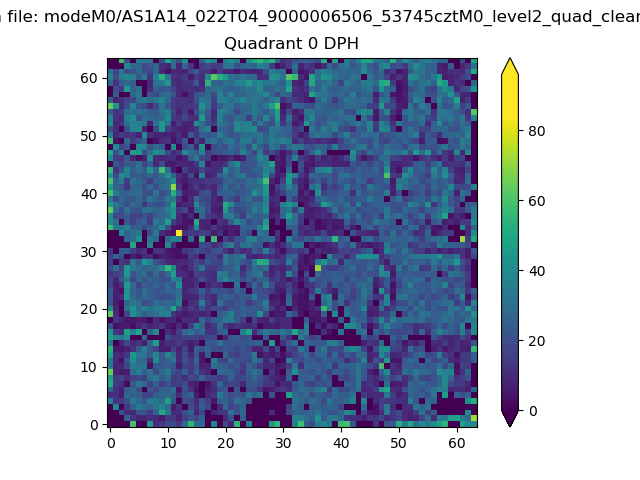 |
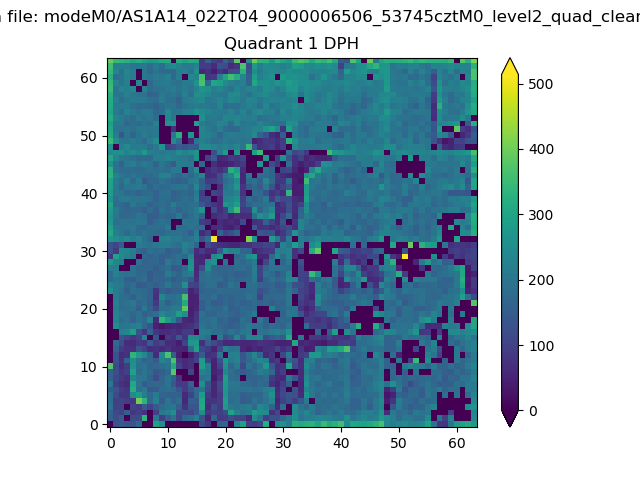 |
Quadrant B |
|---|---|---|---|
| Quadrant D | 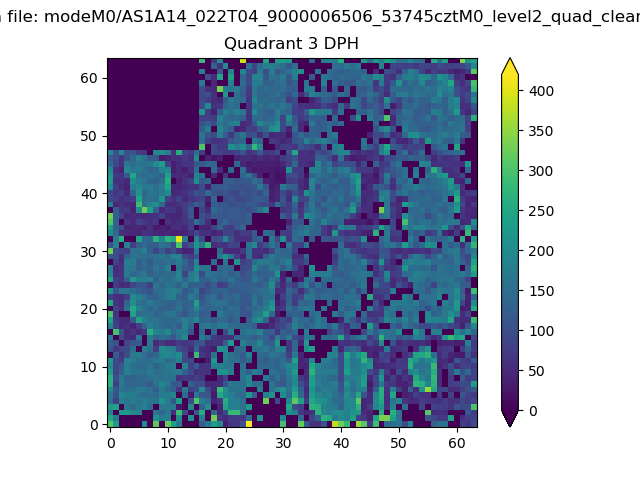 |
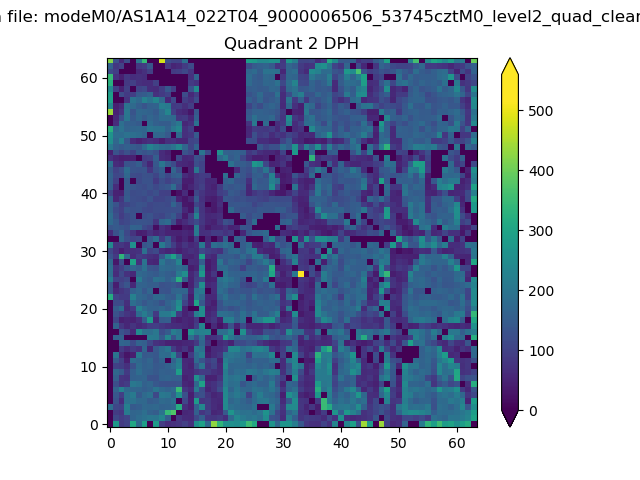 |
Quadrant C |
| Plot type | Count rate plots | Images |
|---|---|---|
| Comparison with Poisson distribution Blue bars denote a histogram of data divided into 1 sec bins. Red curve is a Poisson curve with rate = median count rate of data. |
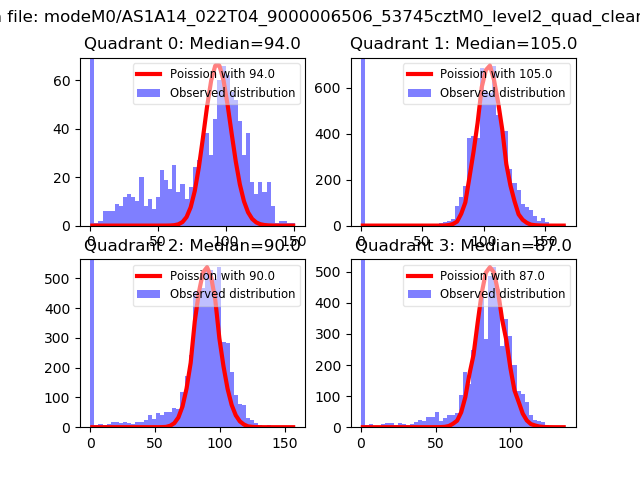 |
 |
| Quadrant-wise count rates Data is divided into 100 sec bins |
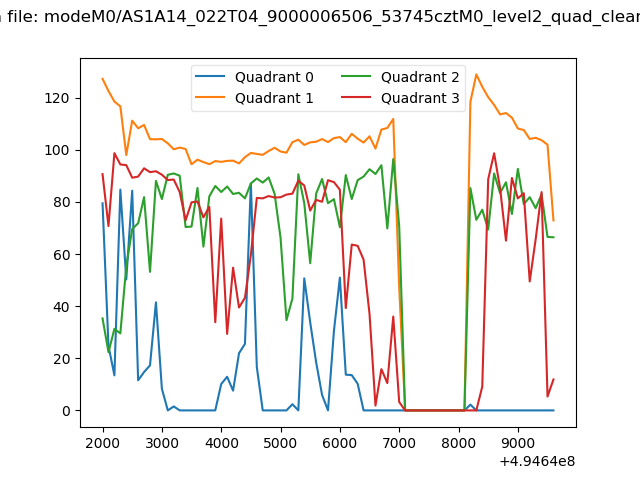 |
|
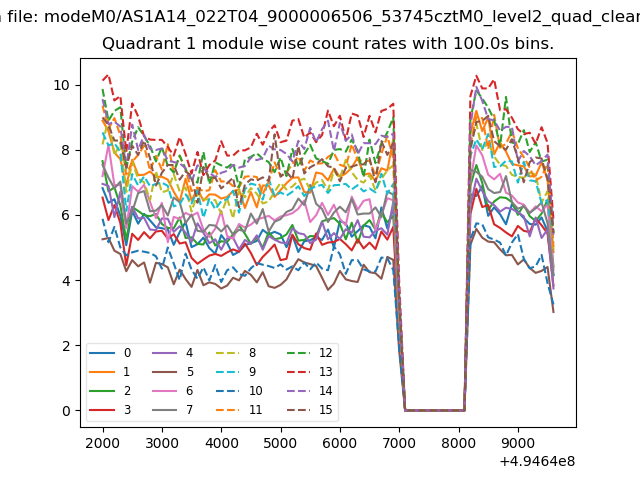
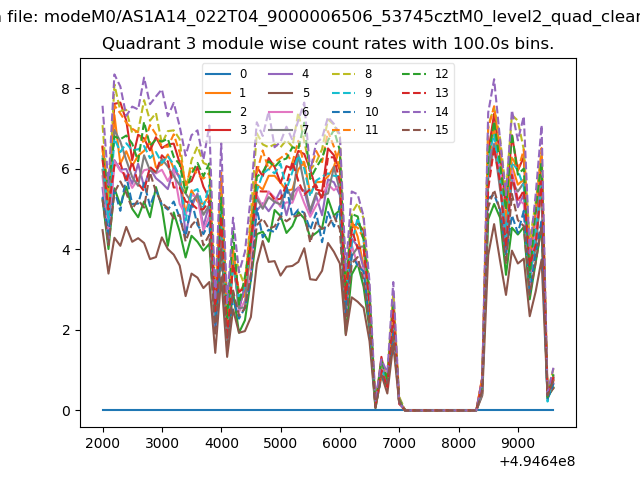
| Module-wise count rates for Quadrant A Data is divided into 100 sec bins |
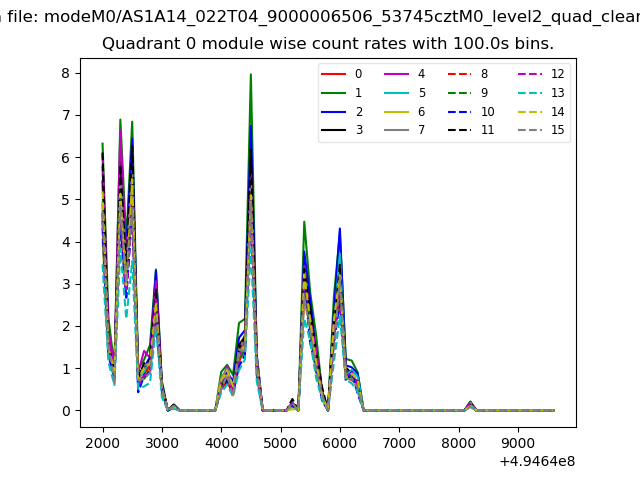 |
 |
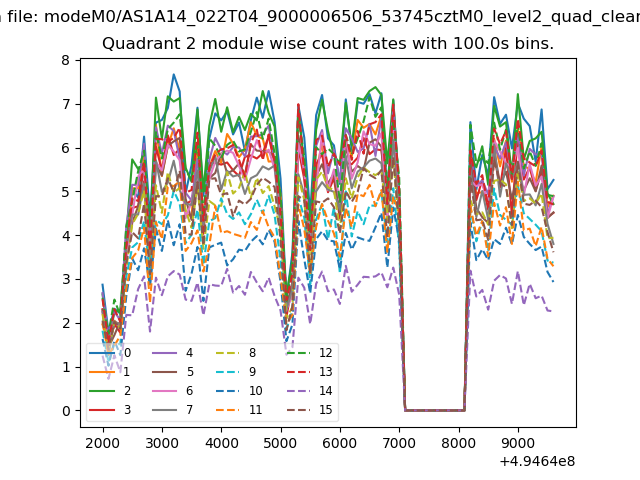
| Module-wise count rates for Quadrant B Data is divided into 100 sec bins |
 |
 |
| Module-wise count rates for Quadrant C Data is divided into 100 sec bins |
 |
 |
| Module-wise count rates for Quadrant D Data is divided into 100 sec bins |
 |
 |
| Parameter | Plot |
|---|---|
| CZT HV Monitor | 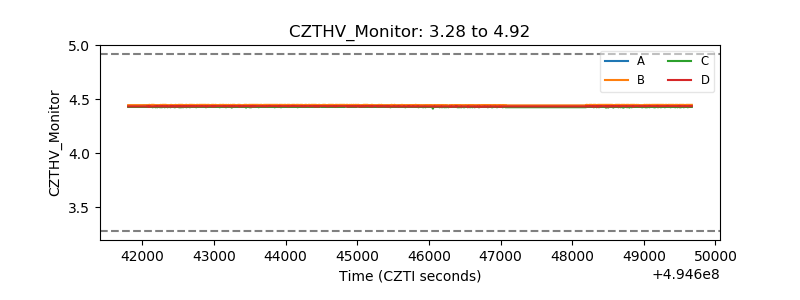 |
| D_VDD | 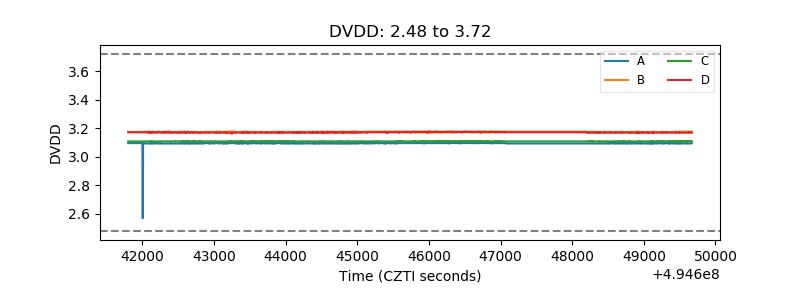 |
| Temperature 1 | 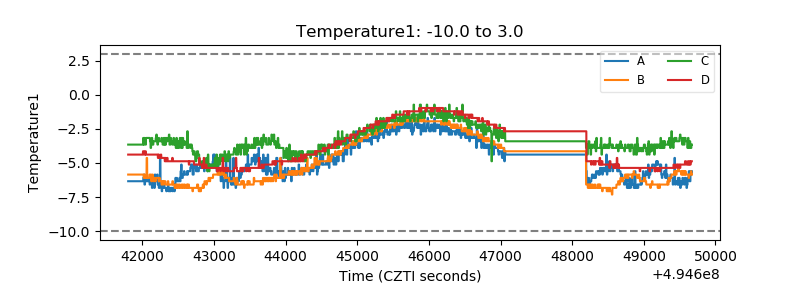 |
| Veto HV Monitor | 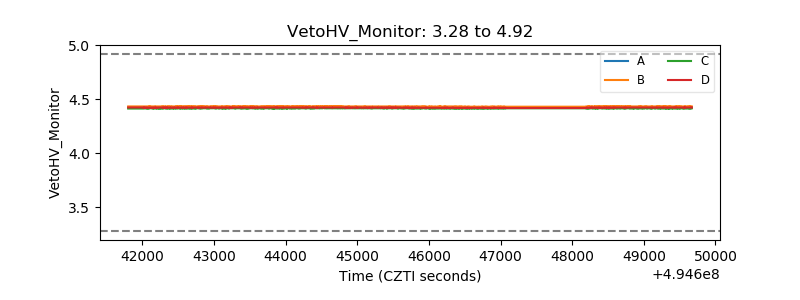 |
| Veto LLD | 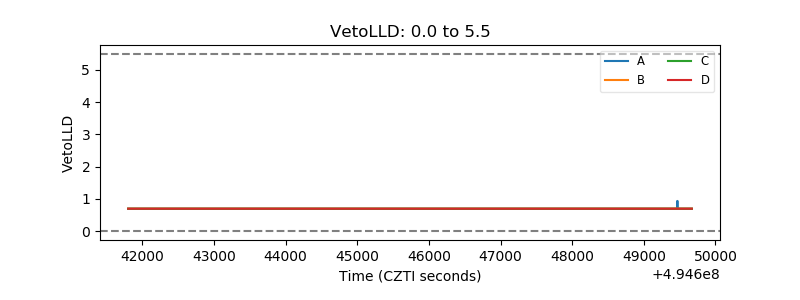 |
| Alpha Counter | 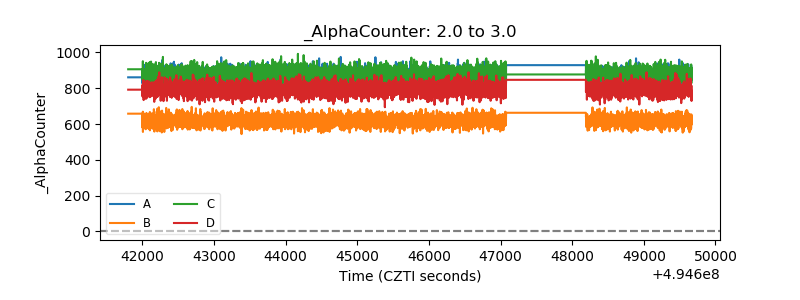 |
| _CPM_Rate | 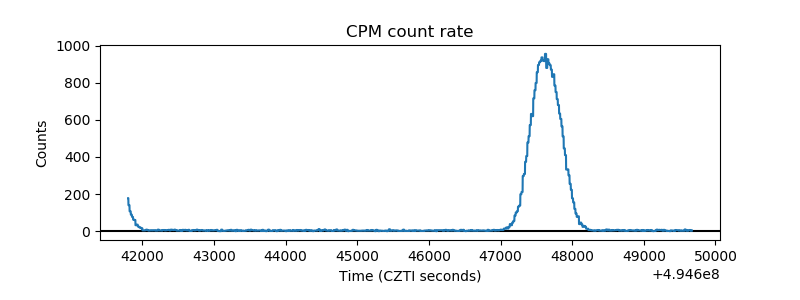 |
| CZT Counter | 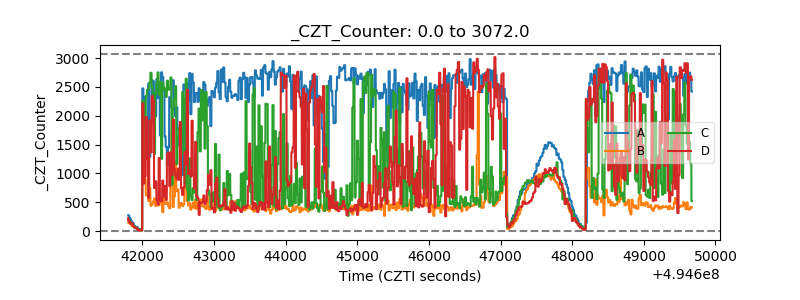 |
| +2.5 Volts monitor | 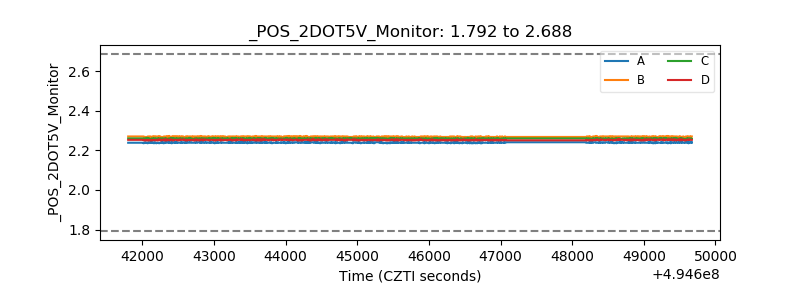 |
| +5 Volts monitor |  |
| _ROLL_ROT | 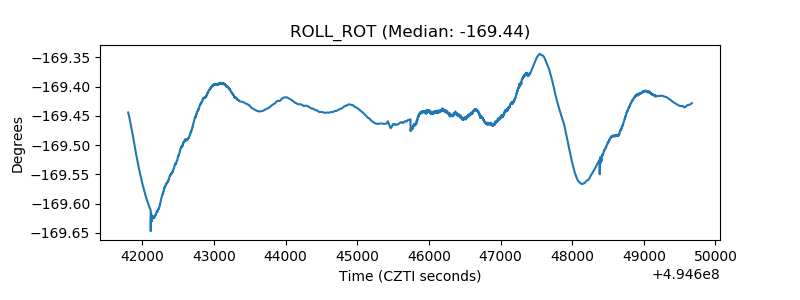 |
| _Roll_DEC | 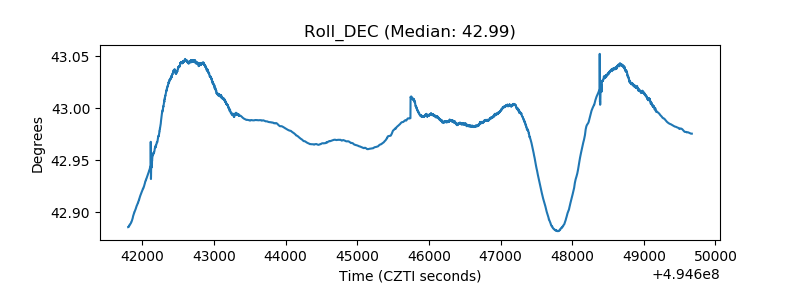 |
| _Roll_RA | 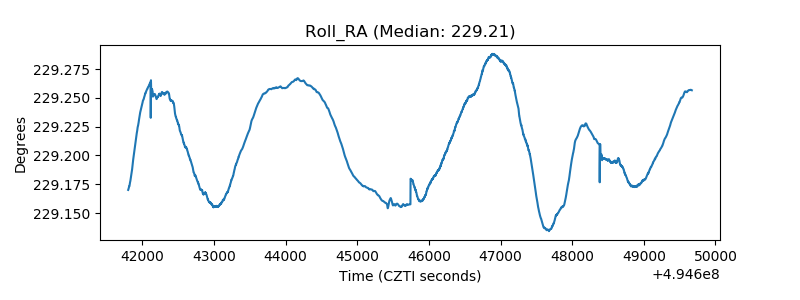 |
| Veto Counter | 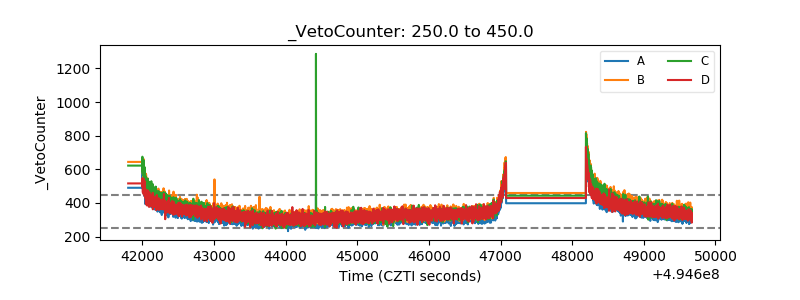 |