| Param | Original file | Final file |
|---|---|---|
| Filename | modeM0/AS1A14_022T04_9000006506_53746cztM0_level2.fits | modeM0/AS1A14_022T04_9000006506_53746cztM0_level2_quad_clean.evt |
| Size (bytes) | 999,800,640 | 72,478,080 |
| Size | 953.5 MB | 69.1 MB |
| Events in quadrant A | 15,862,738 | 111,740 |
| Events in quadrant B | 3,079,550 | 697,167 |
| Events in quadrant C | 9,523,391 | 458,856 |
| Events in quadrant D | 8,037,444 | 469,862 |
| Mode M0 | |||
|---|---|---|---|
| Quadrant | BADHDUFLAG | Total packets | Discarded packets |
| A | 0 | 51663 | 2 |
| B | 0 | 13844 | 2 |
| C | 0 | 32829 | 2 |
| D | 0 | 28435 | 2 |
| Mode SS | |||
|---|---|---|---|
| Quadrant | BADHDUFLAG | Total packets | Discarded packets |
| A | 0 | 132 | 0 |
| B | 0 | 132 | 0 |
| C | 0 | 132 | 0 |
| D | 0 | 132 | 0 |
| Mode M9 | |||
|---|---|---|---|
| Quadrant | BADHDUFLAG | Total packets | Discarded packets |
| A | 0 | 13 | 0 |
| B | 0 | 14 | 0 |
| C | 0 | 14 | 0 |
| D | 0 | 14 | 0 |
| Quadrant | Total seconds | Saturated seconds | Saturation percentage |
|---|---|---|---|
| A | 6553 | 5609 | 85.594384% |
| B | 6553 | 124 | 1.892263% |
| C | 6553 | 2106 | 32.137952% |
| D | 6553 | 1445 | 22.050969% |
Noise dominated data is calculated using 1-second bins in cleaned event files. If a bin has >2000 counts, and if more than 50% of those come from <1% of pixels, then it is considered to be noise-dominated and hence unusable.
| Quadrant | # 1 sec bins | Bins with >0 counts | Bins with >2000 counts | High rate bins dominated by noise | Noise dominated (total time) | Noise dominated (detector-on time) | Marked lightcurve |
|---|---|---|---|---|---|---|---|
| A | 7687 | 6552 | 5463 | 5463 | 71.07% | 83.38% | 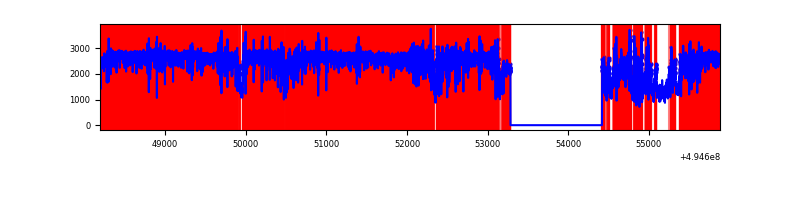 |
| B | 7688 | 6553 | 3 | 3 | 0.04% | 0.05% | 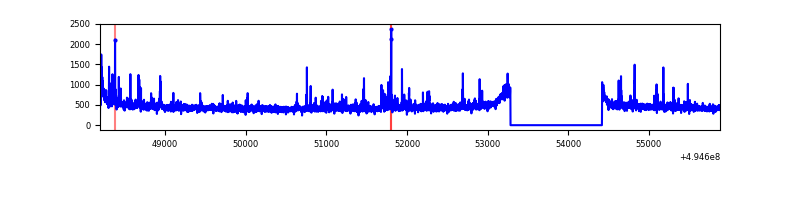 |
| C | 7688 | 6553 | 1769 | 1769 | 23.01% | 27.00% | 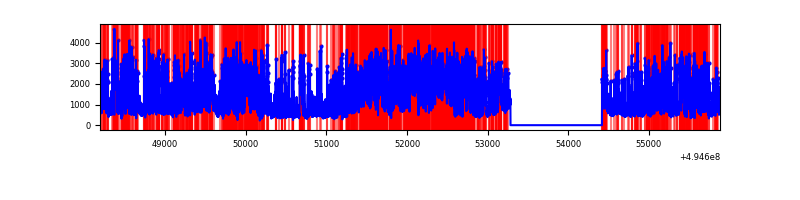 |
| D | 7688 | 6553 | 1280 | 1280 | 16.65% | 19.53% | 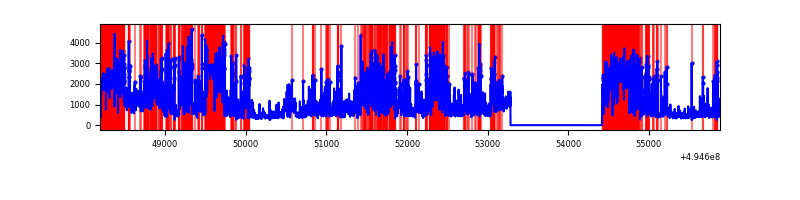 |
Top three noisy pixels from each quadrant. If the there are fewer than three noisy pixels in the level2.evt file, extra rows are filled as -1
| Pixel properties | Quadrant properties | ||||||
|---|---|---|---|---|---|---|---|
| Quadrant | DetID | PixID | Counts | Sigma | Mean | Median | Sigma |
| A | 3 | 63 | 13791994 | 150433.37 | 367 | 358 | 91.7 |
| A | 4 | 249 | 261474 | 2848.14 | 367 | 358 | 91.7 |
| A | 3 | 78 | 163089 | 1775.0 | 367 | 358 | 91.7 |
| B | 4 | 81 | 48974 | 312.35 | 720 | 695 | 154.6 |
| B | 4 | 171 | 37011 | 234.95 | 720 | 695 | 154.6 |
| B | 0 | 213 | 28005 | 176.69 | 720 | 695 | 154.6 |
| C | 15 | 224 | 5379145 | 32248.29 | 605 | 598 | 166.8 |
| C | 12 | 252 | 377755 | 2261.33 | 605 | 598 | 166.8 |
| C | 13 | 3 | 362795 | 2171.63 | 605 | 598 | 166.8 |
| D | 1 | 241 | 1720151 | 9690.42 | 614 | 585 | 177.5 |
| D | 2 | 172 | 1118981 | 6302.6 | 614 | 585 | 177.5 |
| D | 7 | 30 | 1016275 | 5723.81 | 614 | 585 | 177.5 |
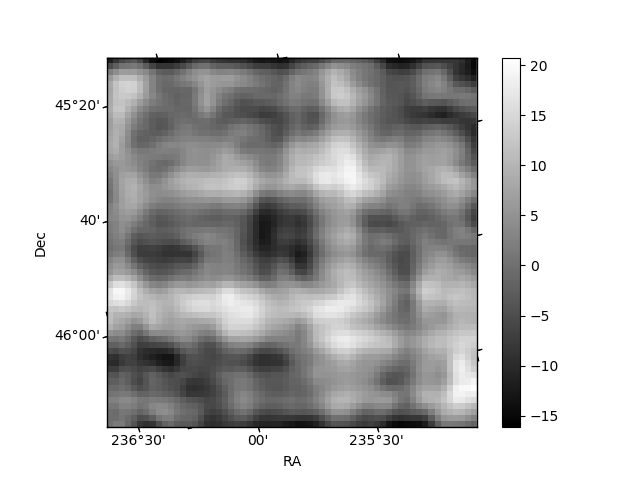
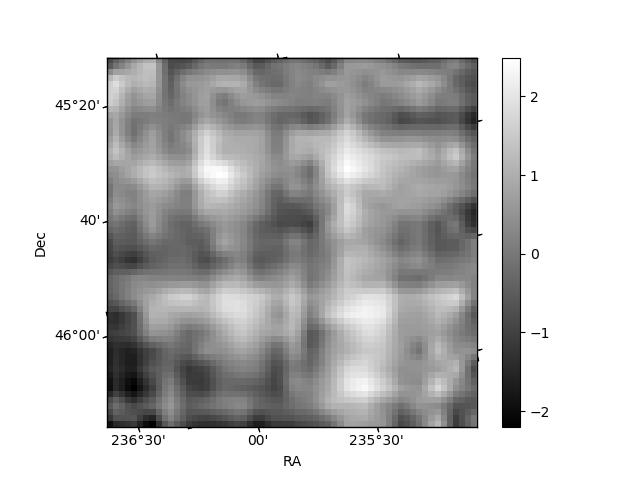
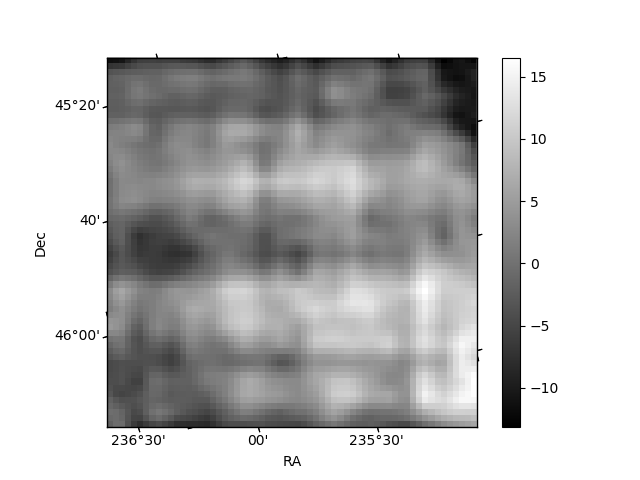
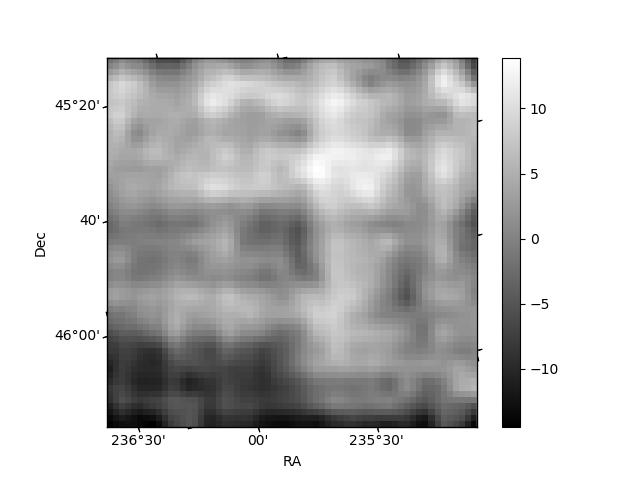
Histogram calculated using DETX and DETY for each event in the final _common_clean file
| Quadrant A | 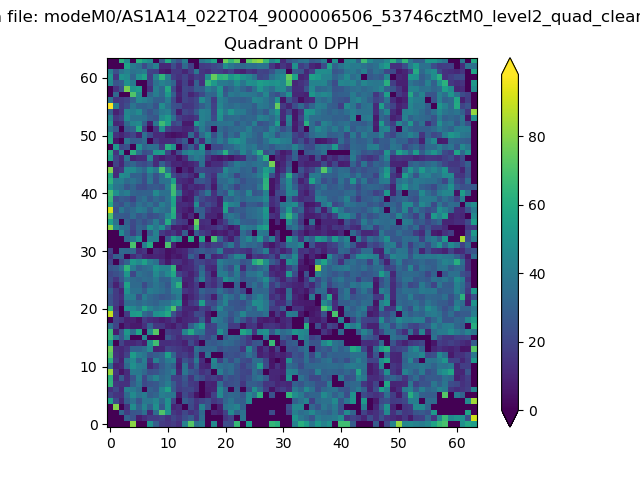 |
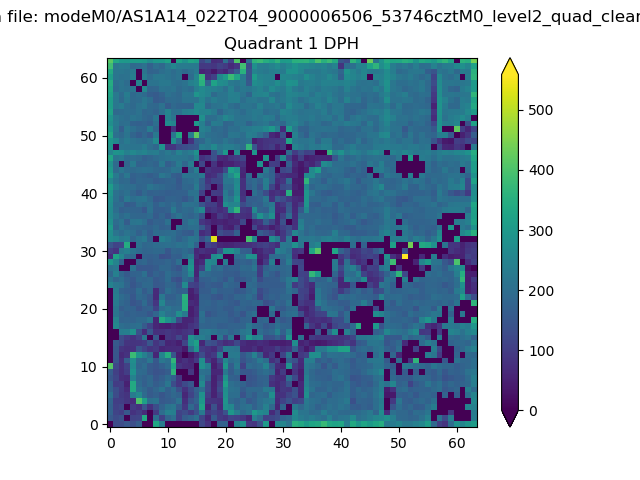 |
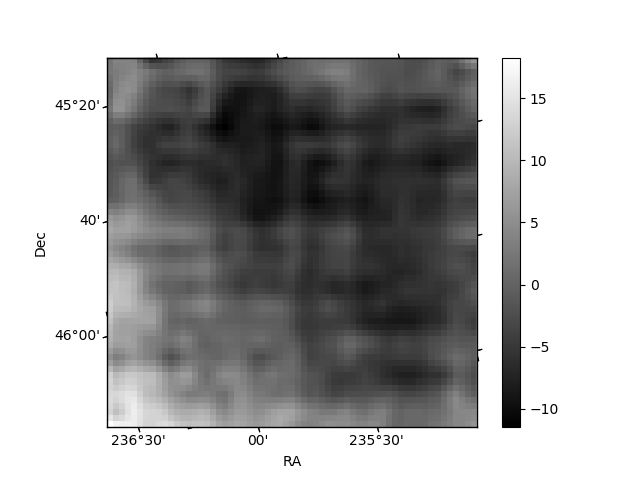
Quadrant B |
|---|---|---|---|
| Quadrant D | 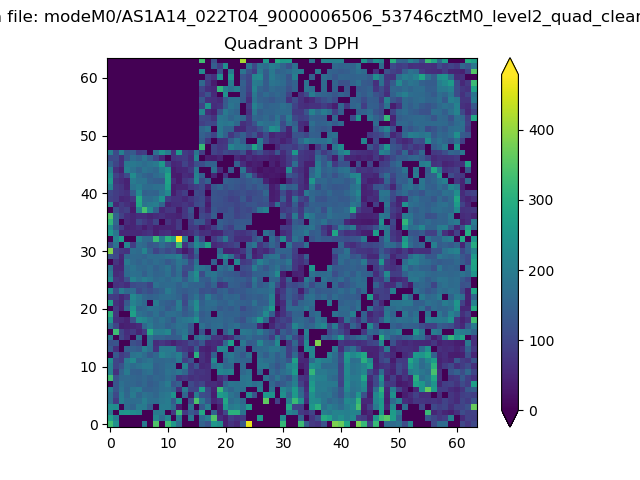 |
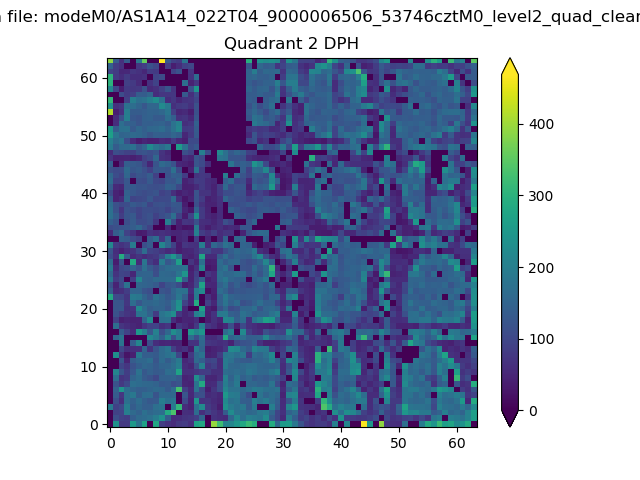 |
Quadrant C |
| Plot type | Count rate plots | Images |
|---|---|---|
| Comparison with Poisson distribution Blue bars denote a histogram of data divided into 1 sec bins. Red curve is a Poisson curve with rate = median count rate of data. |
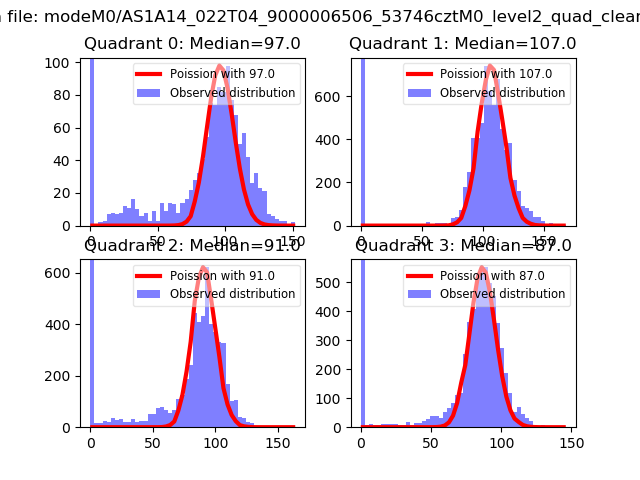 |
 |
| Quadrant-wise count rates Data is divided into 100 sec bins |
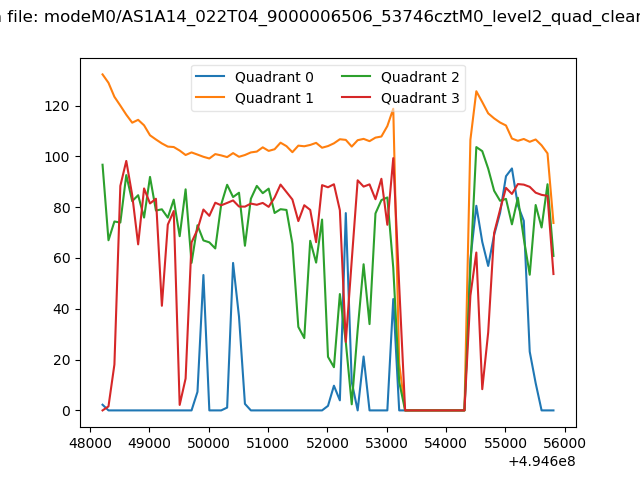 |
|
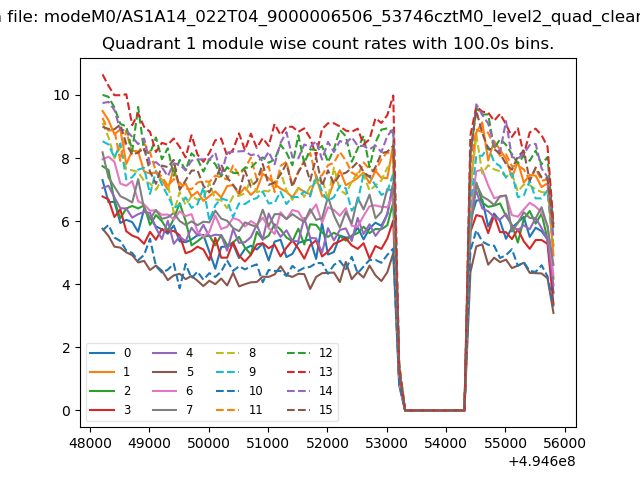
| Module-wise count rates for Quadrant A Data is divided into 100 sec bins |
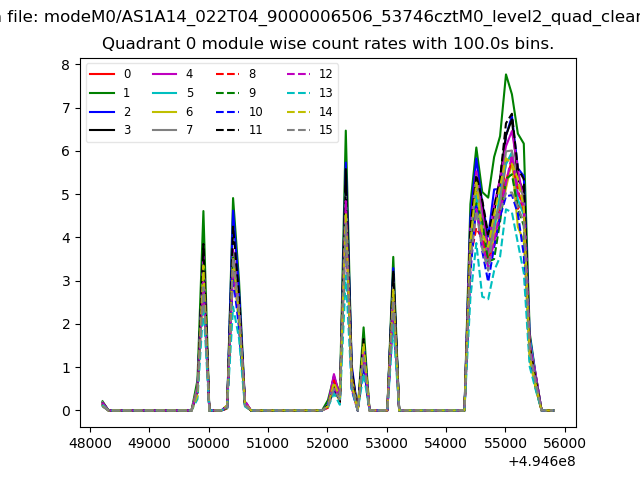 |
 |
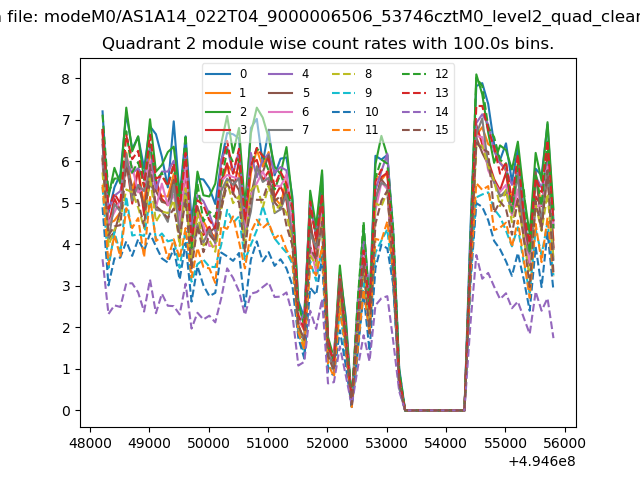
| Module-wise count rates for Quadrant B Data is divided into 100 sec bins |
 |
 |
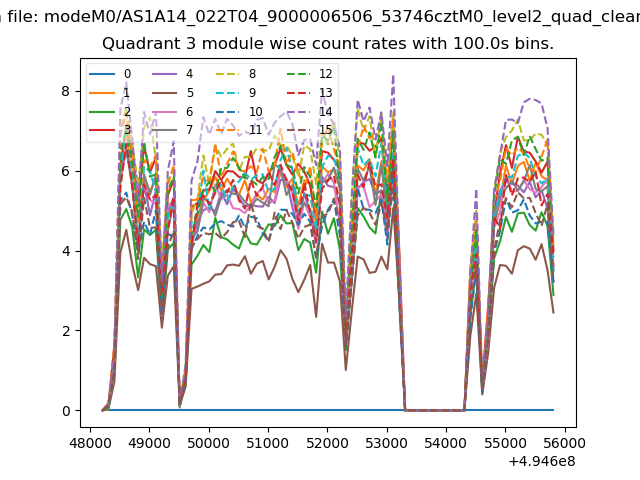
| Module-wise count rates for Quadrant C Data is divided into 100 sec bins |
 |
 |
| Module-wise count rates for Quadrant D Data is divided into 100 sec bins |
 |
 |
| Parameter | Plot |
|---|---|
| CZT HV Monitor | 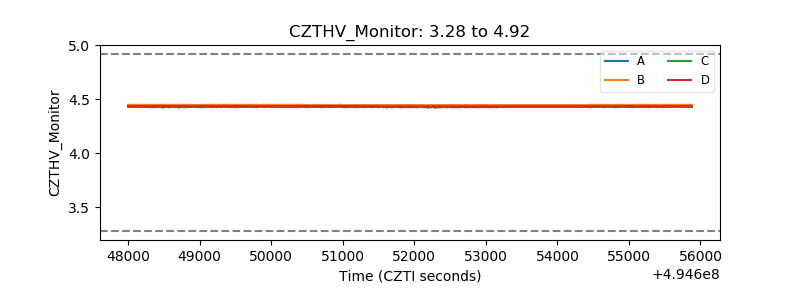 |
| D_VDD | 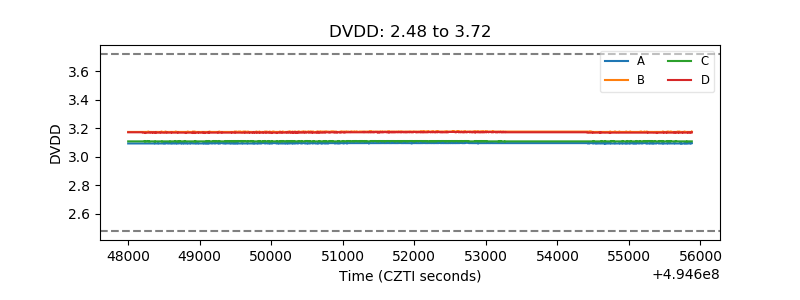 |
| Temperature 1 | 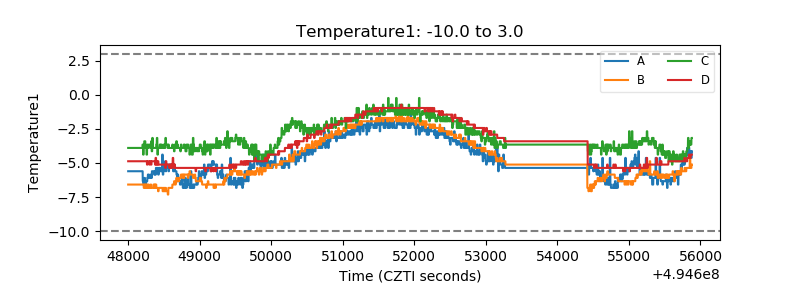 |
| Veto HV Monitor | 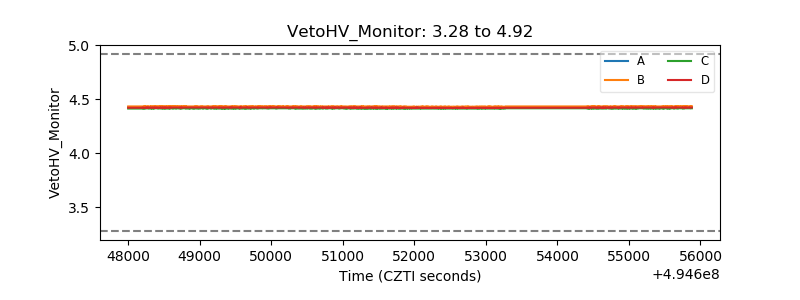 |
| Veto LLD | 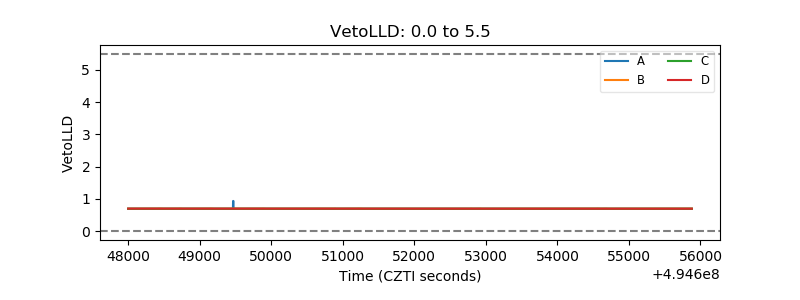 |
| Alpha Counter | 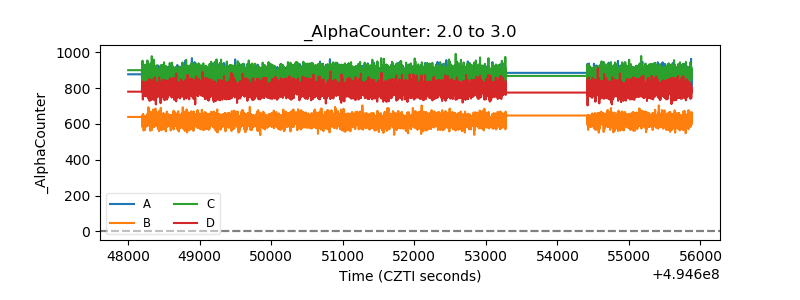 |
| _CPM_Rate | 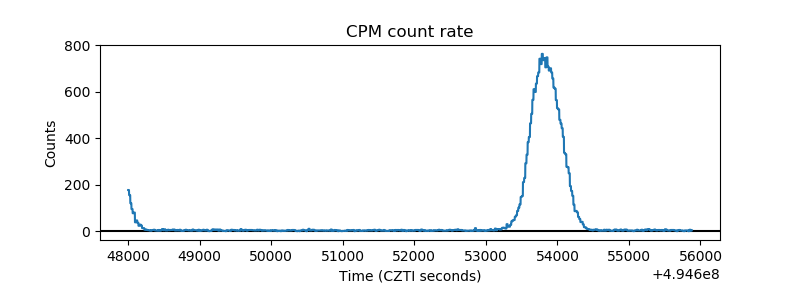 |
| CZT Counter | 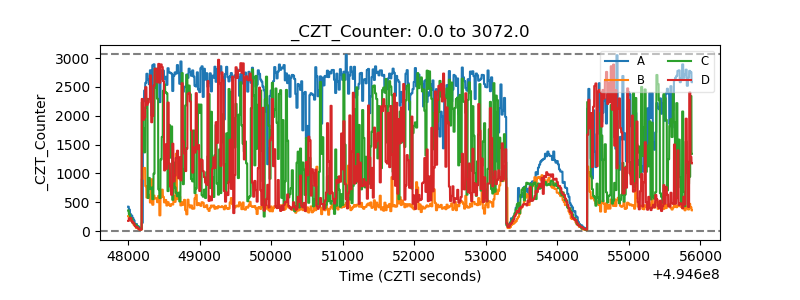 |
| +2.5 Volts monitor |  |
| +5 Volts monitor |  |
| _ROLL_ROT | 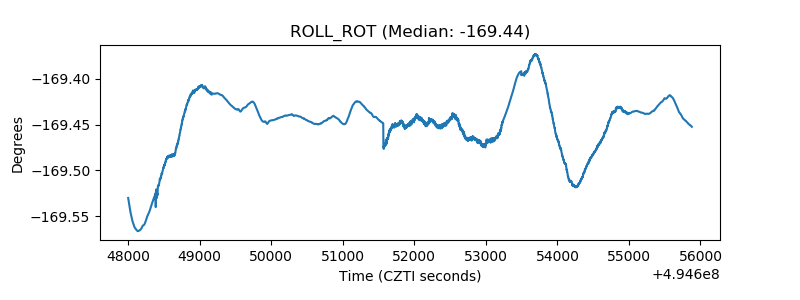 |
| _Roll_DEC | 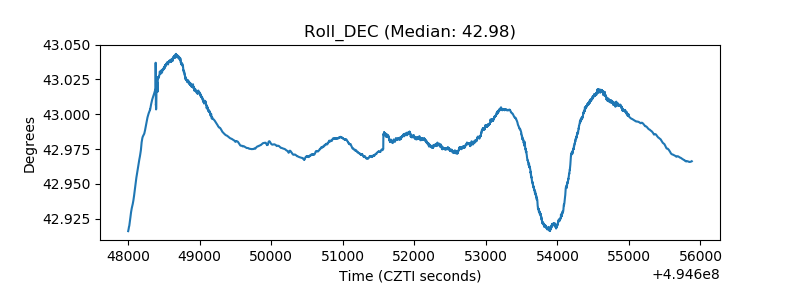 |
| _Roll_RA | 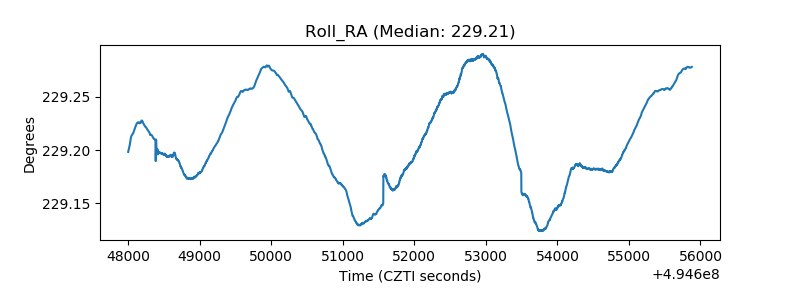 |
| Veto Counter | 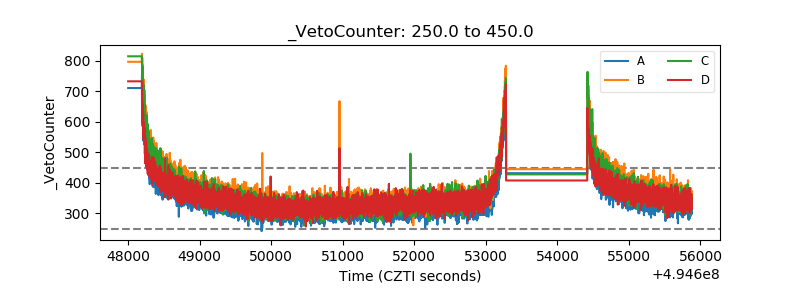 |