| Param | Original file | Final file |
|---|---|---|
| Filename | modeM0/AS1A14_022T04_9000006506_53747cztM0_level2.fits | modeM0/AS1A14_022T04_9000006506_53747cztM0_level2_quad_clean.evt |
| Size (bytes) | 970,865,280 | 71,801,280 |
| Size | 925.9 MB | 68.5 MB |
| Events in quadrant A | 15,985,004 | 79,449 |
| Events in quadrant B | 3,683,952 | 671,513 |
| Events in quadrant C | 8,805,172 | 483,380 |
| Events in quadrant D | 6,958,485 | 483,612 |
| Mode M0 | |||
|---|---|---|---|
| Quadrant | BADHDUFLAG | Total packets | Discarded packets |
| A | 0 | 52105 | 2 |
| B | 0 | 15599 | 2 |
| C | 0 | 30651 | 2 |
| D | 0 | 25166 | 2 |
| Mode SS | |||
|---|---|---|---|
| Quadrant | BADHDUFLAG | Total packets | Discarded packets |
| A | 0 | 132 | 0 |
| B | 0 | 132 | 0 |
| C | 0 | 132 | 0 |
| D | 0 | 132 | 0 |
| Mode M9 | |||
|---|---|---|---|
| Quadrant | BADHDUFLAG | Total packets | Discarded packets |
| A | 0 | 17 | 0 |
| B | 0 | 17 | 0 |
| C | 0 | 18 | 0 |
| D | 0 | 18 | 0 |
| Quadrant | Total seconds | Saturated seconds | Saturation percentage |
|---|---|---|---|
| A | 6537 | 5870 | 89.796543% |
| B | 6537 | 315 | 4.818724% |
| C | 6537 | 1764 | 26.984855% |
| D | 6537 | 1257 | 19.229004% |
Noise dominated data is calculated using 1-second bins in cleaned event files. If a bin has >2000 counts, and if more than 50% of those come from <1% of pixels, then it is considered to be noise-dominated and hence unusable.
| Quadrant | # 1 sec bins | Bins with >0 counts | Bins with >2000 counts | High rate bins dominated by noise | Noise dominated (total time) | Noise dominated (detector-on time) | Marked lightcurve |
|---|---|---|---|---|---|---|---|
| A | 7636 | 6536 | 5721 | 5721 | 74.92% | 87.53% | 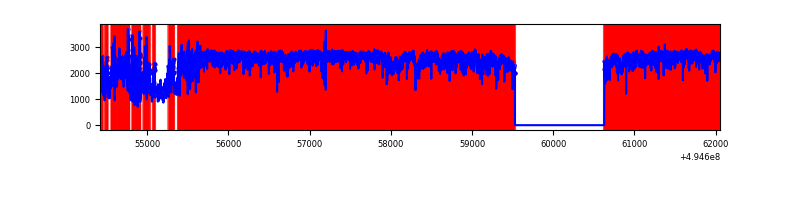 |
| B | 7637 | 6537 | 114 | 114 | 1.49% | 1.74% | 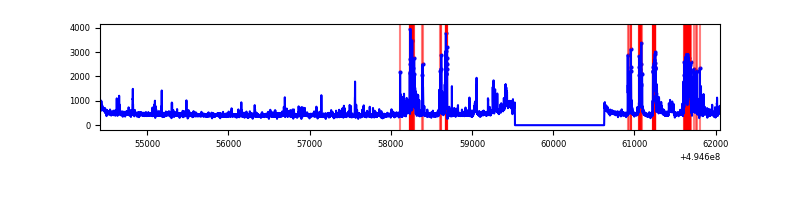 |
| C | 7637 | 6538 | 1555 | 1555 | 20.36% | 23.78% | 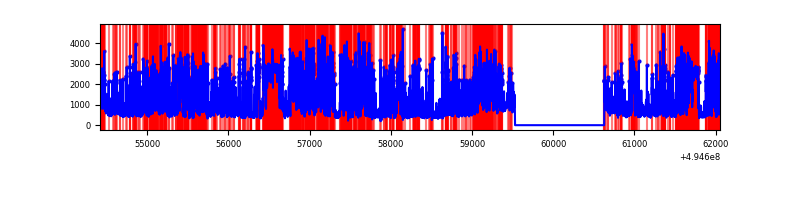 |
| D | 7637 | 6538 | 1062 | 1062 | 13.91% | 16.24% | 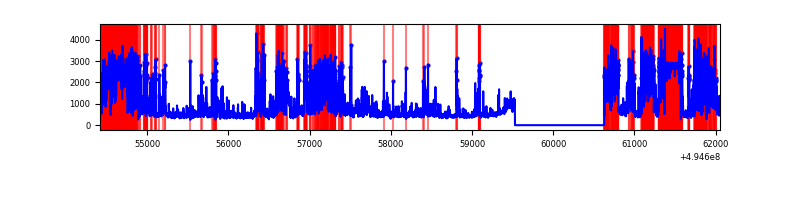 |
Top three noisy pixels from each quadrant. If the there are fewer than three noisy pixels in the level2.evt file, extra rows are filled as -1
| Pixel properties | Quadrant properties | ||||||
|---|---|---|---|---|---|---|---|
| Quadrant | DetID | PixID | Counts | Sigma | Mean | Median | Sigma |
| A | 3 | 63 | 13575075 | 222460.91 | 235 | 229 | 61.0 |
| A | 3 | 78 | 1061347 | 17389.32 | 235 | 229 | 61.0 |
| A | 4 | 249 | 242952 | 3977.68 | 235 | 229 | 61.0 |
| B | 6 | 255 | 493508 | 3261.43 | 707 | 682 | 151.1 |
| B | 5 | 185 | 220934 | 1457.59 | 707 | 682 | 151.1 |
| B | 0 | 213 | 38373 | 249.43 | 707 | 682 | 151.1 |
| C | 15 | 224 | 3777425 | 22136.53 | 615 | 611 | 170.6 |
| C | 1 | 241 | 2064248 | 12095.32 | 615 | 611 | 170.6 |
| C | 12 | 252 | 91642 | 533.55 | 615 | 611 | 170.6 |
| D | 8 | 176 | 2081573 | 11692.48 | 631 | 601 | 178.0 |
| D | 2 | 172 | 909304 | 5105.78 | 631 | 601 | 178.0 |
| D | 7 | 30 | 692669 | 3888.56 | 631 | 601 | 178.0 |
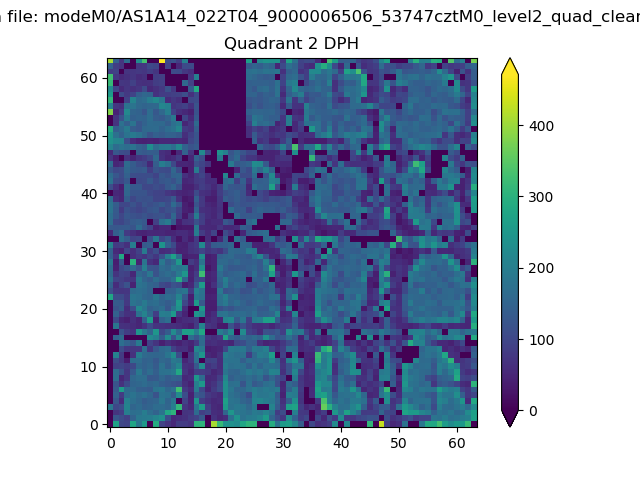
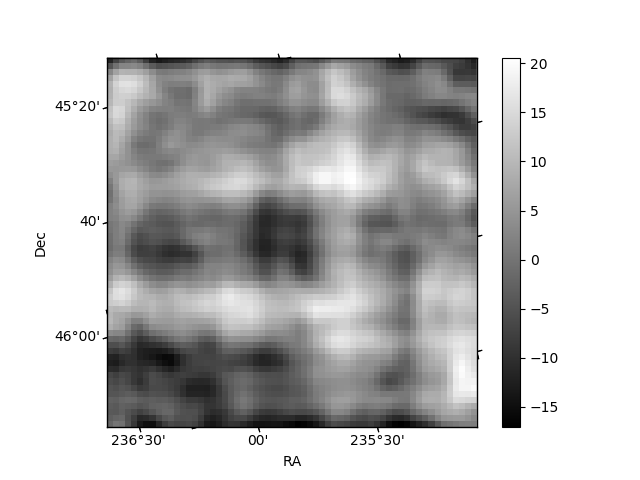
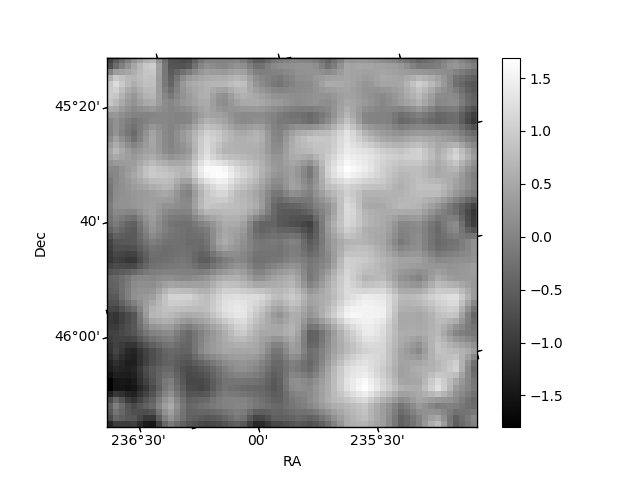
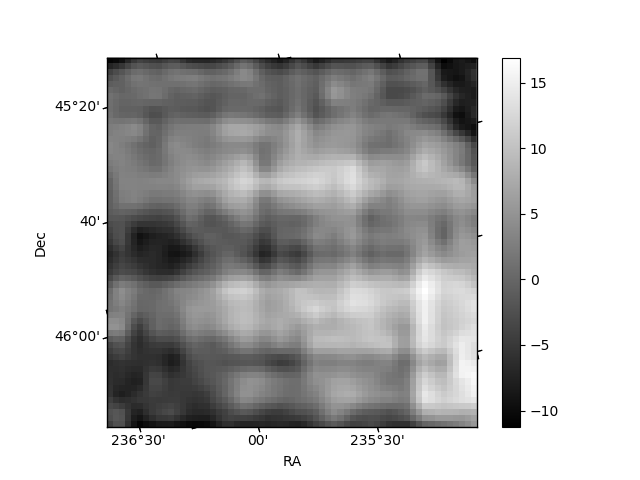
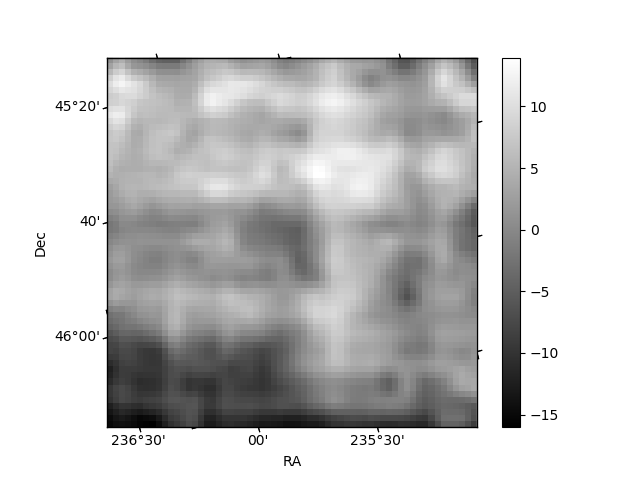
Histogram calculated using DETX and DETY for each event in the final _common_clean file
| Quadrant A | 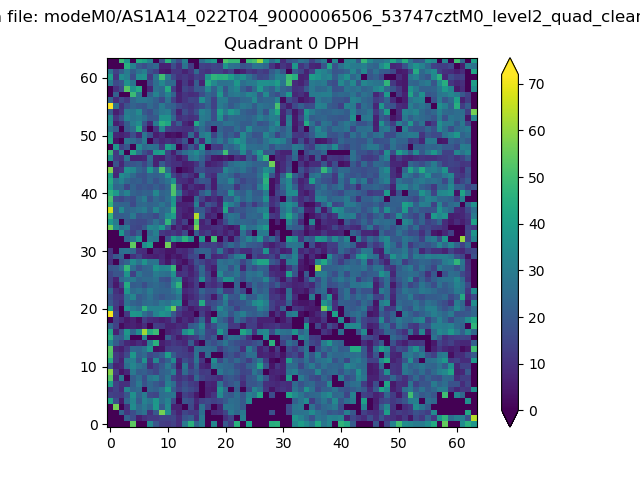 |
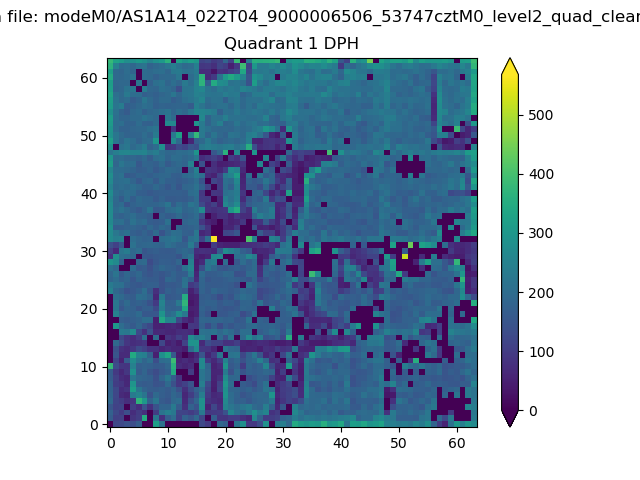 |
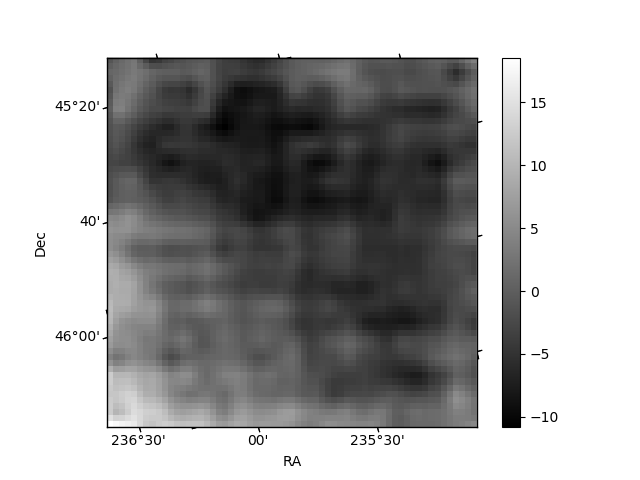
Quadrant B |
|---|---|---|---|
| Quadrant D | 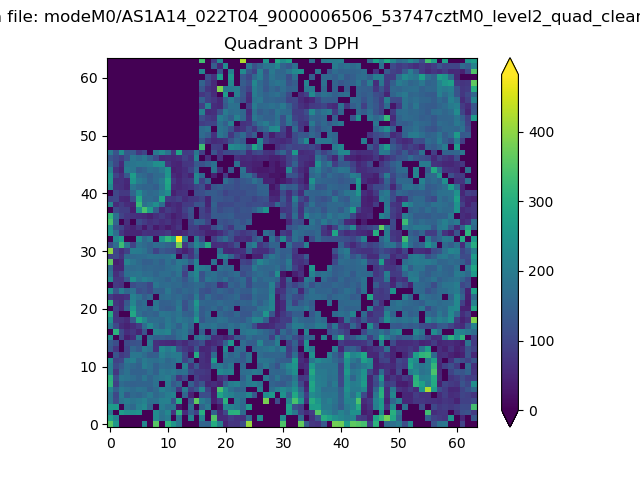 |
 |
Quadrant C |
| Plot type | Count rate plots | Images |
|---|---|---|
| Comparison with Poisson distribution Blue bars denote a histogram of data divided into 1 sec bins. Red curve is a Poisson curve with rate = median count rate of data. |
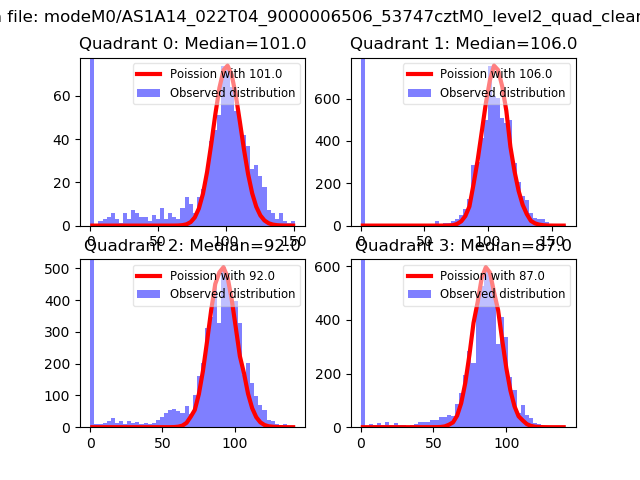 |
 |
| Quadrant-wise count rates Data is divided into 100 sec bins |
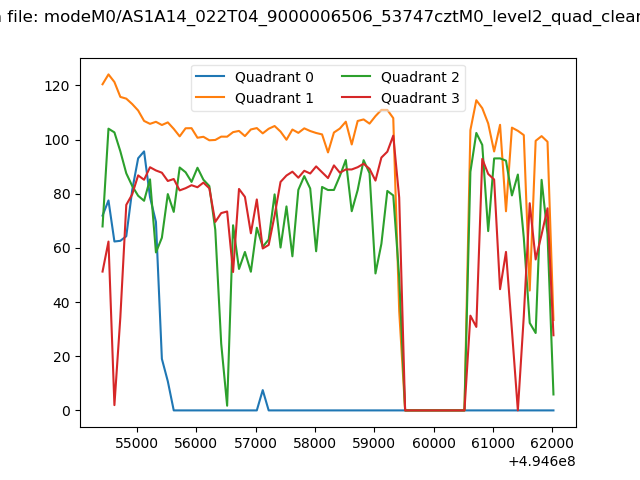 |
|
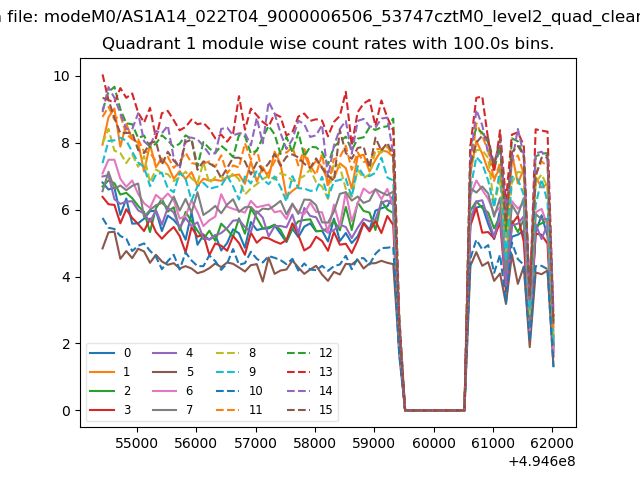
| Module-wise count rates for Quadrant A Data is divided into 100 sec bins |
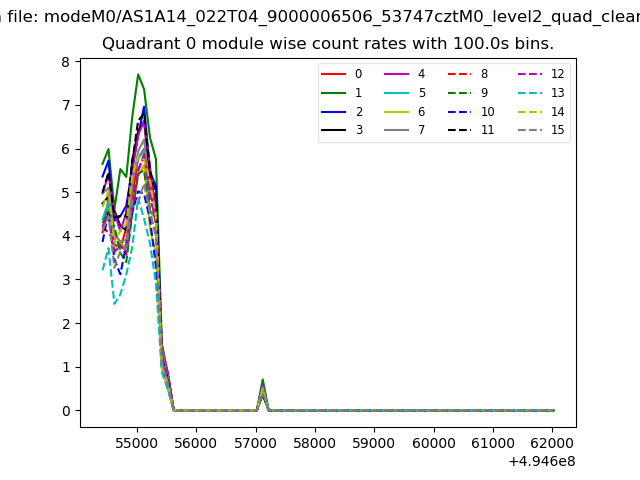 |
 |
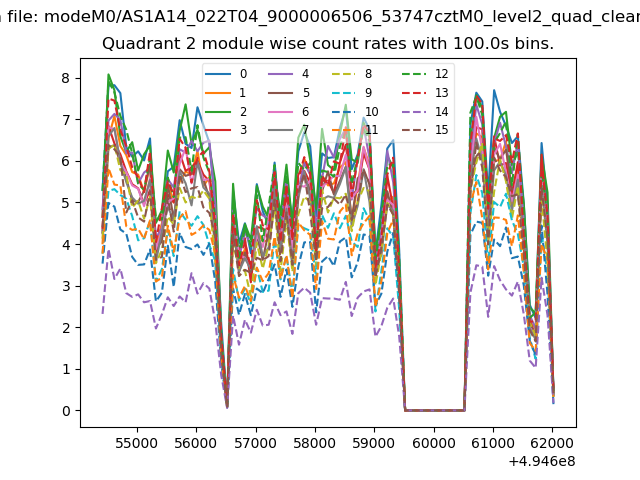
| Module-wise count rates for Quadrant B Data is divided into 100 sec bins |
 |
 |
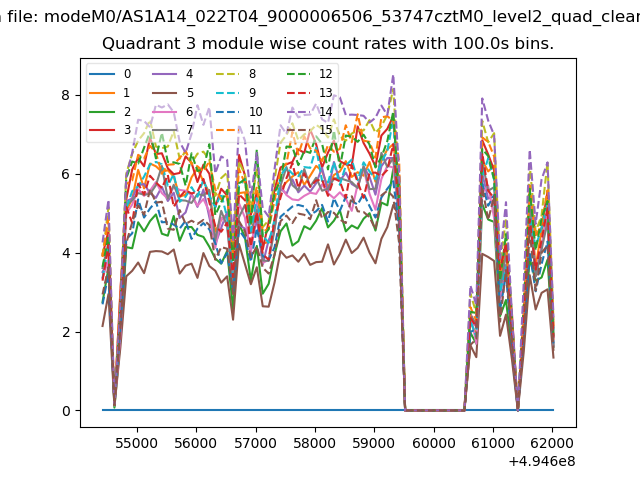
| Module-wise count rates for Quadrant C Data is divided into 100 sec bins |
 |
 |
| Module-wise count rates for Quadrant D Data is divided into 100 sec bins |
 |
 |
| Parameter | Plot |
|---|---|
| CZT HV Monitor | 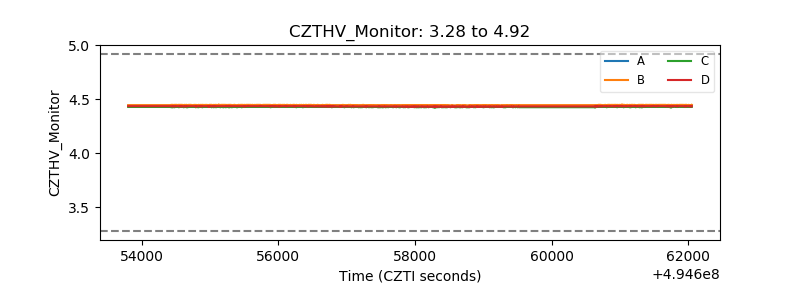 |
| D_VDD | 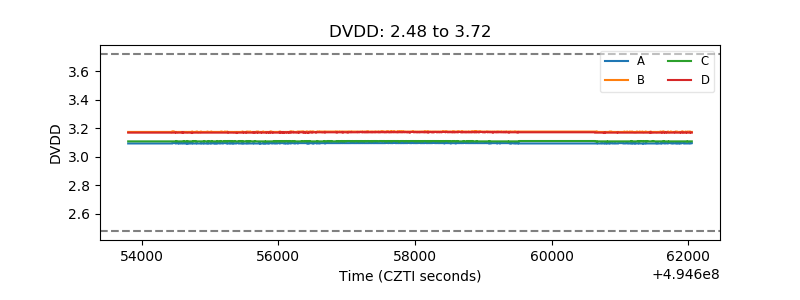 |
| Temperature 1 | 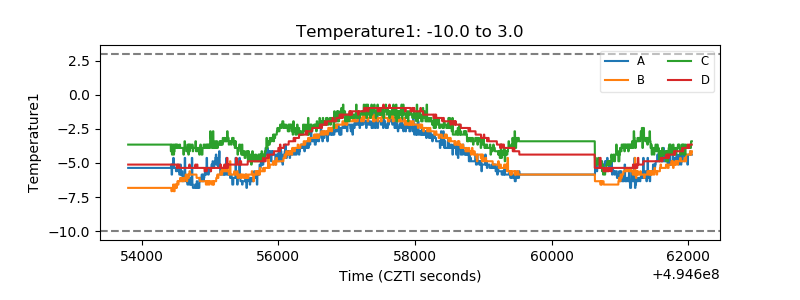 |
| Veto HV Monitor | 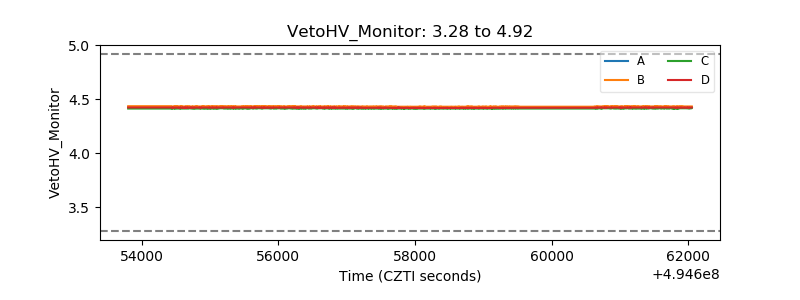 |
| Veto LLD | 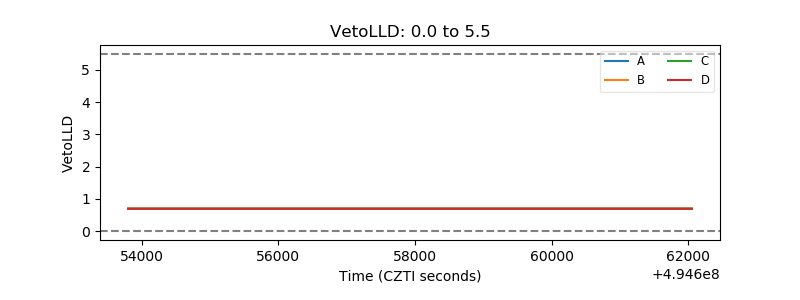 |
| Alpha Counter | 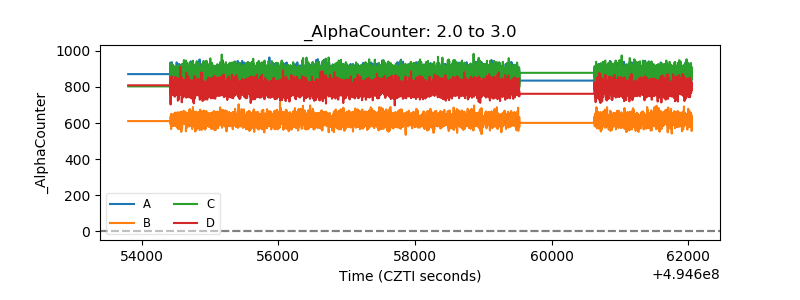 |
| _CPM_Rate | 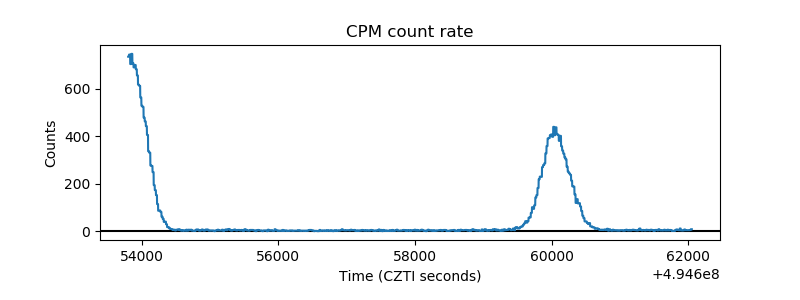 |
| CZT Counter | 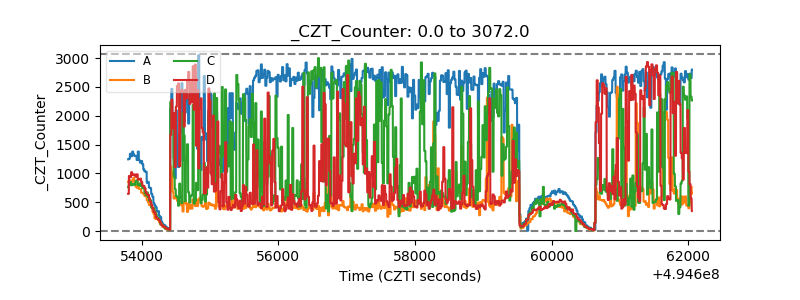 |
| +2.5 Volts monitor | 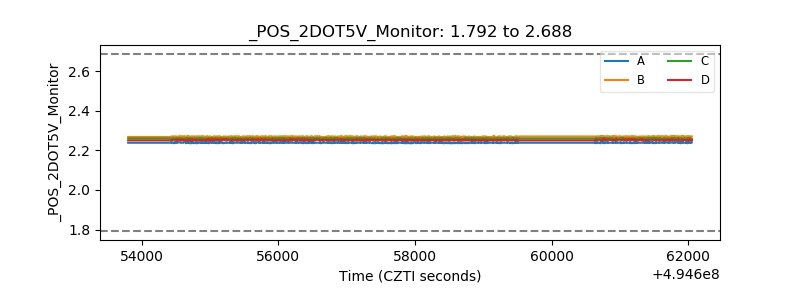 |
| +5 Volts monitor | 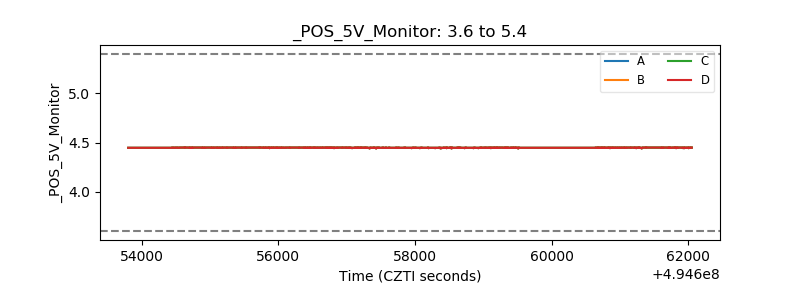 |
| _ROLL_ROT | 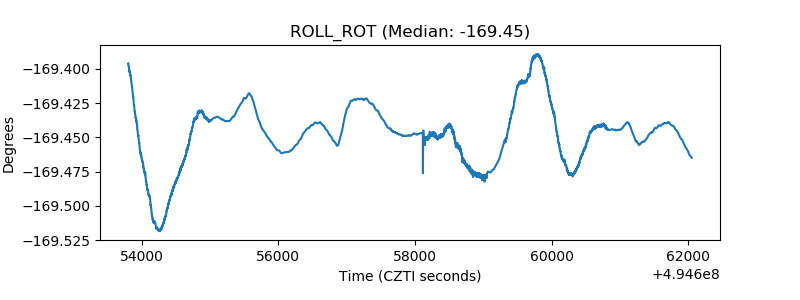 |
| _Roll_DEC | 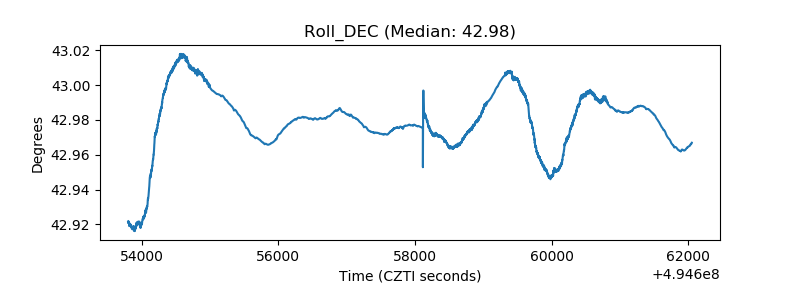 |
| _Roll_RA | 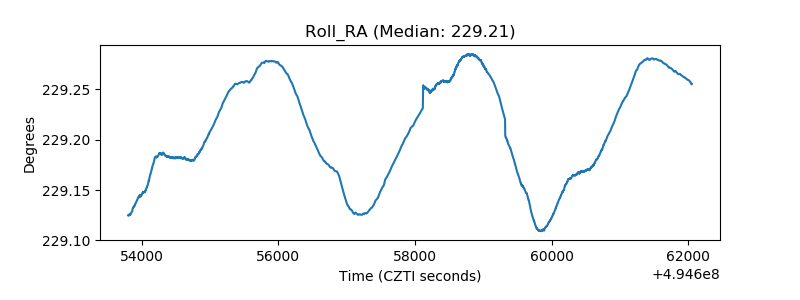 |
| Veto Counter | 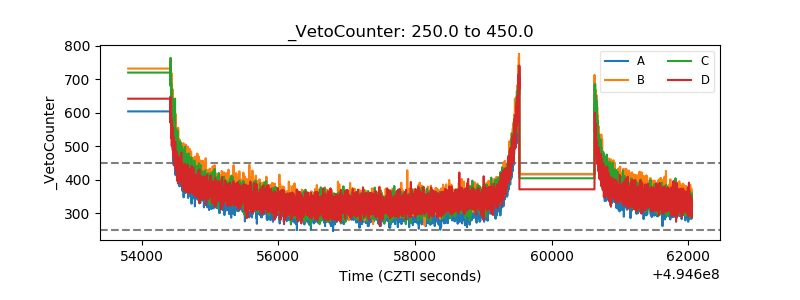 |