| Param | Original file | Final file |
|---|---|---|
| Filename | modeM0/AS1A14_022T04_9000006506_53748cztM0_level2.fits | modeM0/AS1A14_022T04_9000006506_53748cztM0_level2_quad_clean.evt |
| Size (bytes) | 1,000,607,040 | 61,248,960 |
| Size | 954.3 MB | 58.4 MB |
| Events in quadrant A | 16,044,048 | 2,565 |
| Events in quadrant B | 7,035,470 | 472,241 |
| Events in quadrant C | 7,795,197 | 454,520 |
| Events in quadrant D | 5,679,473 | 487,175 |
| Mode M0 | |||
|---|---|---|---|
| Quadrant | BADHDUFLAG | Total packets | Discarded packets |
| A | 0 | 52050 | 1 |
| B | 0 | 25164 | 1 |
| C | 0 | 27517 | 1 |
| D | 0 | 21125 | 1 |
| Mode SS | |||
|---|---|---|---|
| Quadrant | BADHDUFLAG | Total packets | Discarded packets |
| A | 0 | 126 | 0 |
| B | 0 | 126 | 0 |
| C | 0 | 126 | 0 |
| D | 0 | 126 | 0 |
| Mode M9 | |||
|---|---|---|---|
| Quadrant | BADHDUFLAG | Total packets | Discarded packets |
| A | 0 | 10 | 0 |
| B | 0 | 10 | 0 |
| C | 0 | 10 | 0 |
| D | 0 | 10 | 0 |
| Quadrant | Total seconds | Saturated seconds | Saturation percentage |
|---|---|---|---|
| A | 6275 | 6250 | 99.601594% |
| B | 6276 | 1853 | 29.525175% |
| C | 6276 | 1526 | 24.314850% |
| D | 6276 | 725 | 11.551944% |
Noise dominated data is calculated using 1-second bins in cleaned event files. If a bin has >2000 counts, and if more than 50% of those come from <1% of pixels, then it is considered to be noise-dominated and hence unusable.
| Quadrant | # 1 sec bins | Bins with >0 counts | Bins with >2000 counts | High rate bins dominated by noise | Noise dominated (total time) | Noise dominated (detector-on time) | Marked lightcurve |
|---|---|---|---|---|---|---|---|
| A | 7229 | 6274 | 6078 | 6078 | 84.08% | 96.88% | 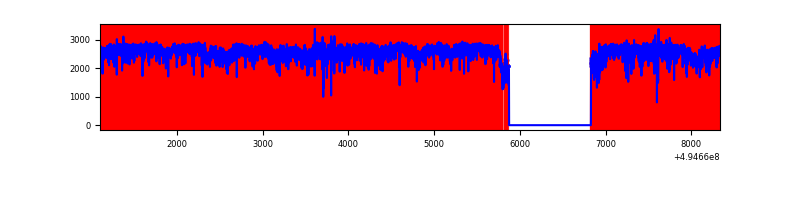 |
| B | 7231 | 6276 | 1419 | 1419 | 19.62% | 22.61% | 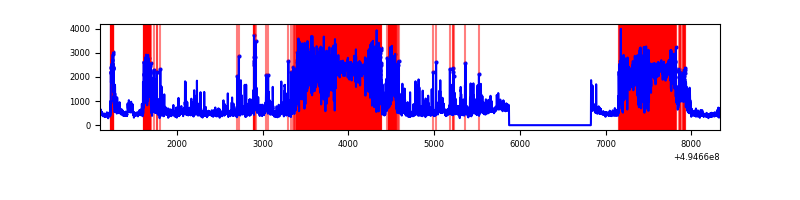 |
| C | 7231 | 6276 | 1260 | 1260 | 17.42% | 20.08% | 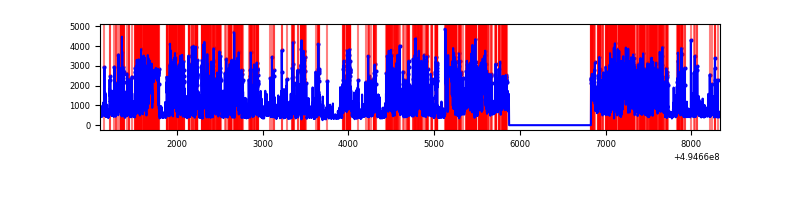 |
| D | 7231 | 6276 | 630 | 630 | 8.71% | 10.04% | 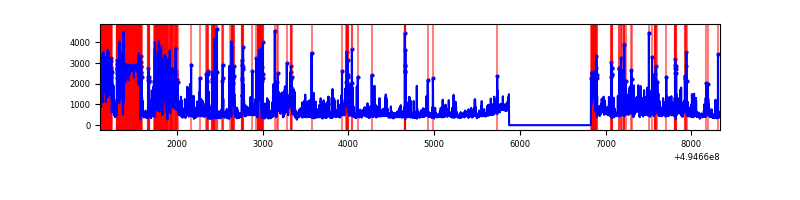 |
Top three noisy pixels from each quadrant. If the there are fewer than three noisy pixels in the level2.evt file, extra rows are filled as -1
| Pixel properties | Quadrant properties | ||||||
|---|---|---|---|---|---|---|---|
| Quadrant | DetID | PixID | Counts | Sigma | Mean | Median | Sigma |
| A | 3 | 78 | 8098146 | 187787.69 | 169 | 164 | 43.1 |
| A | 3 | 63 | 7099581 | 164631.53 | 169 | 164 | 43.1 |
| A | 8 | 249 | 85745 | 1984.58 | 169 | 164 | 43.1 |
| B | 6 | 255 | 4344134 | 34806.15 | 577 | 554 | 124.8 |
| B | 10 | 254 | 107324 | 855.57 | 577 | 554 | 124.8 |
| B | 5 | 250 | 67437 | 535.95 | 577 | 554 | 124.8 |
| C | 15 | 224 | 3547360 | 22325.51 | 577 | 573 | 158.9 |
| C | 1 | 241 | 778839 | 4898.85 | 577 | 573 | 158.9 |
| C | 12 | 2 | 371493 | 2334.78 | 577 | 573 | 158.9 |
| D | 8 | 176 | 1464944 | 8403.48 | 615 | 588 | 174.3 |
| D | 2 | 172 | 1289145 | 7394.63 | 615 | 588 | 174.3 |
| D | 7 | 30 | 115799 | 661.16 | 615 | 588 | 174.3 |
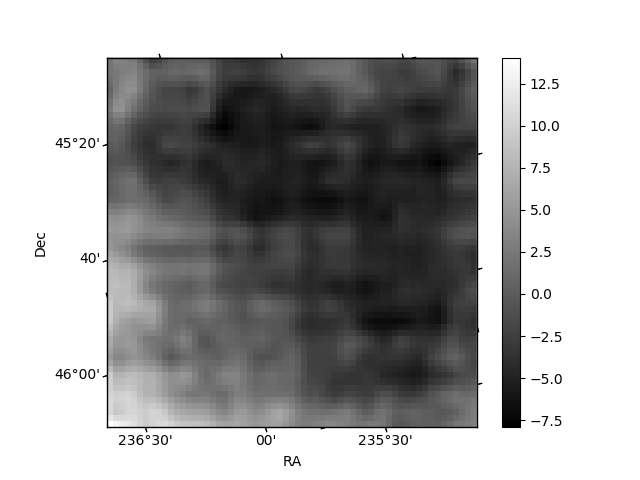
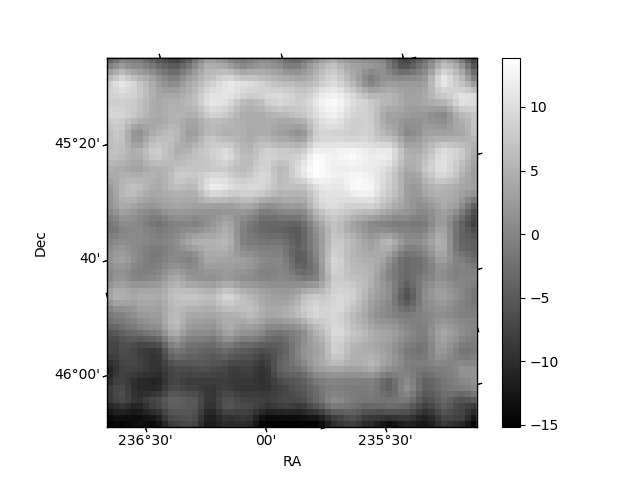
Histogram calculated using DETX and DETY for each event in the final _common_clean file
| Quadrant A | 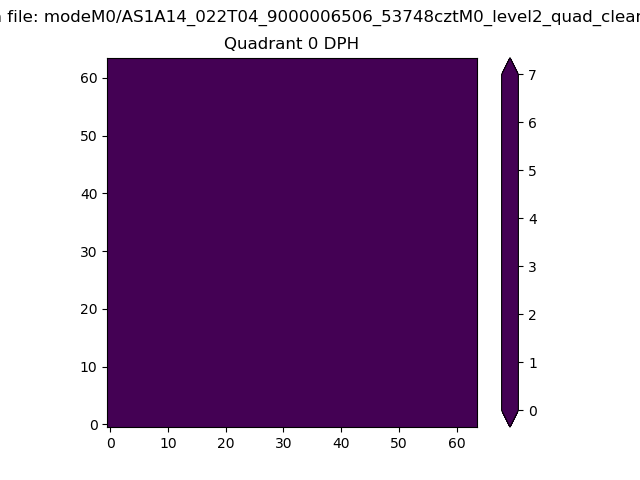 |
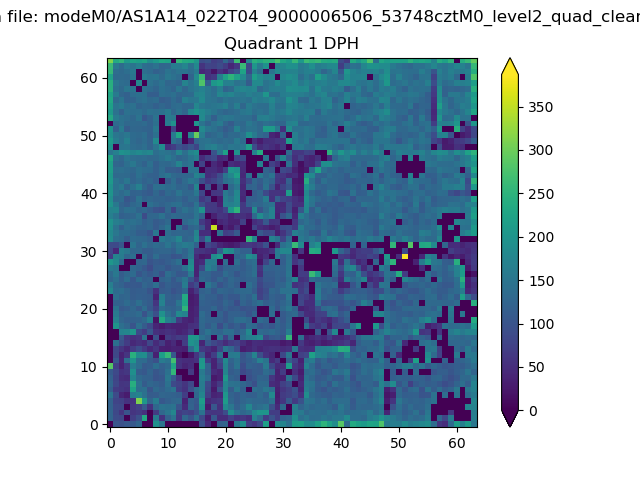 |
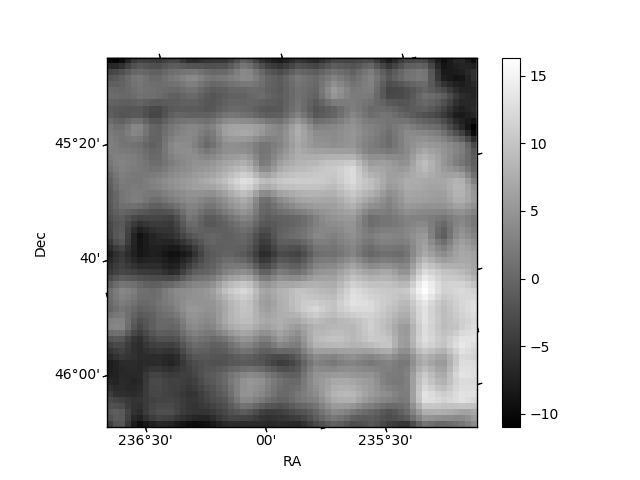
Quadrant B |
|---|---|---|---|
| Quadrant D | 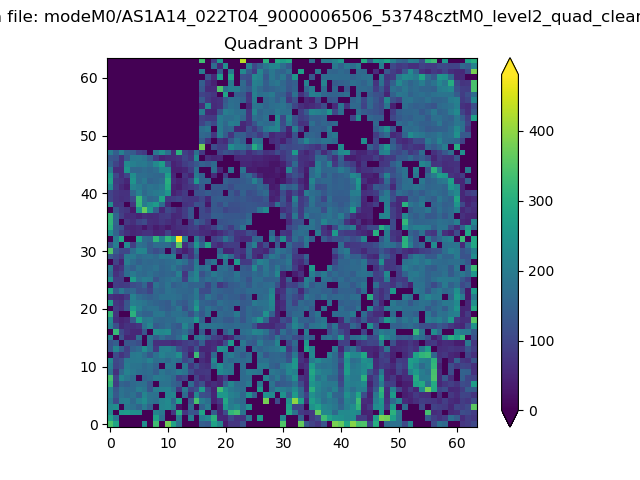 |
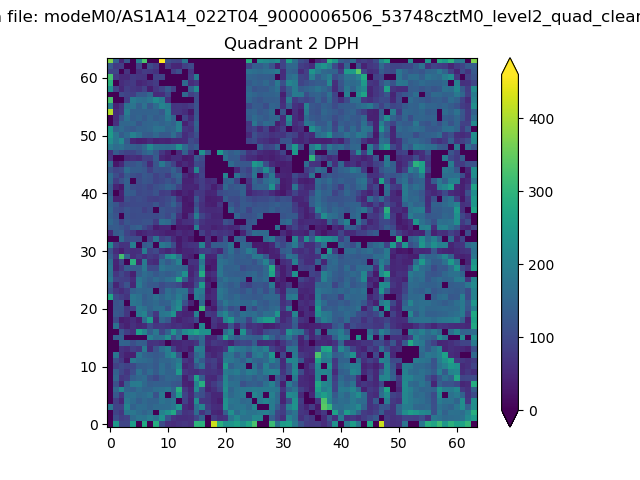 |
Quadrant C |
| Plot type | Count rate plots | Images |
|---|---|---|
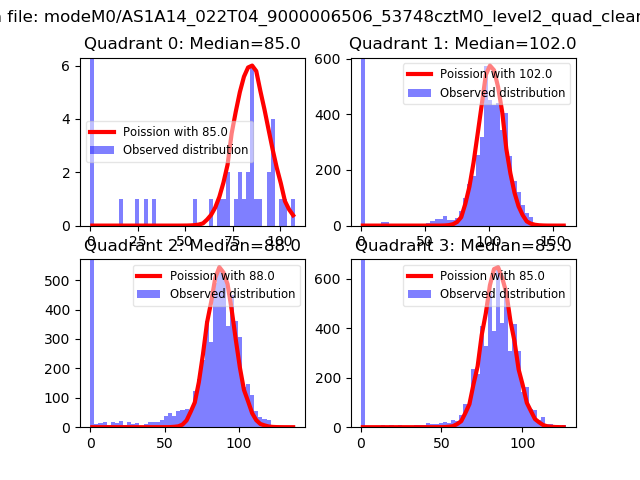
| Comparison with Poisson distribution Blue bars denote a histogram of data divided into 1 sec bins. Red curve is a Poisson curve with rate = median count rate of data. |
 |
 |
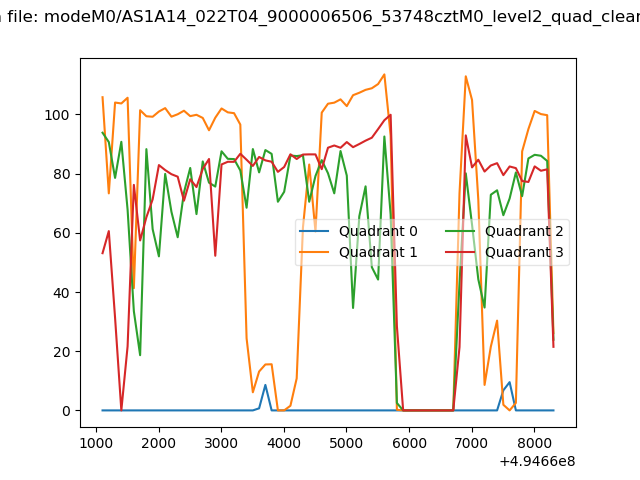
| Quadrant-wise count rates Data is divided into 100 sec bins |
 |
|
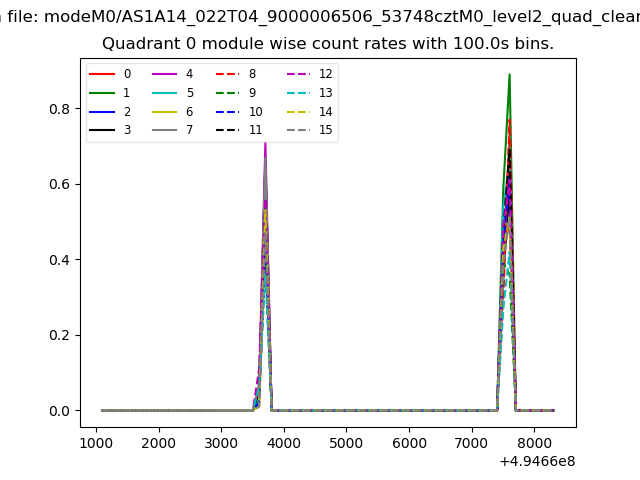
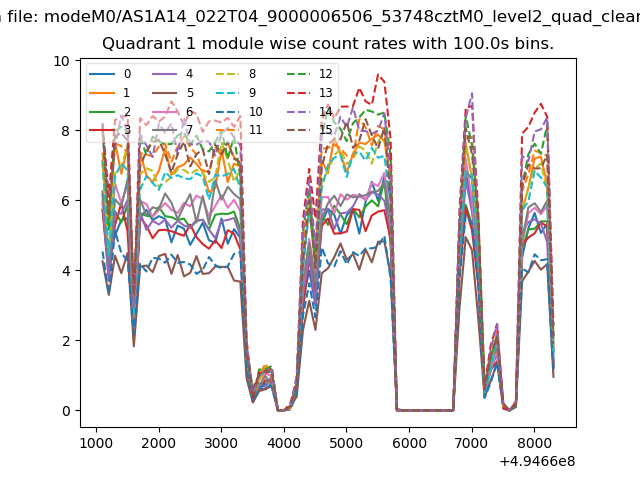
| Module-wise count rates for Quadrant A Data is divided into 100 sec bins |
 |
 |
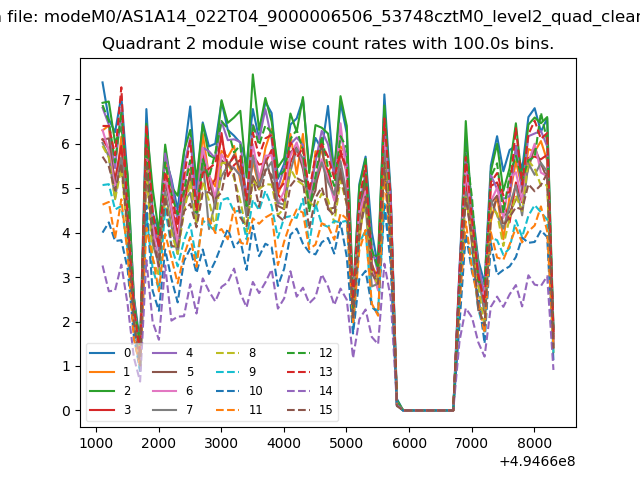
| Module-wise count rates for Quadrant B Data is divided into 100 sec bins |
 |
 |
| Module-wise count rates for Quadrant C Data is divided into 100 sec bins |
 |
 |
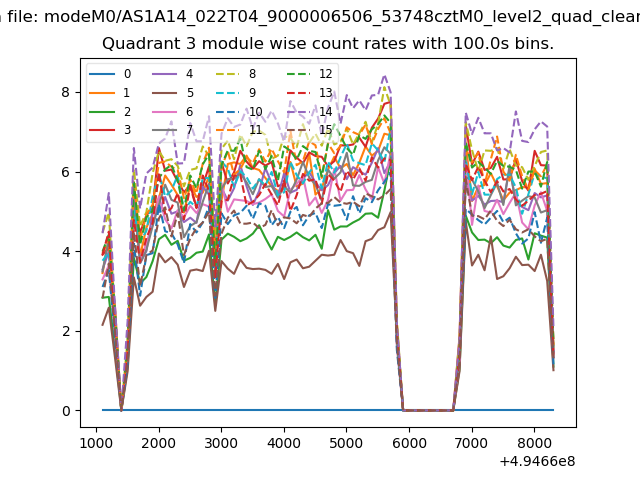
| Module-wise count rates for Quadrant D Data is divided into 100 sec bins |
 |
 |
| Parameter | Plot |
|---|---|
| CZT HV Monitor | 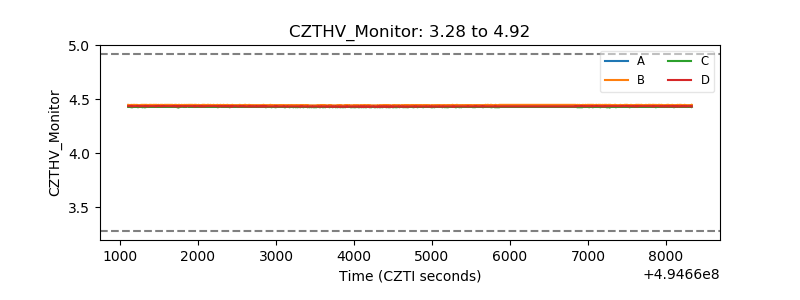 |
| D_VDD | 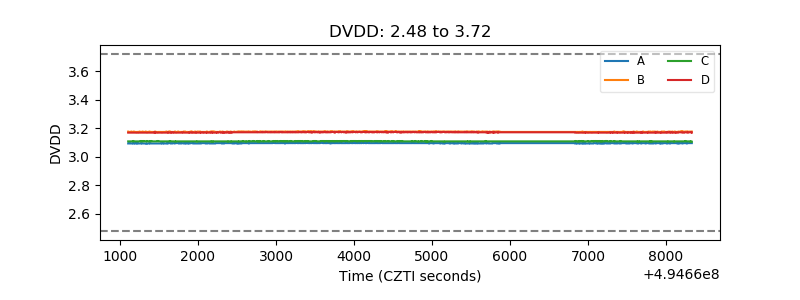 |
| Temperature 1 | 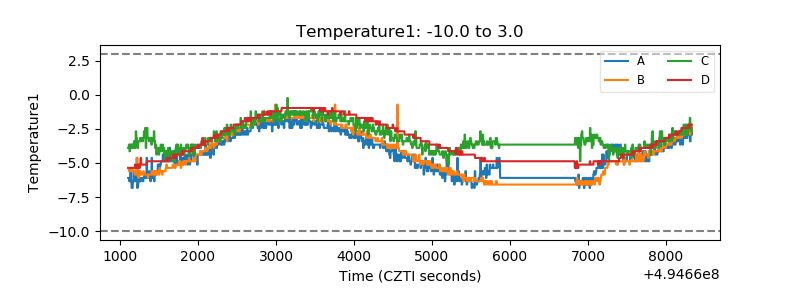 |
| Veto HV Monitor | 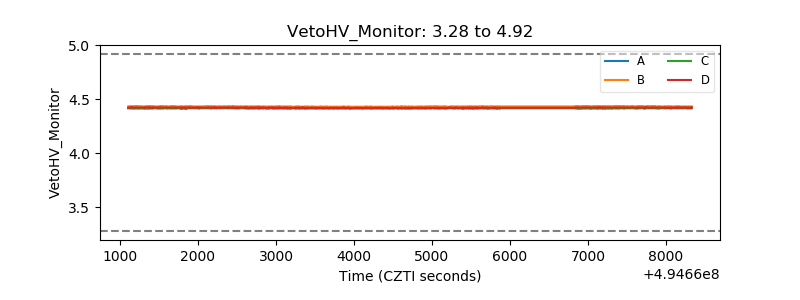 |
| Veto LLD | 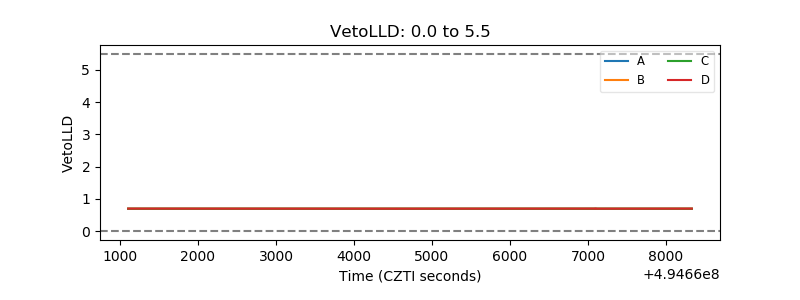 |
| Alpha Counter | 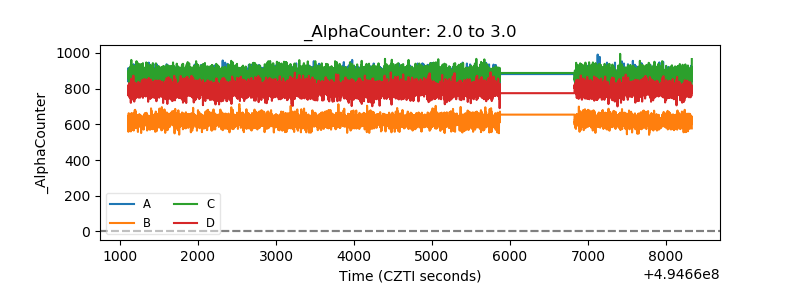 |
| _CPM_Rate | 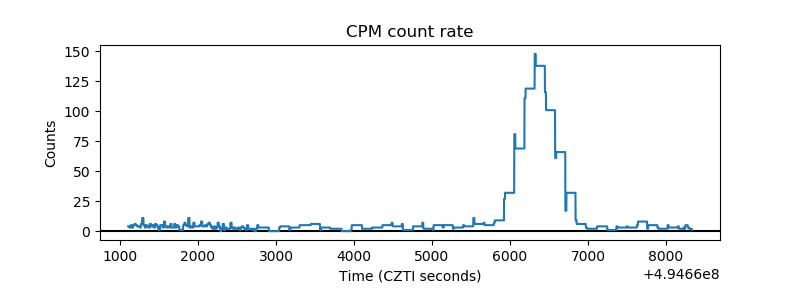 |
| CZT Counter | 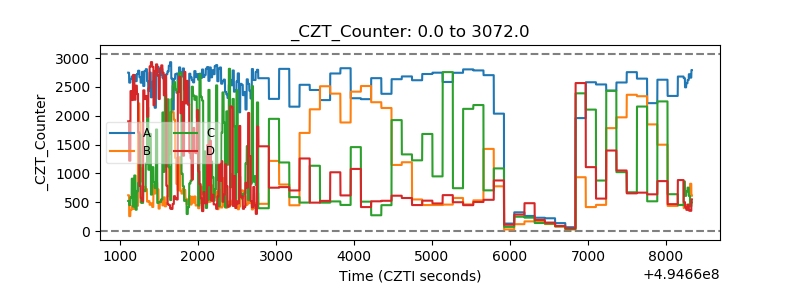 |
| +2.5 Volts monitor |  |
| +5 Volts monitor |  |
| _ROLL_ROT | 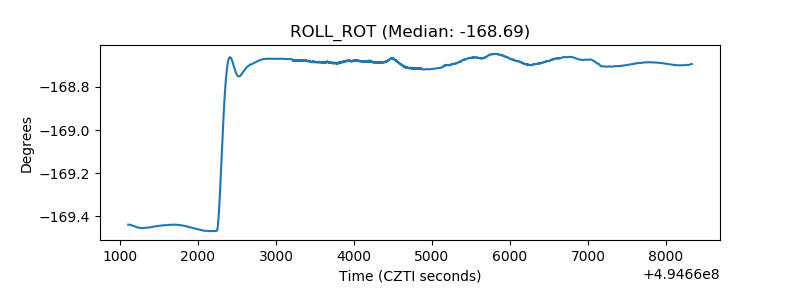 |
| _Roll_DEC | 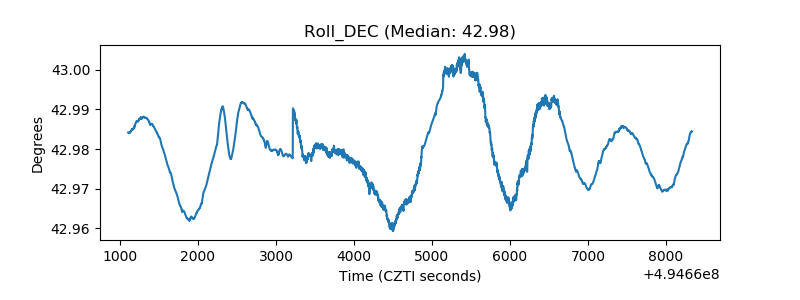 |
| _Roll_RA | 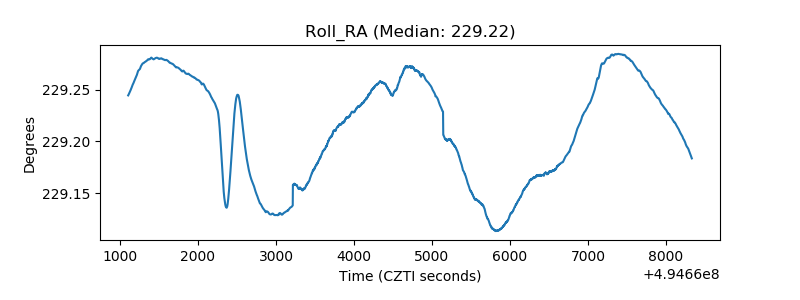 |
| Veto Counter | 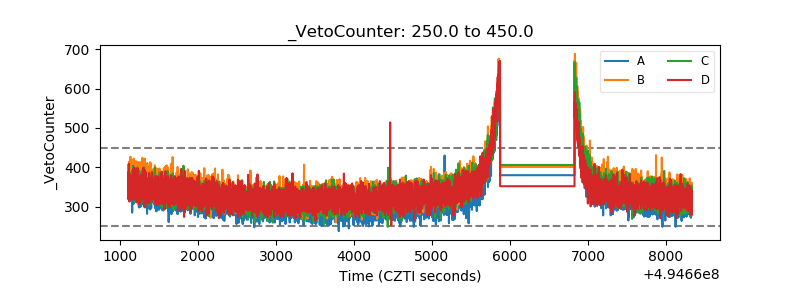 |