| Param | Original file | Final file |
|---|---|---|
| Filename | modeM0/AS1A14_022T04_9000006506_53749cztM0_level2.fits | modeM0/AS1A14_022T04_9000006506_53749cztM0_level2_quad_clean.evt |
| Size (bytes) | 1,126,200,960 | 68,924,160 |
| Size | 1.0 GB | 65.7 MB |
| Events in quadrant A | 17,224,322 | 6,617 |
| Events in quadrant B | 5,074,846 | 637,189 |
| Events in quadrant C | 11,537,692 | 381,601 |
| Events in quadrant D | 7,310,003 | 572,200 |
| Mode M0 | |||
|---|---|---|---|
| Quadrant | BADHDUFLAG | Total packets | Discarded packets |
| A | 0 | 55988 | 7 |
| B | 0 | 19994 | 2 |
| C | 0 | 39135 | 2 |
| D | 0 | 26664 | 2 |
| Mode SS | |||
|---|---|---|---|
| Quadrant | BADHDUFLAG | Total packets | Discarded packets |
| A | 0 | 144 | 0 |
| B | 0 | 144 | 0 |
| C | 0 | 144 | 0 |
| D | 0 | 144 | 0 |
| Mode M9 | |||
|---|---|---|---|
| Quadrant | BADHDUFLAG | Total packets | Discarded packets |
| A | 0 | 5 | 0 |
| B | 0 | 5 | 0 |
| C | 0 | 5 | 0 |
| D | 0 | 5 | 0 |
| Quadrant | Total seconds | Saturated seconds | Saturation percentage |
|---|---|---|---|
| A | 7014 | 6962 | 99.258626% |
| B | 7014 | 808 | 11.519818% |
| C | 7015 | 3071 | 43.777619% |
| D | 7015 | 440 | 6.272274% |
Noise dominated data is calculated using 1-second bins in cleaned event files. If a bin has >2000 counts, and if more than 50% of those come from <1% of pixels, then it is considered to be noise-dominated and hence unusable.
| Quadrant | # 1 sec bins | Bins with >0 counts | Bins with >2000 counts | High rate bins dominated by noise | Noise dominated (total time) | Noise dominated (detector-on time) | Marked lightcurve |
|---|---|---|---|---|---|---|---|
| A | 7633 | 7013 | 6309 | 6309 | 82.65% | 89.96% | 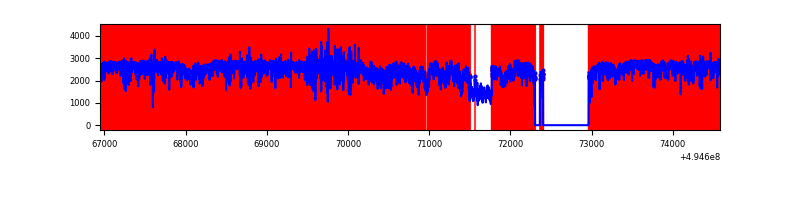 |
| B | 7634 | 7016 | 558 | 558 | 7.31% | 7.95% | 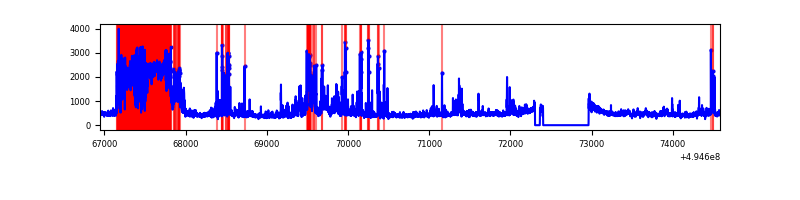 |
| C | 7635 | 7015 | 2719 | 2719 | 35.61% | 38.76% | 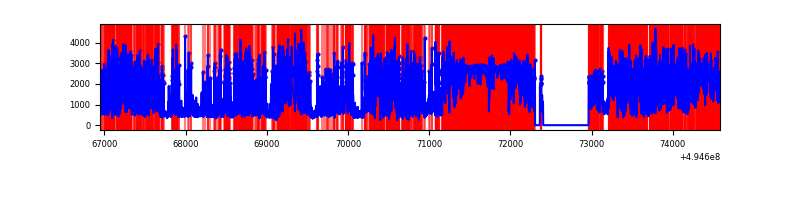 |
| D | 7635 | 7016 | 420 | 420 | 5.50% | 5.99% | 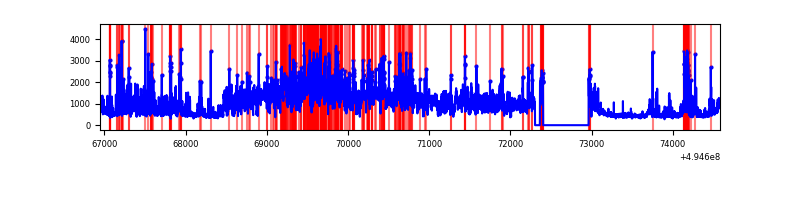 |
Top three noisy pixels from each quadrant. If the there are fewer than three noisy pixels in the level2.evt file, extra rows are filled as -1
| Pixel properties | Quadrant properties | ||||||
|---|---|---|---|---|---|---|---|
| Quadrant | DetID | PixID | Counts | Sigma | Mean | Median | Sigma |
| A | 3 | 63 | 11880358 | 241406.13 | 193 | 188 | 49.2 |
| A | 3 | 78 | 4432523 | 90065.45 | 193 | 188 | 49.2 |
| A | 8 | 249 | 31905 | 644.49 | 193 | 188 | 49.2 |
| B | 6 | 255 | 1738288 | 11662.78 | 696 | 672 | 149.0 |
| B | 5 | 185 | 190174 | 1271.93 | 696 | 672 | 149.0 |
| B | 4 | 81 | 129806 | 866.74 | 696 | 672 | 149.0 |
| C | 15 | 224 | 3872834 | 25140.53 | 559 | 555 | 154.0 |
| C | 1 | 241 | 2234310 | 14502.52 | 559 | 555 | 154.0 |
| C | 13 | 3 | 1701862 | 11045.63 | 559 | 555 | 154.0 |
| D | 2 | 172 | 3086195 | 15479.61 | 701 | 673 | 199.3 |
| D | 8 | 176 | 625922 | 3136.78 | 701 | 673 | 199.3 |
| D | 13 | 153 | 267177 | 1337.01 | 701 | 673 | 199.3 |
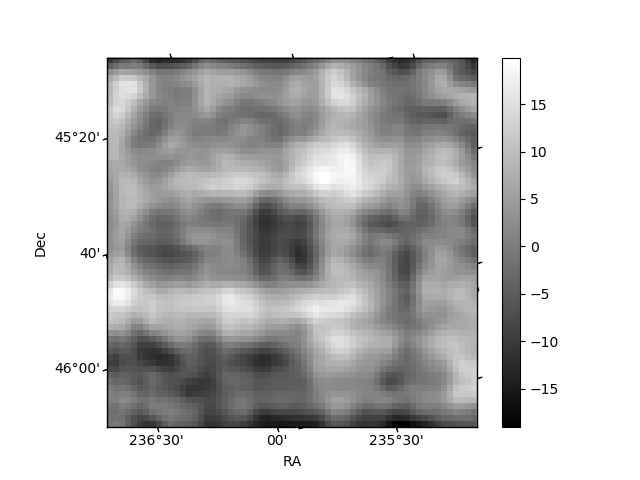
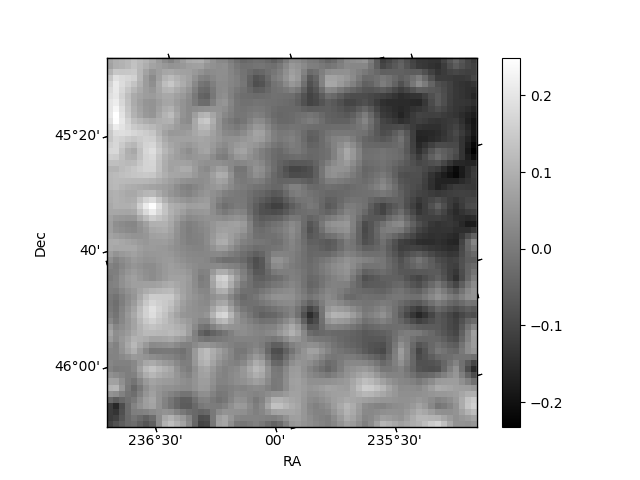
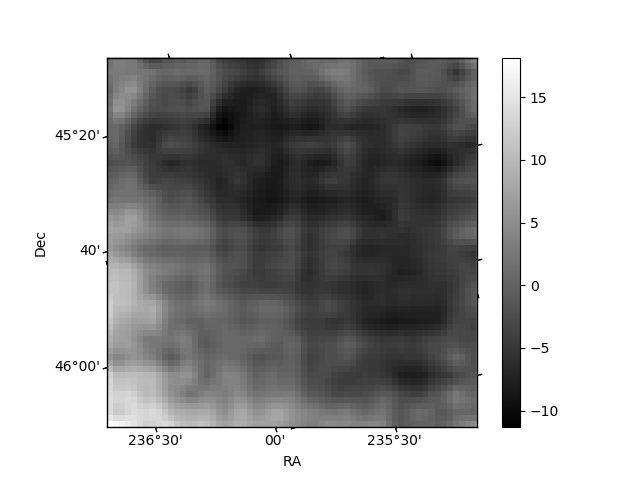
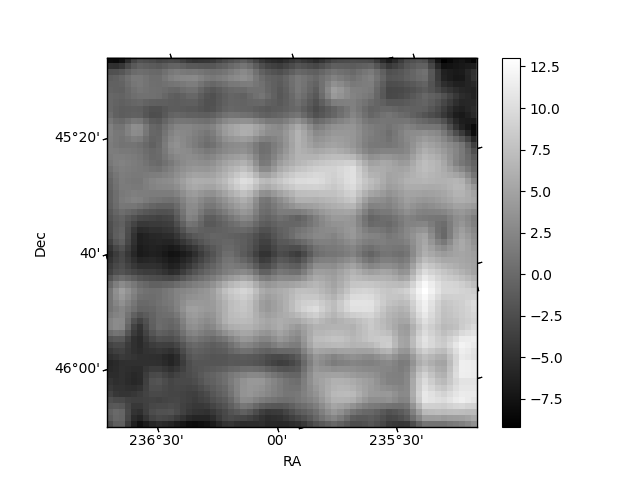
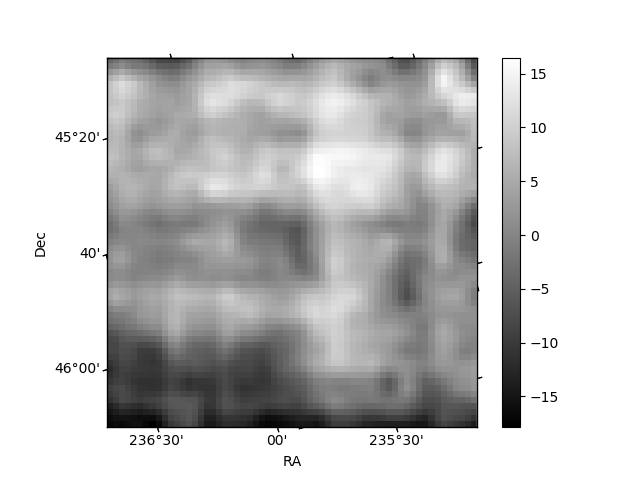
Histogram calculated using DETX and DETY for each event in the final _common_clean file
| Quadrant A | 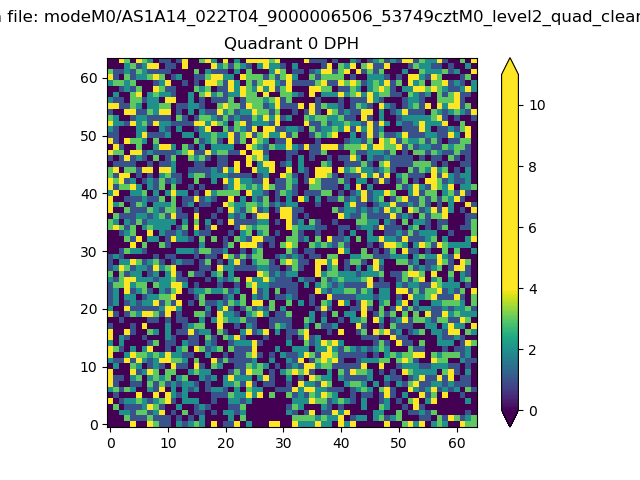 |
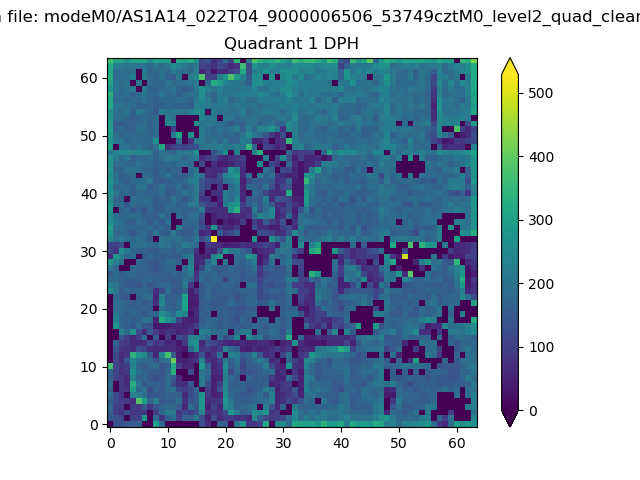 |
Quadrant B |
|---|---|---|---|
| Quadrant D | 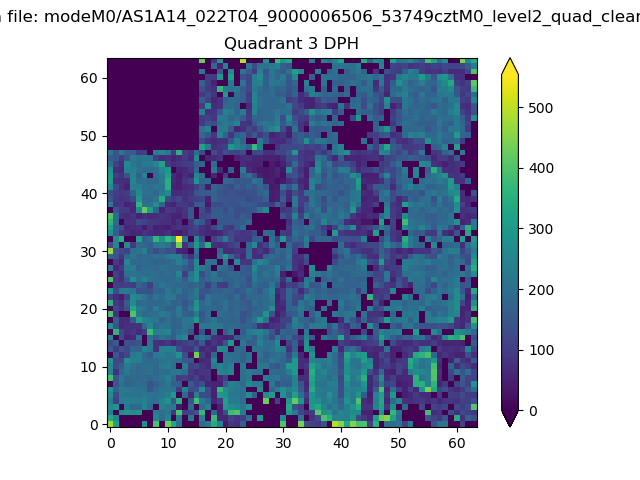 |
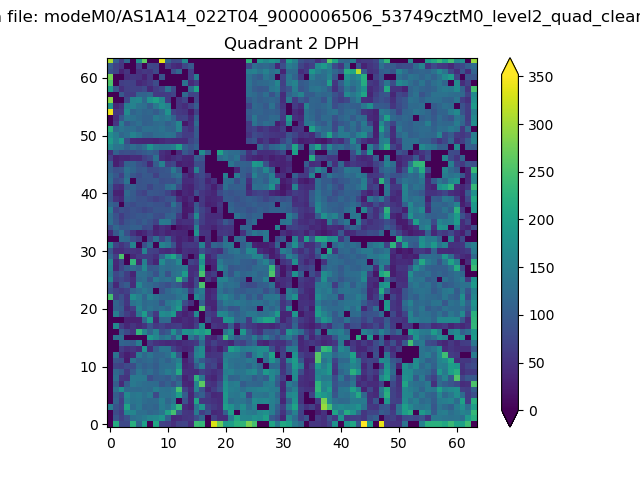 |
Quadrant C |
| Plot type | Count rate plots | Images |
|---|---|---|
| Comparison with Poisson distribution Blue bars denote a histogram of data divided into 1 sec bins. Red curve is a Poisson curve with rate = median count rate of data. |
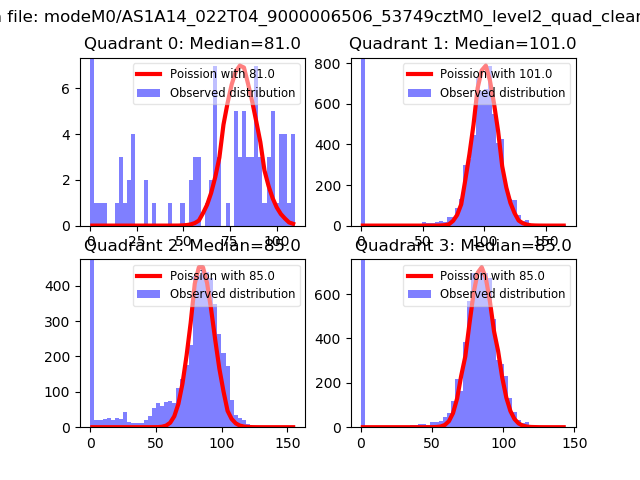 |
 |
| Quadrant-wise count rates Data is divided into 100 sec bins |
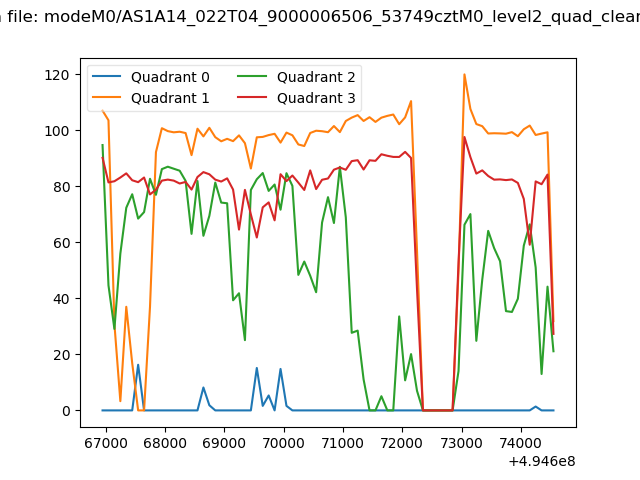 |
|
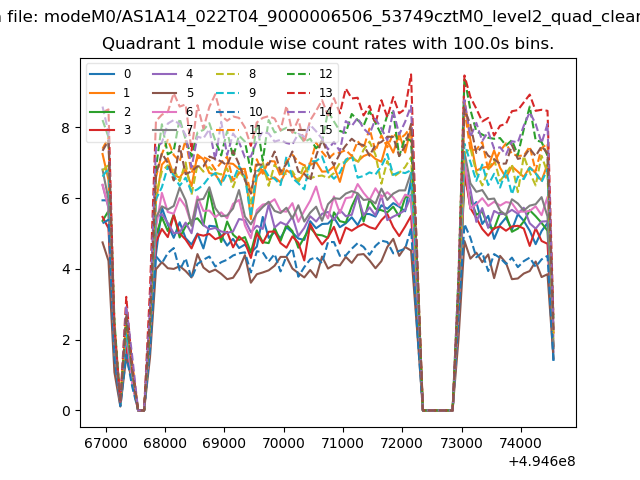
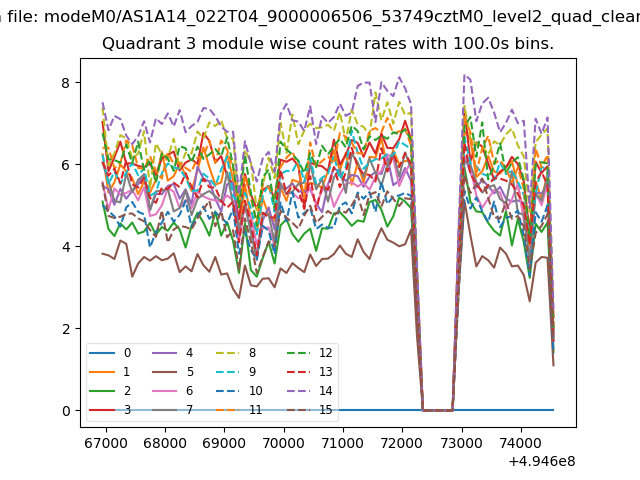
| Module-wise count rates for Quadrant A Data is divided into 100 sec bins |
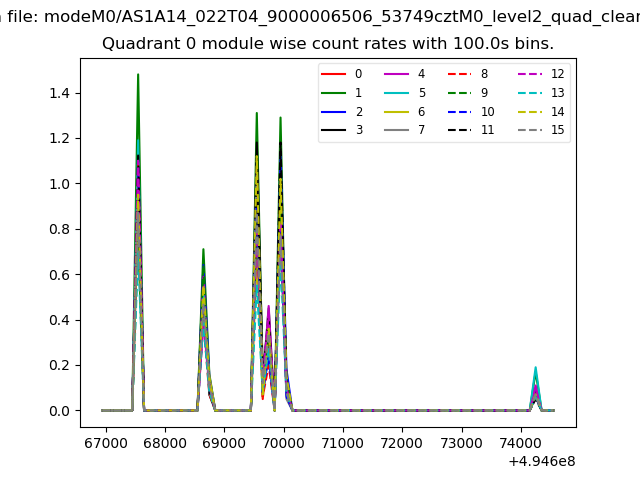 |
 |
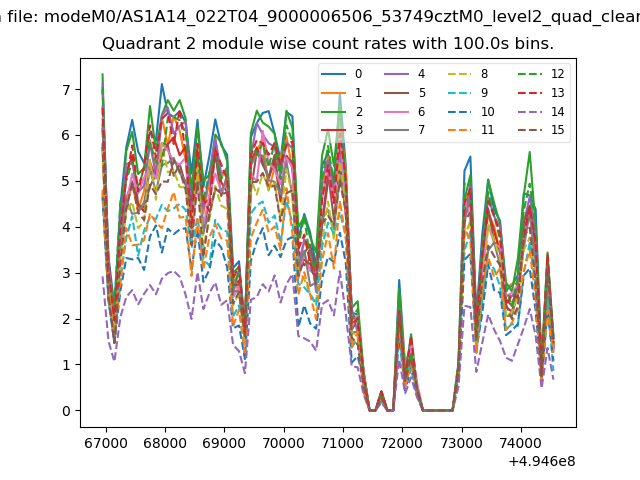
| Module-wise count rates for Quadrant B Data is divided into 100 sec bins |
 |
 |
| Module-wise count rates for Quadrant C Data is divided into 100 sec bins |
 |
 |
| Module-wise count rates for Quadrant D Data is divided into 100 sec bins |
 |
 |
| Parameter | Plot |
|---|---|
| CZT HV Monitor |  |
| D_VDD | 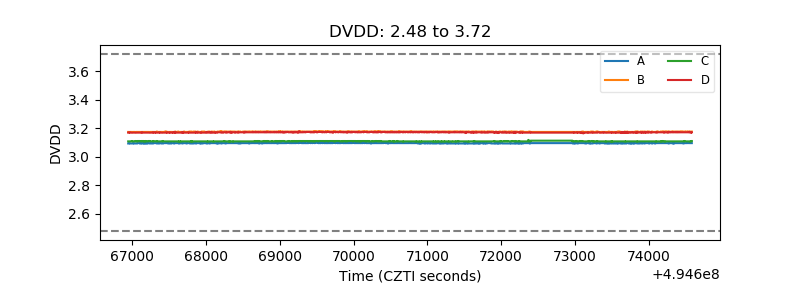 |
| Temperature 1 | 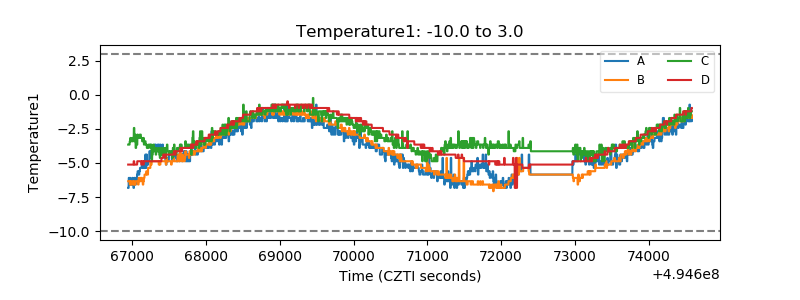 |
| Veto HV Monitor | 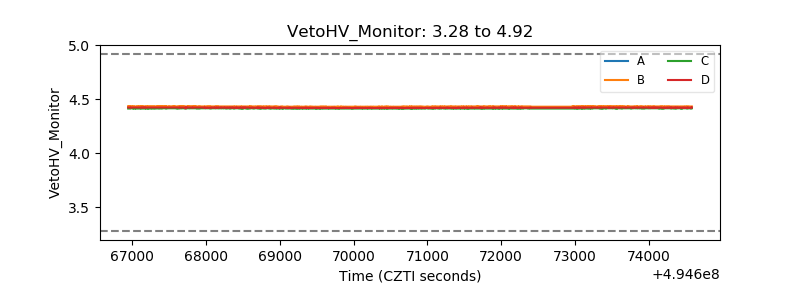 |
| Veto LLD | 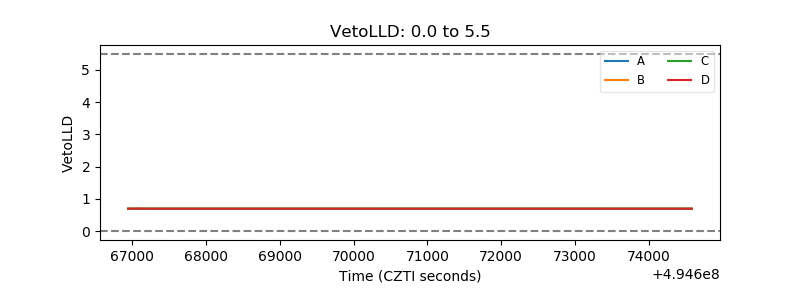 |
| Alpha Counter | 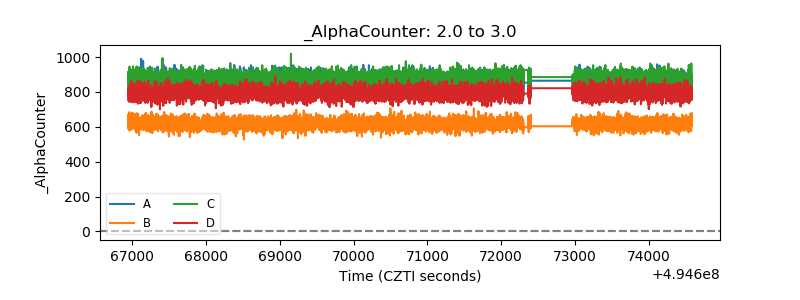 |
| _CPM_Rate | 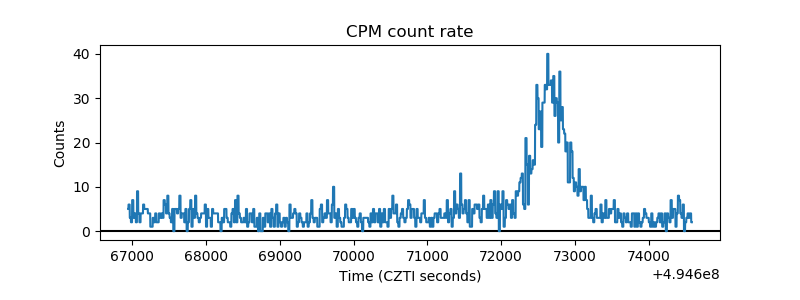 |
| CZT Counter | 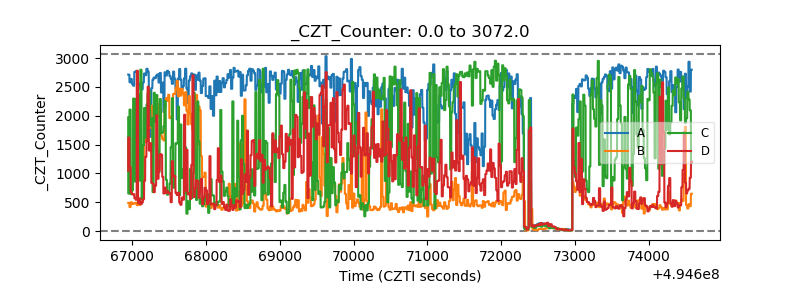 |
| +2.5 Volts monitor |  |
| +5 Volts monitor |  |
| _ROLL_ROT | 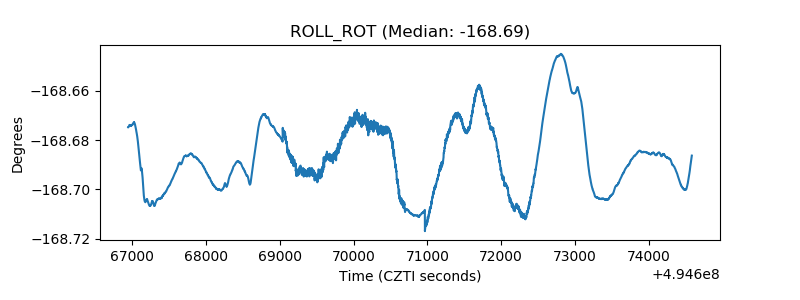 |
| _Roll_DEC | 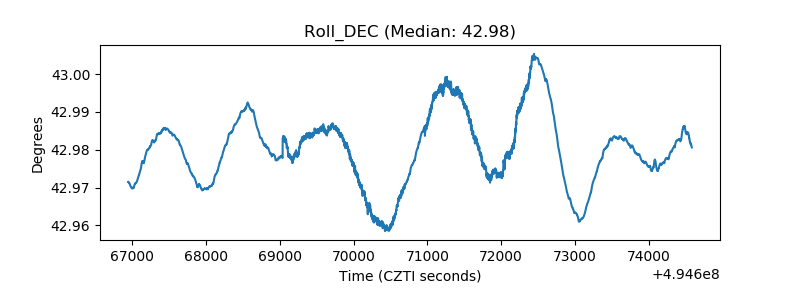 |
| _Roll_RA | 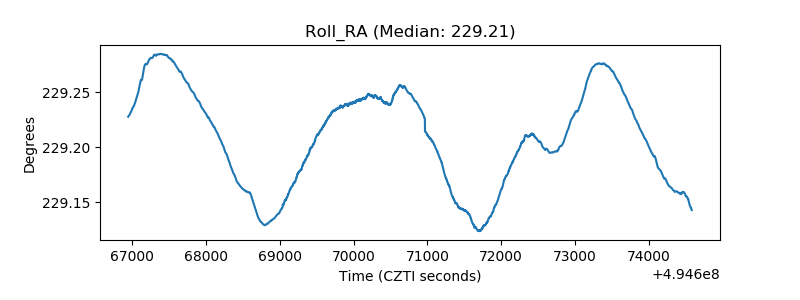 |
| Veto Counter | 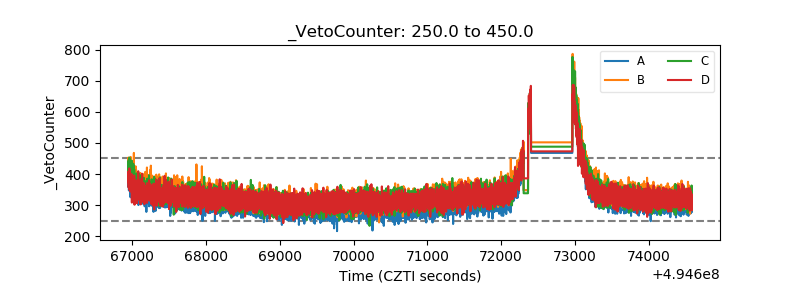 |