| Param | Original file | Final file |
|---|---|---|
| Filename | modeM0/AS1A14_022T04_9000006506_53751cztM0_level2.fits | modeM0/AS1A14_022T04_9000006506_53751cztM0_level2_quad_clean.evt |
| Size (bytes) | 1,053,187,200 | 85,069,440 |
| Size | 1004.4 MB | 81.1 MB |
| Events in quadrant A | 15,378,220 | 294,185 |
| Events in quadrant B | 4,851,071 | 730,986 |
| Events in quadrant C | 12,218,528 | 412,610 |
| Events in quadrant D | 5,964,508 | 620,484 |
| Mode M0 | |||
|---|---|---|---|
| Quadrant | BADHDUFLAG | Total packets | Discarded packets |
| A | 0 | 50858 | 0 |
| B | 0 | 19436 | 0 |
| C | 0 | 41408 | 1 |
| D | 0 | 22928 | 0 |
| Mode SS | |||
|---|---|---|---|
| Quadrant | BADHDUFLAG | Total packets | Discarded packets |
| A | 0 | 148 | 0 |
| B | 0 | 148 | 0 |
| C | 0 | 148 | 0 |
| D | 0 | 148 | 0 |
| Quadrant | Total seconds | Saturated seconds | Saturation percentage |
|---|---|---|---|
| A | 7432 | 4645 | 62.500000% |
| B | 7432 | 159 | 2.139397% |
| C | 7432 | 3110 | 41.846071% |
| D | 7432 | 188 | 2.529602% |
Noise dominated data is calculated using 1-second bins in cleaned event files. If a bin has >2000 counts, and if more than 50% of those come from <1% of pixels, then it is considered to be noise-dominated and hence unusable.
| Quadrant | # 1 sec bins | Bins with >0 counts | Bins with >2000 counts | High rate bins dominated by noise | Noise dominated (total time) | Noise dominated (detector-on time) | Marked lightcurve |
|---|---|---|---|---|---|---|---|
| A | 7432 | 7432 | 4434 | 4434 | 59.66% | 59.66% | 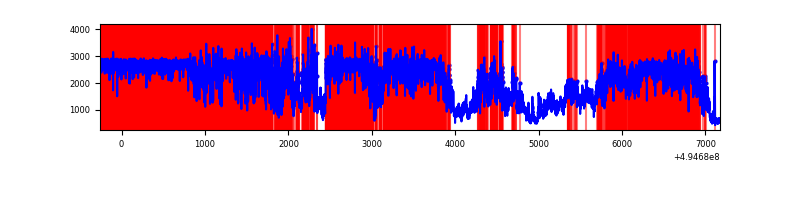 |
| B | 7432 | 7432 | 116 | 116 | 1.56% | 1.56% | 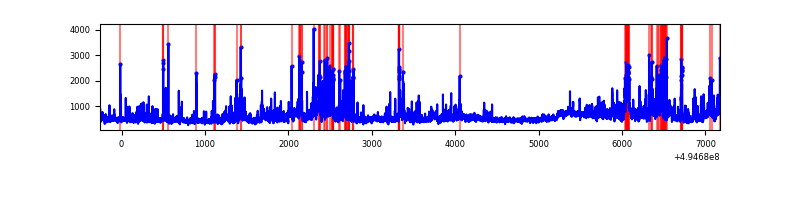 |
| C | 7432 | 7432 | 2857 | 2857 | 38.44% | 38.44% | 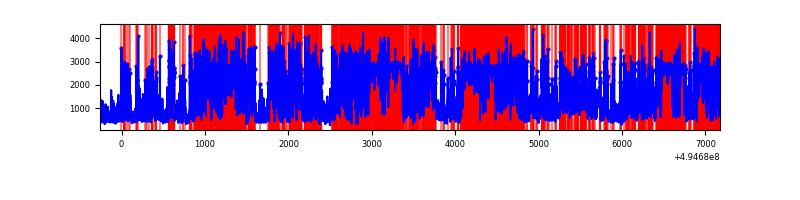 |
| D | 7432 | 7432 | 200 | 200 | 2.69% | 2.69% | 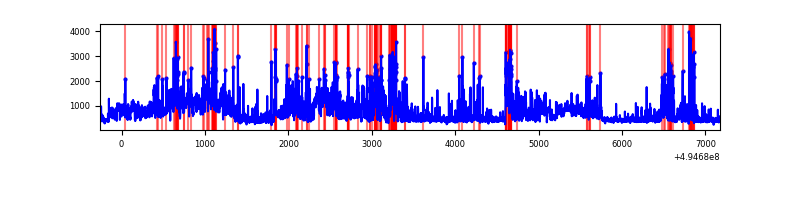 |
Top three noisy pixels from each quadrant. If the there are fewer than three noisy pixels in the level2.evt file, extra rows are filled as -1
| Pixel properties | Quadrant properties | ||||||
|---|---|---|---|---|---|---|---|
| Quadrant | DetID | PixID | Counts | Sigma | Mean | Median | Sigma |
| A | 3 | 63 | 11303787 | 78368.66 | 584 | 570 | 144.2 |
| A | 3 | 78 | 1129386 | 7826.43 | 584 | 570 | 144.2 |
| A | 8 | 62 | 317372 | 2196.49 | 584 | 570 | 144.2 |
| B | 7 | 0 | 555047 | 3383.34 | 764 | 741 | 163.8 |
| B | 4 | 81 | 398268 | 2426.4 | 764 | 741 | 163.8 |
| B | 6 | 255 | 168319 | 1022.85 | 764 | 741 | 163.8 |
| C | 15 | 224 | 4938844 | 29646.71 | 603 | 598 | 166.6 |
| C | 1 | 241 | 3848223 | 23099.17 | 603 | 598 | 166.6 |
| C | 15 | 158 | 288390 | 1727.76 | 603 | 598 | 166.6 |
| D | 2 | 172 | 2086749 | 9651.97 | 755 | 724 | 216.1 |
| D | 13 | 153 | 190084 | 876.16 | 755 | 724 | 216.1 |
| D | 2 | 249 | 129230 | 594.59 | 755 | 724 | 216.1 |
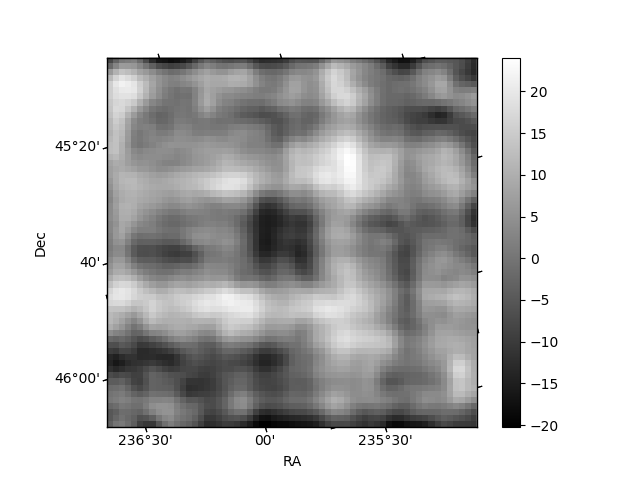
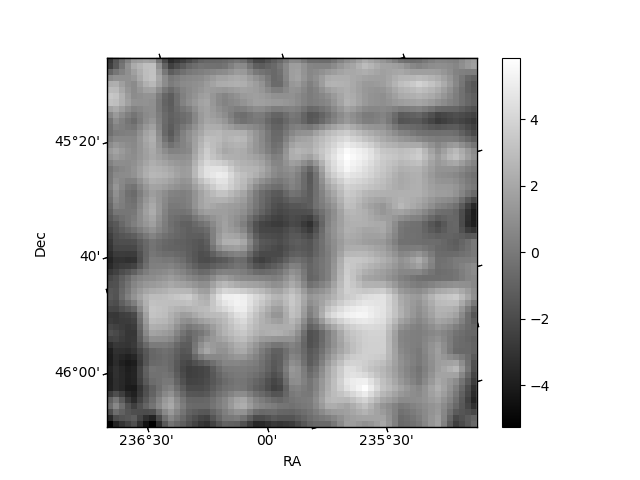
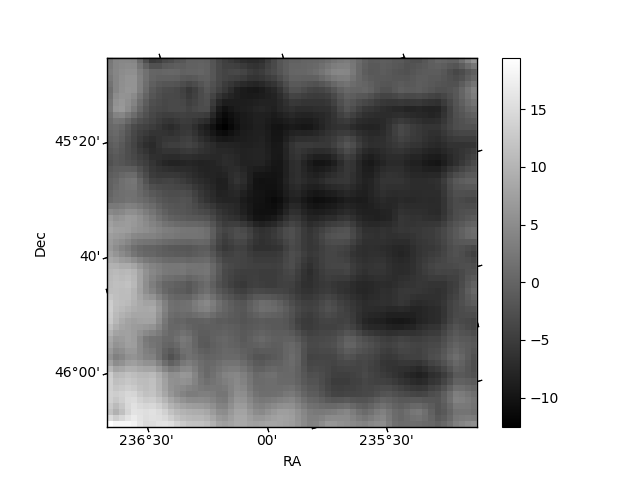
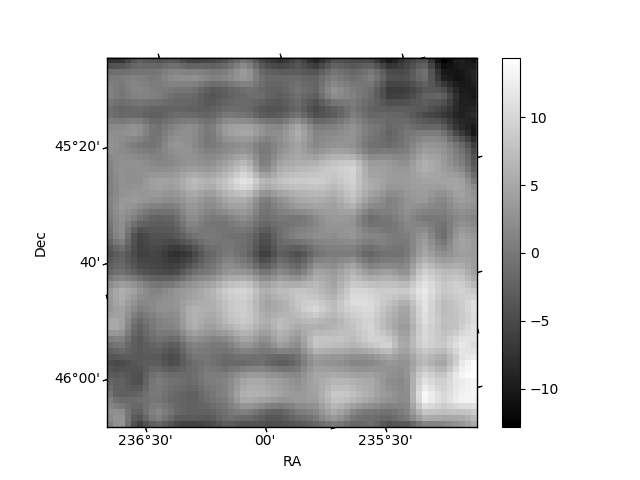
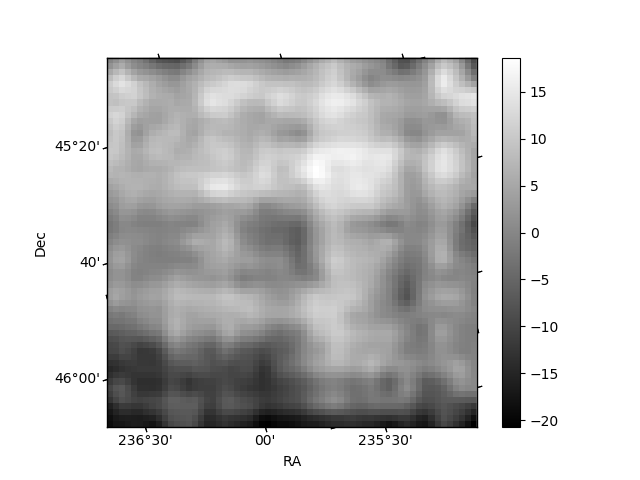
Histogram calculated using DETX and DETY for each event in the final _common_clean file
| Quadrant A | 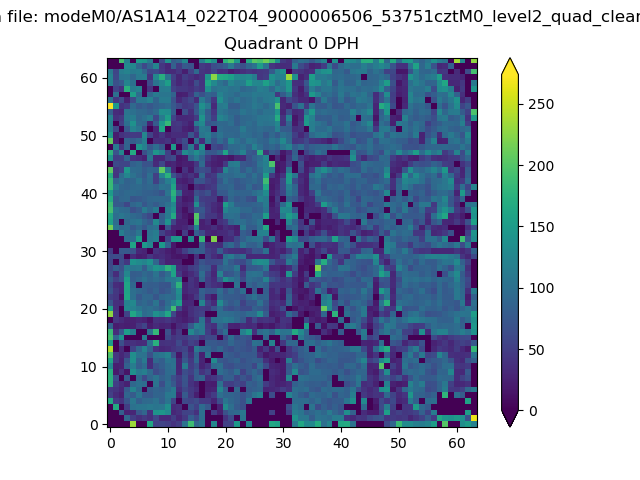 |
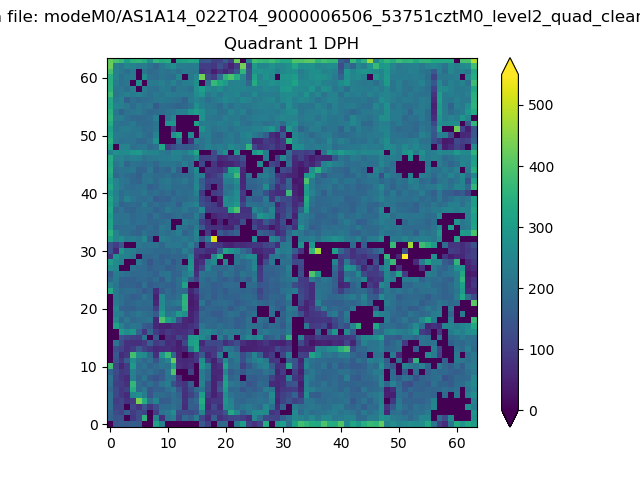 |
Quadrant B |
|---|---|---|---|
| Quadrant D | 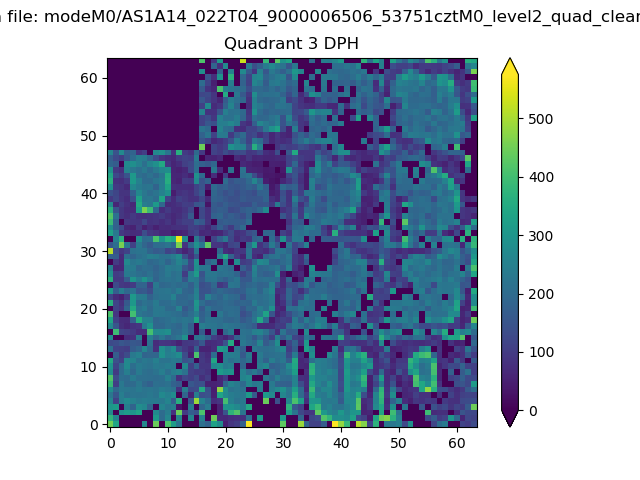 |
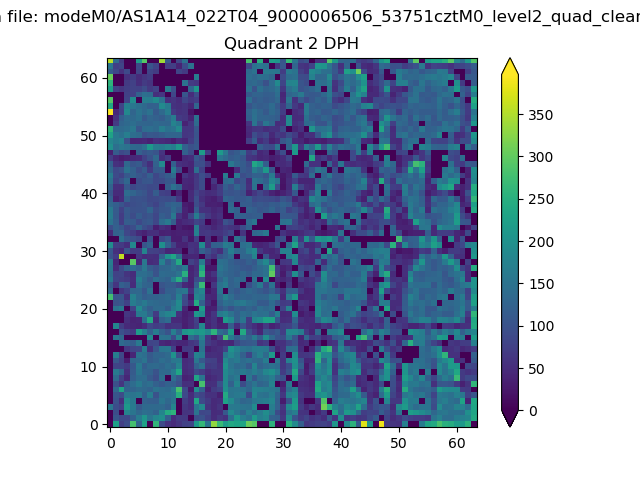 |
Quadrant C |
| Plot type | Count rate plots | Images |
|---|---|---|
| Comparison with Poisson distribution Blue bars denote a histogram of data divided into 1 sec bins. Red curve is a Poisson curve with rate = median count rate of data. |
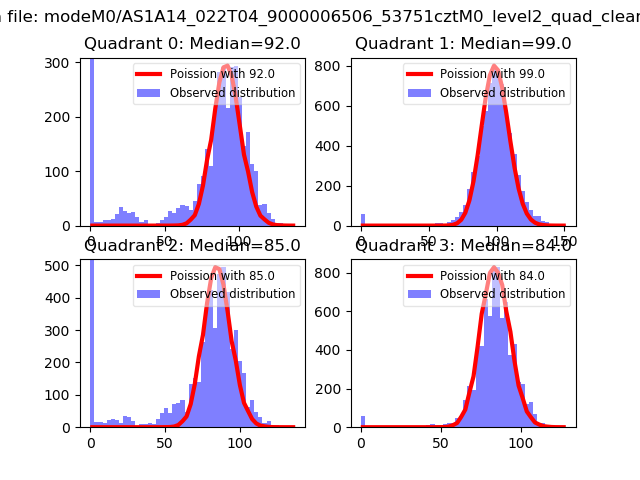 |
 |
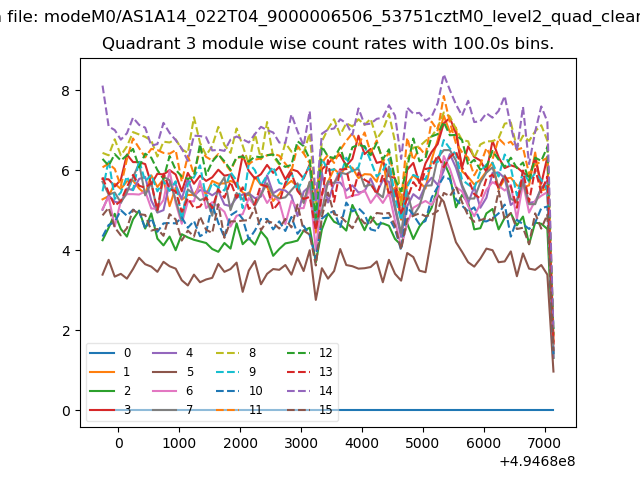
| Quadrant-wise count rates Data is divided into 100 sec bins |
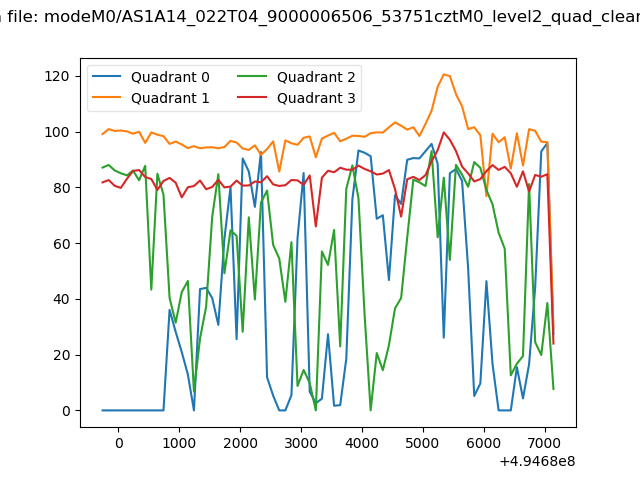 |
|
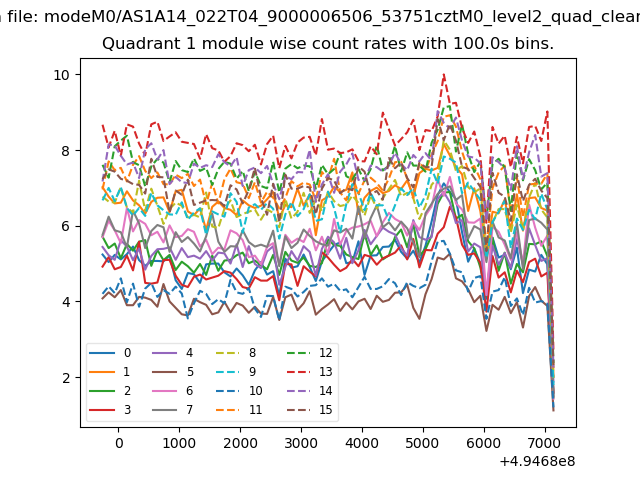
| Module-wise count rates for Quadrant A Data is divided into 100 sec bins |
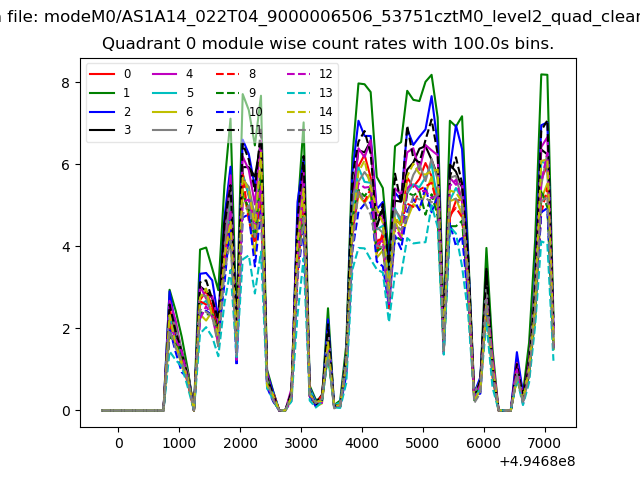 |
 |
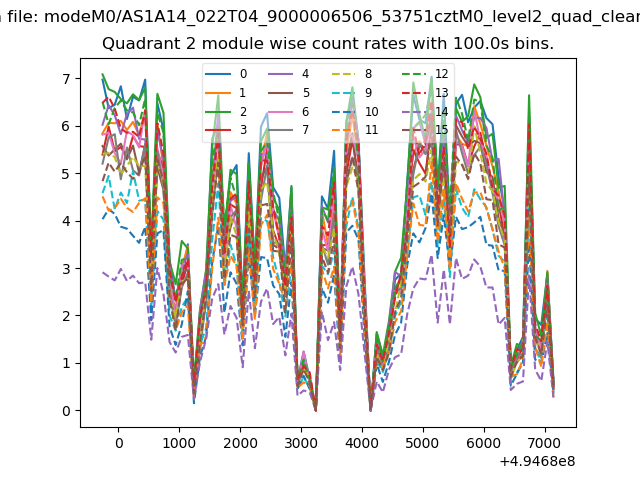
| Module-wise count rates for Quadrant B Data is divided into 100 sec bins |
 |
 |
| Module-wise count rates for Quadrant C Data is divided into 100 sec bins |
 |
 |
| Module-wise count rates for Quadrant D Data is divided into 100 sec bins |
 |
 |
| Parameter | Plot |
|---|---|
| CZT HV Monitor | 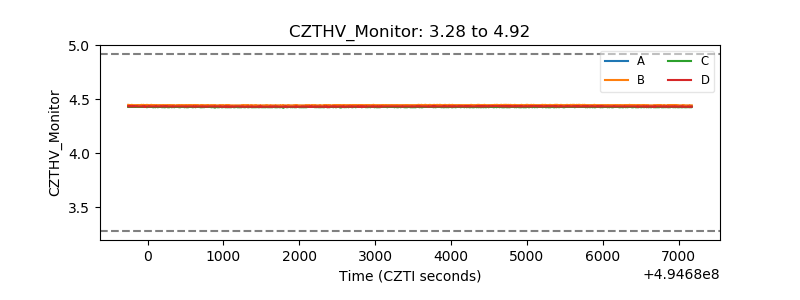 |
| D_VDD | 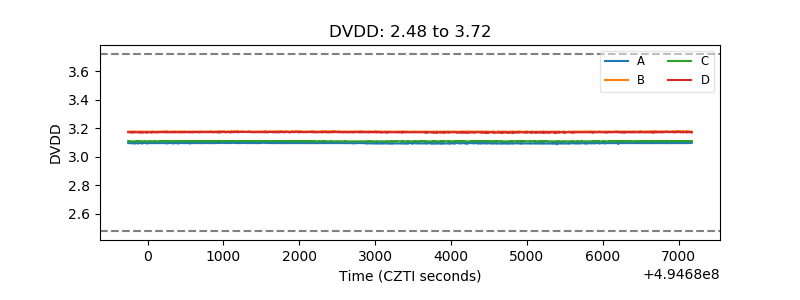 |
| Temperature 1 | 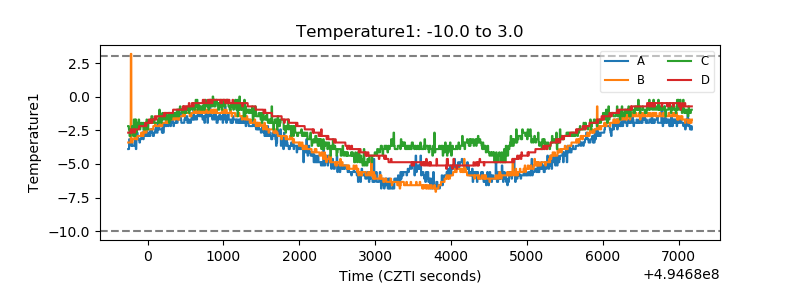 |
| Veto HV Monitor | 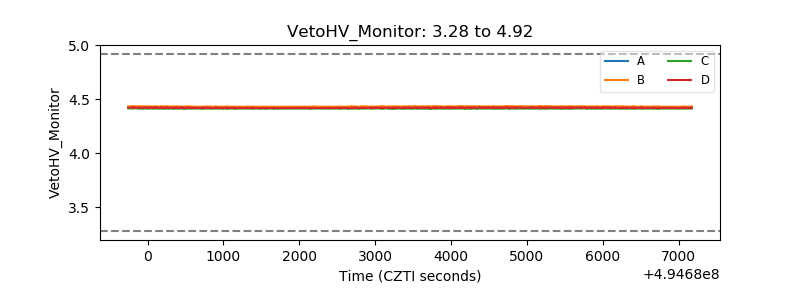 |
| Veto LLD | 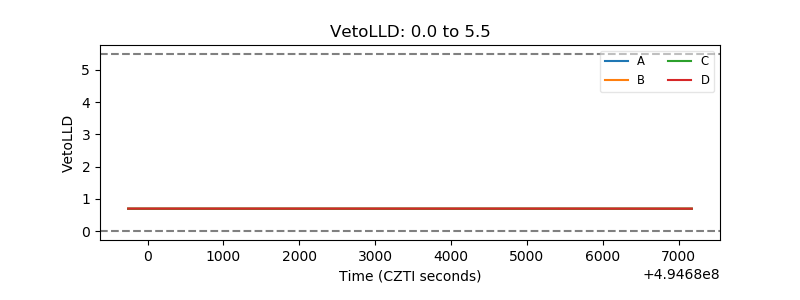 |
| Alpha Counter | 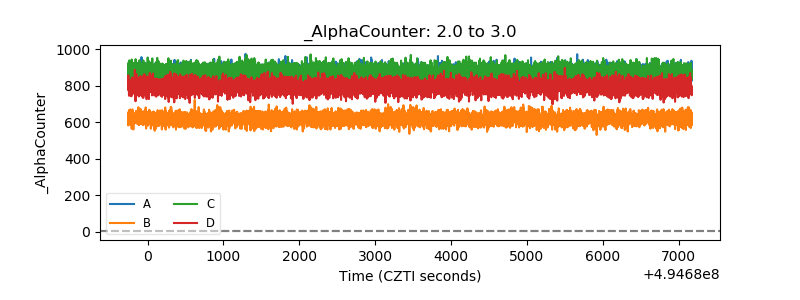 |
| _CPM_Rate | 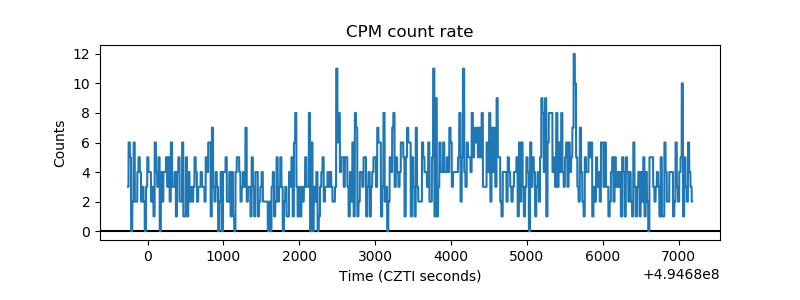 |
| CZT Counter | 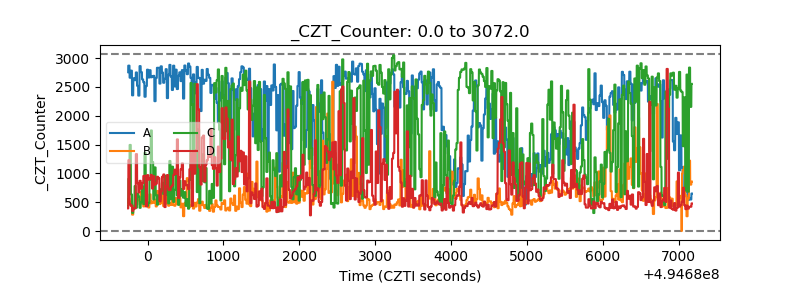 |
| +2.5 Volts monitor | 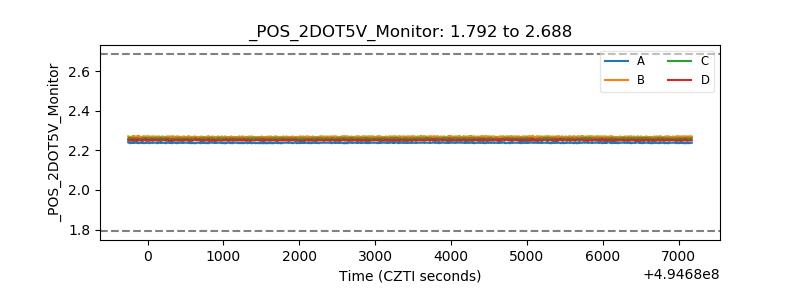 |
| +5 Volts monitor | 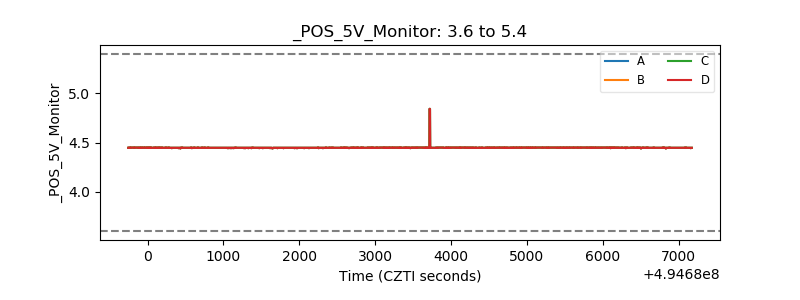 |
| _ROLL_ROT | 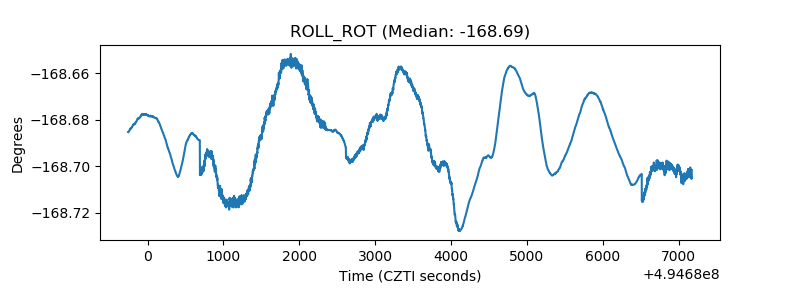 |
| _Roll_DEC | 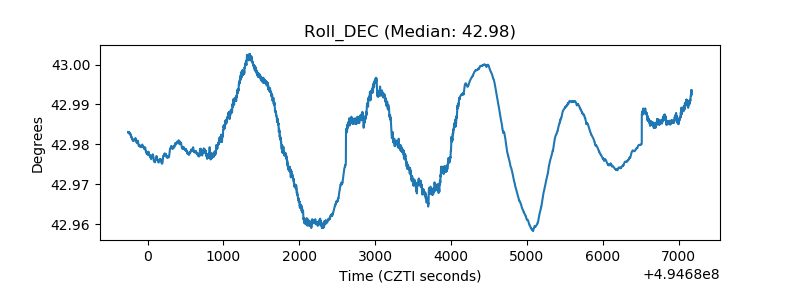 |
| _Roll_RA | 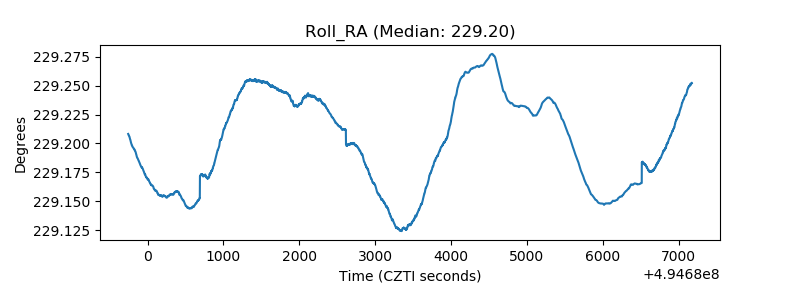 |
| Veto Counter | 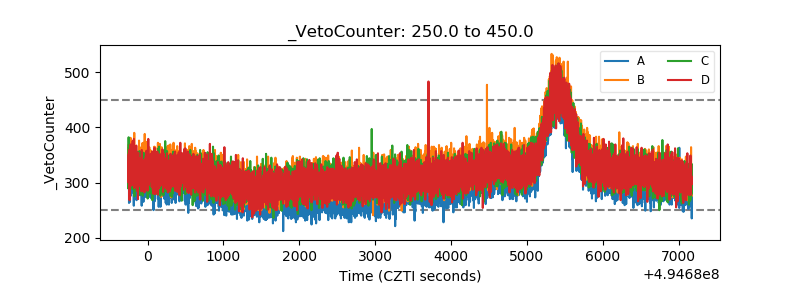 |