| Param | Original file | Final file |
|---|---|---|
| Filename | modeM0/AS1A14_022T04_9000006506_53752cztM0_level2.fits | modeM0/AS1A14_022T04_9000006506_53752cztM0_level2_quad_clean.evt |
| Size (bytes) | 967,475,520 | 85,798,080 |
| Size | 922.7 MB | 81.8 MB |
| Events in quadrant A | 14,406,098 | 322,447 |
| Events in quadrant B | 4,627,755 | 720,311 |
| Events in quadrant C | 10,714,765 | 447,458 |
| Events in quadrant D | 5,499,592 | 598,474 |
| Mode M0 | |||
|---|---|---|---|
| Quadrant | BADHDUFLAG | Total packets | Discarded packets |
| A | 0 | 47820 | 0 |
| B | 0 | 18926 | 0 |
| C | 0 | 36937 | 7 |
| D | 0 | 21448 | 6 |
| Mode SS | |||
|---|---|---|---|
| Quadrant | BADHDUFLAG | Total packets | Discarded packets |
| A | 0 | 146 | 0 |
| B | 0 | 146 | 0 |
| C | 0 | 146 | 0 |
| D | 0 | 146 | 0 |
| Quadrant | Total seconds | Saturated seconds | Saturation percentage |
|---|---|---|---|
| A | 7309 | 4152 | 56.806677% |
| B | 7309 | 203 | 2.777398% |
| C | 7307 | 2557 | 34.993842% |
| D | 7308 | 418 | 5.719759% |
Noise dominated data is calculated using 1-second bins in cleaned event files. If a bin has >2000 counts, and if more than 50% of those come from <1% of pixels, then it is considered to be noise-dominated and hence unusable.
| Quadrant | # 1 sec bins | Bins with >0 counts | Bins with >2000 counts | High rate bins dominated by noise | Noise dominated (total time) | Noise dominated (detector-on time) | Marked lightcurve |
|---|---|---|---|---|---|---|---|
| A | 7309 | 7309 | 4007 | 4007 | 54.82% | 54.82% | 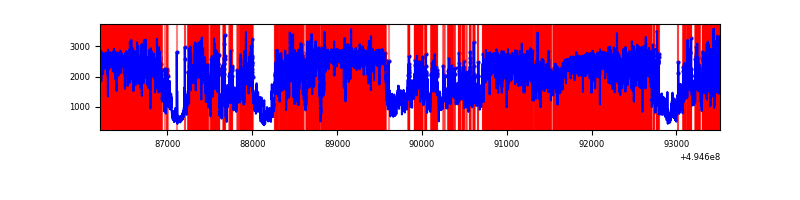 |
| B | 7309 | 7309 | 155 | 155 | 2.12% | 2.12% | 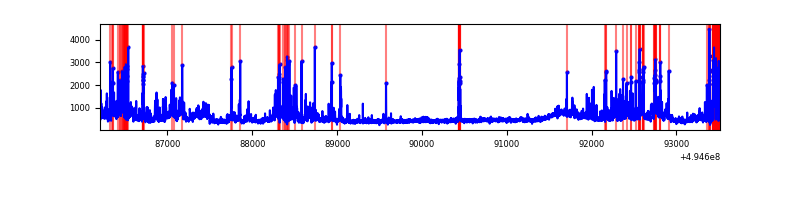 |
| C | 7309 | 7308 | 2281 | 2281 | 31.21% | 31.21% | 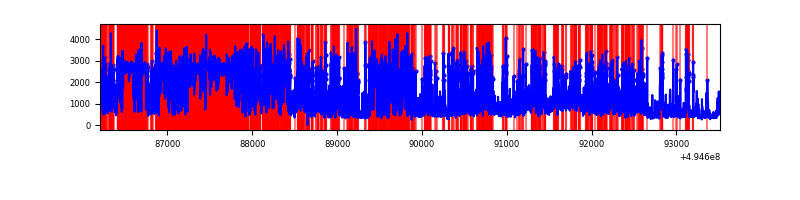 |
| D | 7307 | 7307 | 407 | 407 | 5.57% | 5.57% | 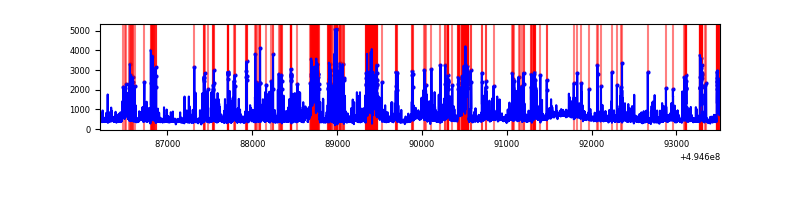 |
Top three noisy pixels from each quadrant. If the there are fewer than three noisy pixels in the level2.evt file, extra rows are filled as -1
| Pixel properties | Quadrant properties | ||||||
|---|---|---|---|---|---|---|---|
| Quadrant | DetID | PixID | Counts | Sigma | Mean | Median | Sigma |
| A | 3 | 63 | 11381962 | 76521.78 | 591 | 576 | 148.7 |
| A | 0 | 8 | 127791 | 855.32 | 591 | 576 | 148.7 |
| A | 4 | 249 | 113923 | 762.08 | 591 | 576 | 148.7 |
| B | 7 | 0 | 548851 | 3366.71 | 755 | 729 | 162.8 |
| B | 4 | 81 | 444339 | 2724.77 | 755 | 729 | 162.8 |
| B | 0 | 213 | 188068 | 1150.69 | 755 | 729 | 162.8 |
| C | 15 | 224 | 5283425 | 30427.21 | 628 | 624 | 173.6 |
| C | 1 | 241 | 2085417 | 12007.73 | 628 | 624 | 173.6 |
| C | 15 | 158 | 417583 | 2401.55 | 628 | 624 | 173.6 |
| D | 3 | 224 | 939692 | 4514.26 | 738 | 706 | 208.0 |
| D | 3 | 12 | 431363 | 2070.42 | 738 | 706 | 208.0 |
| D | 13 | 153 | 280731 | 1346.24 | 738 | 706 | 208.0 |
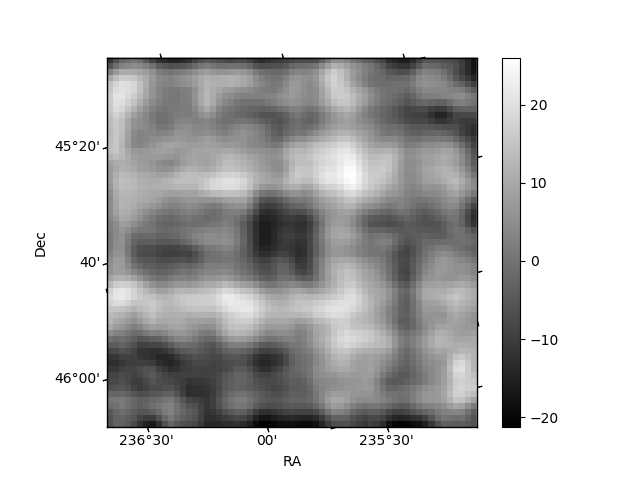
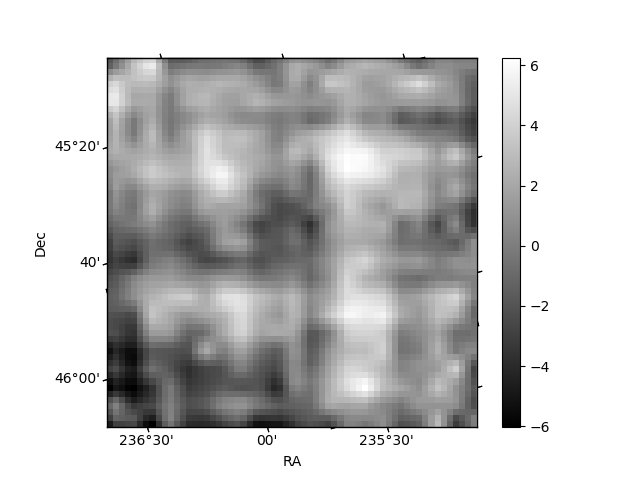
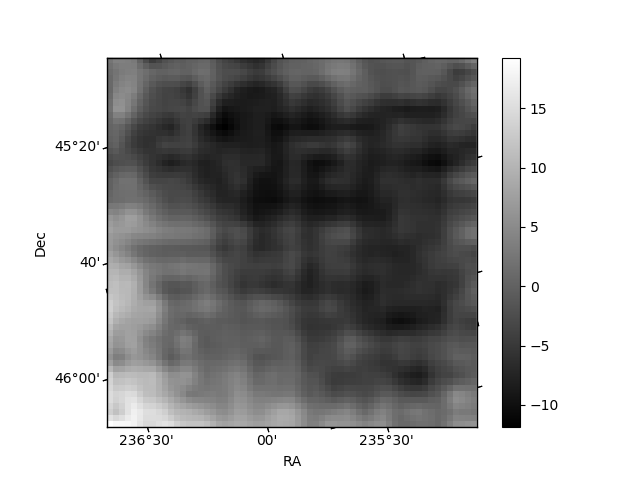
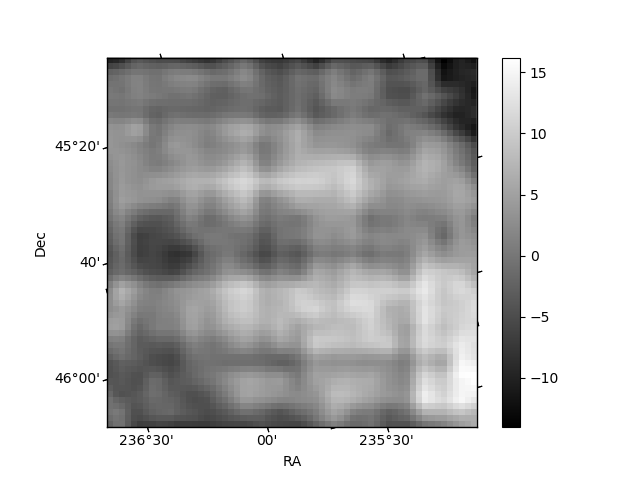
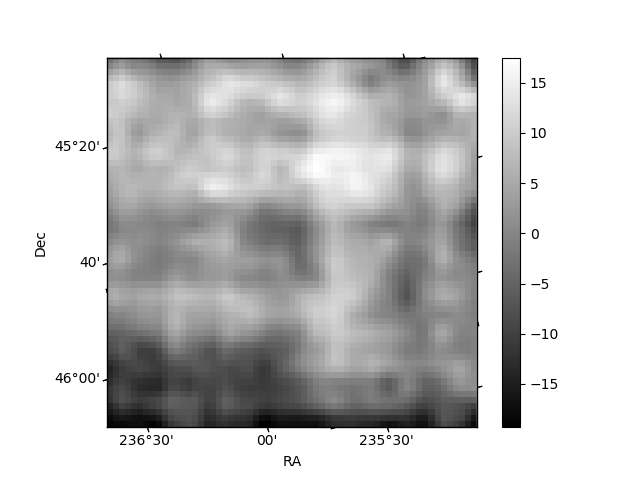
Histogram calculated using DETX and DETY for each event in the final _common_clean file
| Quadrant A | 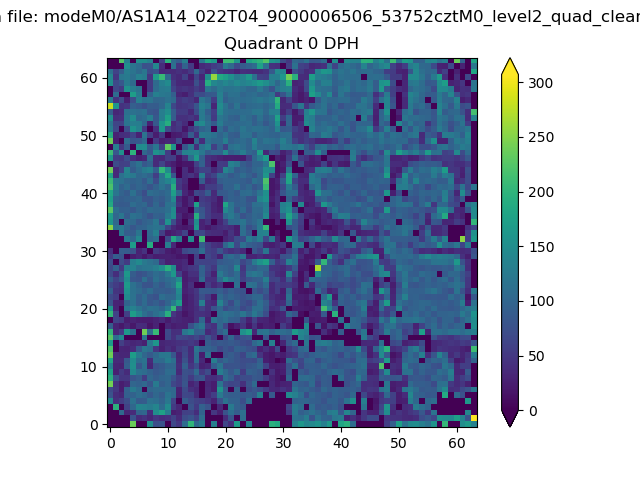 |
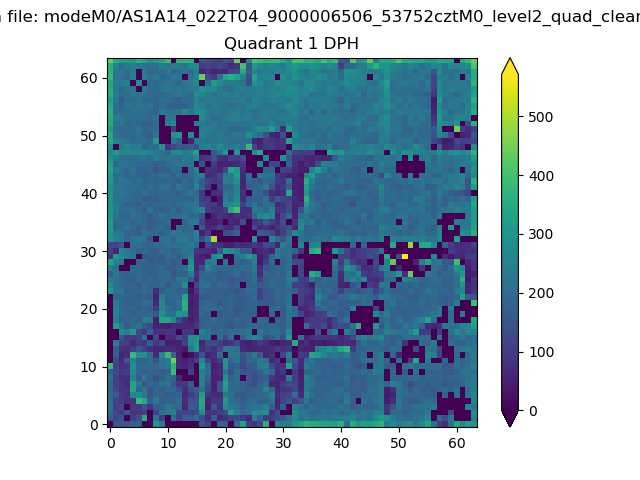 |
Quadrant B |
|---|---|---|---|
| Quadrant D | 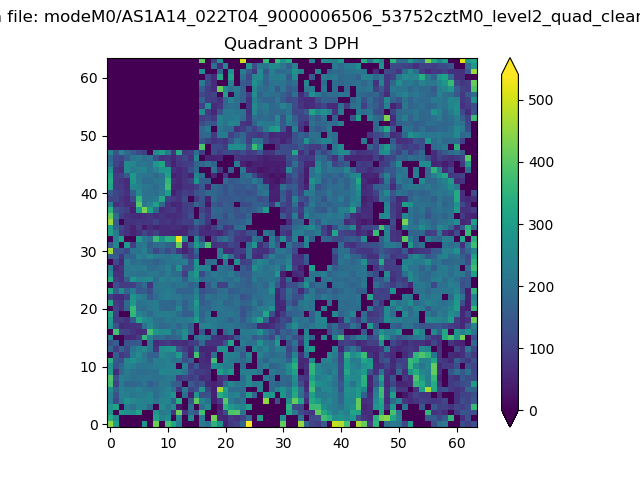 |
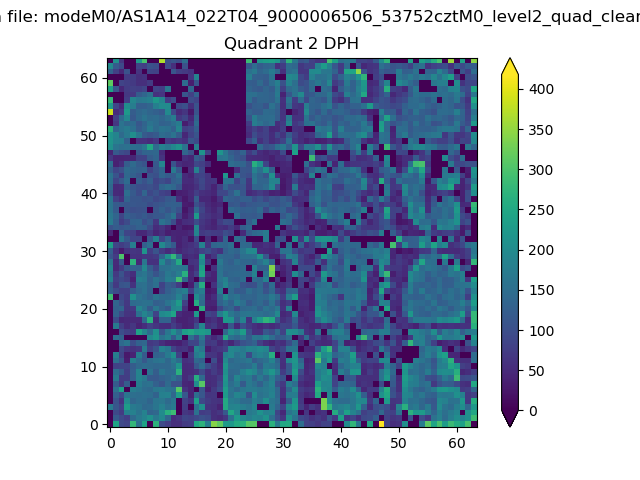 |
Quadrant C |
| Plot type | Count rate plots | Images |
|---|---|---|
| Comparison with Poisson distribution Blue bars denote a histogram of data divided into 1 sec bins. Red curve is a Poisson curve with rate = median count rate of data. |
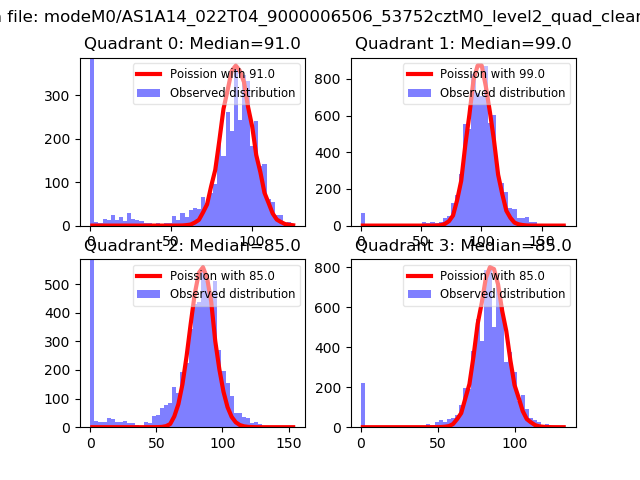 |
 |
| Quadrant-wise count rates Data is divided into 100 sec bins |
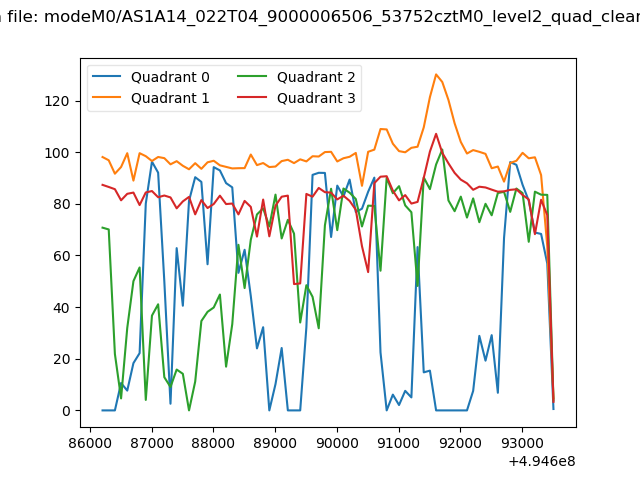 |
|
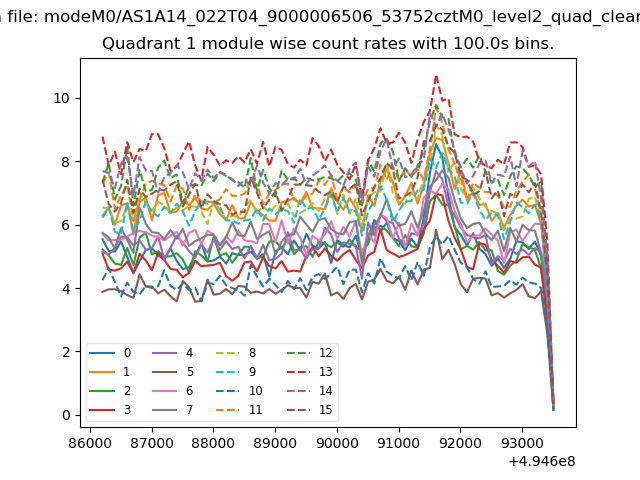
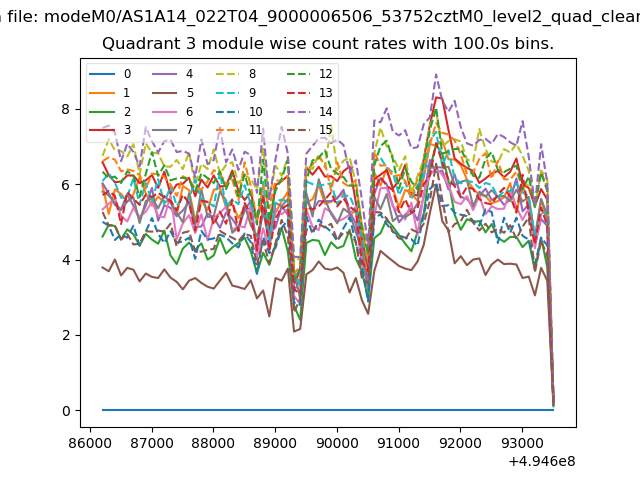
| Module-wise count rates for Quadrant A Data is divided into 100 sec bins |
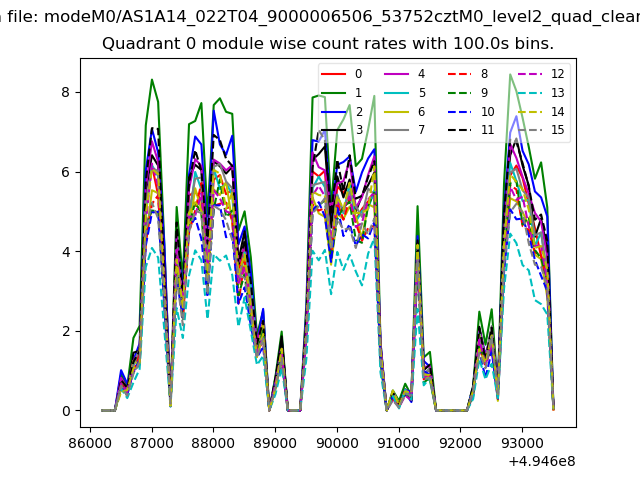 |
 |
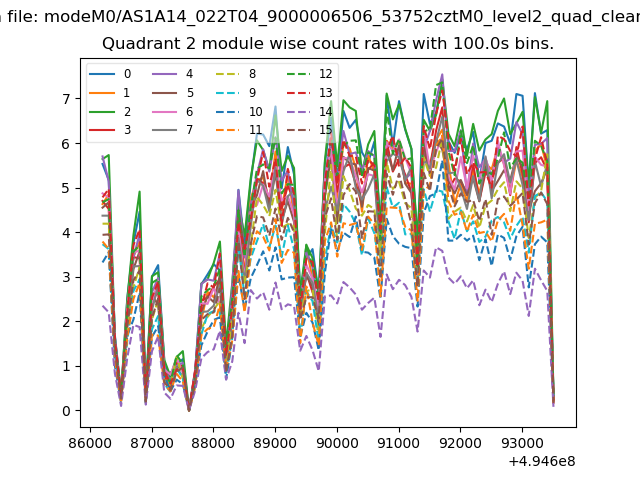
| Module-wise count rates for Quadrant B Data is divided into 100 sec bins |
 |
 |
| Module-wise count rates for Quadrant C Data is divided into 100 sec bins |
 |
 |
| Module-wise count rates for Quadrant D Data is divided into 100 sec bins |
 |
 |
| Parameter | Plot |
|---|---|
| CZT HV Monitor | 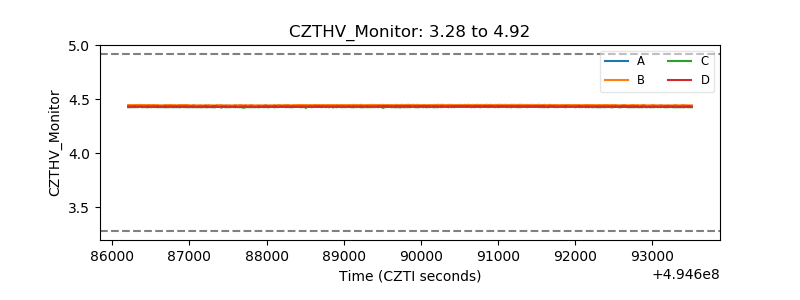 |
| D_VDD | 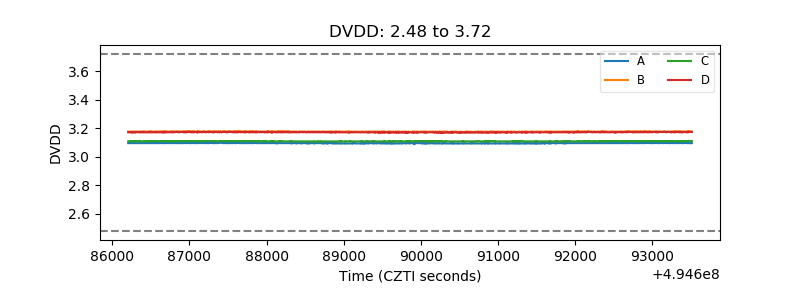 |
| Temperature 1 | 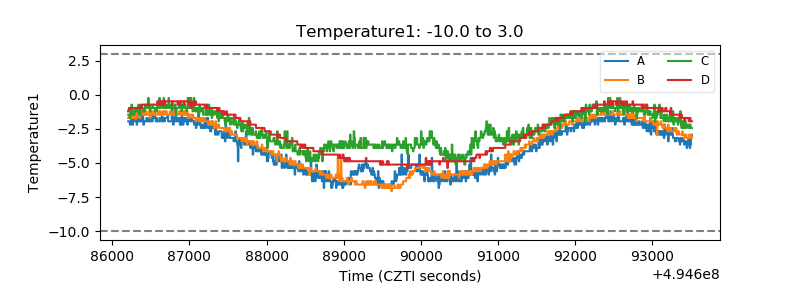 |
| Veto HV Monitor | 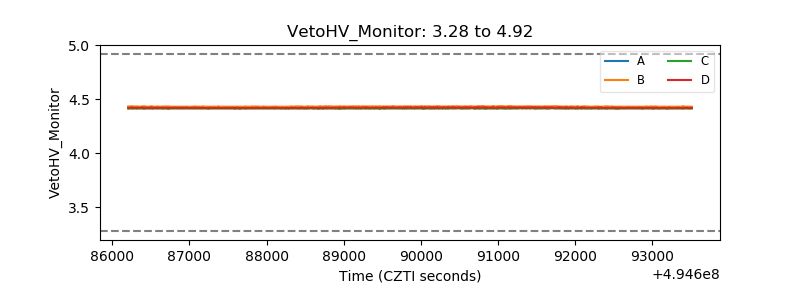 |
| Veto LLD | 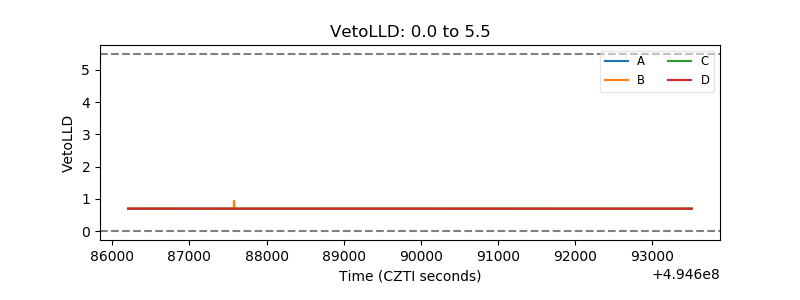 |
| Alpha Counter | 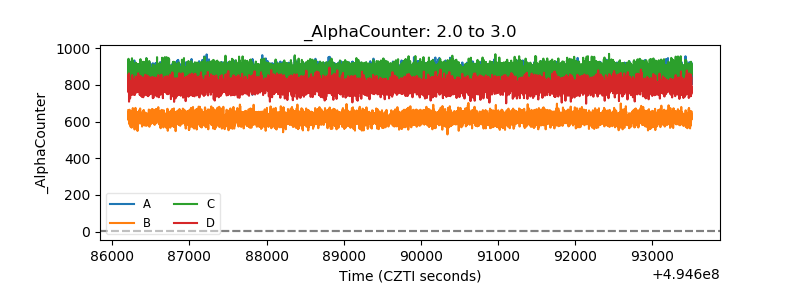 |
| _CPM_Rate |  |
| CZT Counter | 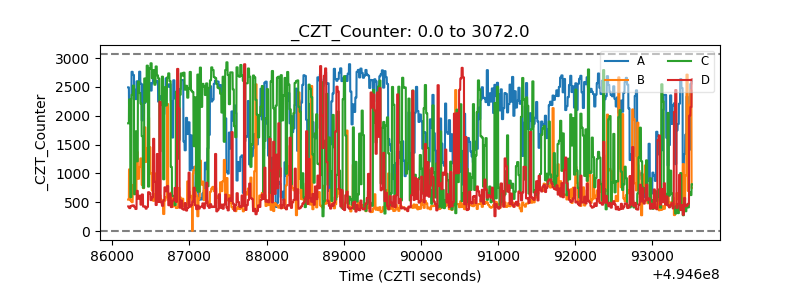 |
| +2.5 Volts monitor |  |
| +5 Volts monitor |  |
| _ROLL_ROT | 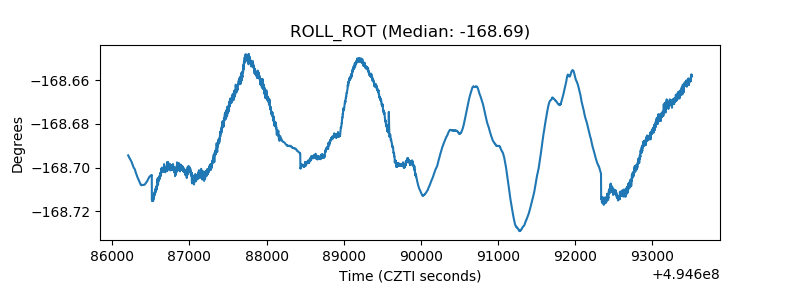 |
| _Roll_DEC | 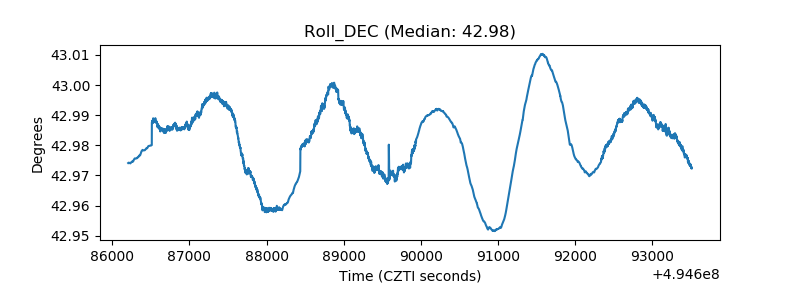 |
| _Roll_RA | 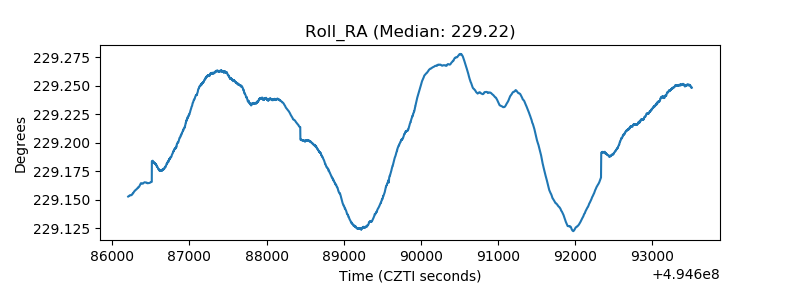 |
| Veto Counter | 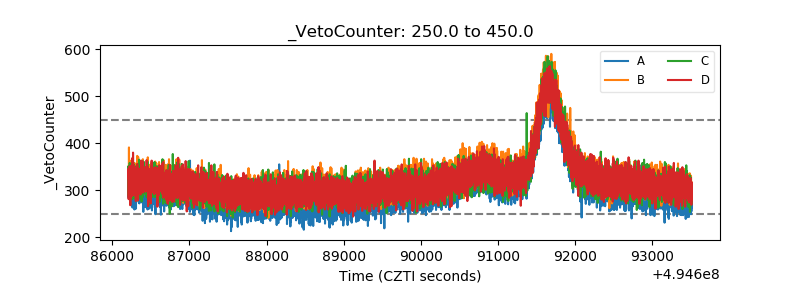 |