| Param | Original file | Final file |
|---|---|---|
| Filename | modeM0/AS1A14_022T04_9000006506_53755cztM0_level2.fits | modeM0/AS1A14_022T04_9000006506_53755cztM0_level2_quad_clean.evt |
| Size (bytes) | 2,427,649,920 | 194,376,960 |
| Size | 2.3 GB | 185.4 MB |
| Events in quadrant A | 40,158,754 | 463,543 |
| Events in quadrant B | 10,418,708 | 1,717,820 |
| Events in quadrant C | 25,469,835 | 1,045,684 |
| Events in quadrant D | 12,428,142 | 1,414,731 |
| Mode M0 | |||
|---|---|---|---|
| Quadrant | BADHDUFLAG | Total packets | Discarded packets |
| A | 0 | 131800 | 3 |
| B | 0 | 43326 | 6 |
| C | 0 | 88134 | 3 |
| D | 0 | 50149 | 3 |
| Mode SS | |||
|---|---|---|---|
| Quadrant | BADHDUFLAG | Total packets | Discarded packets |
| A | 0 | 368 | 0 |
| B | 0 | 368 | 0 |
| C | 0 | 368 | 0 |
| D | 0 | 368 | 0 |
| Mode M9 | |||
|---|---|---|---|
| Quadrant | BADHDUFLAG | Total packets | Discarded packets |
| A | 0 | 15 | 0 |
| B | 0 | 15 | 0 |
| C | 0 | 15 | 0 |
| D | 0 | 15 | 0 |
| Quadrant | Total seconds | Saturated seconds | Saturation percentage |
|---|---|---|---|
| A | 18022 | 13429 | 74.514482% |
| B | 18021 | 438 | 2.430498% |
| C | 18022 | 6046 | 33.547886% |
| D | 18022 | 1204 | 6.680724% |
Noise dominated data is calculated using 1-second bins in cleaned event files. If a bin has >2000 counts, and if more than 50% of those come from <1% of pixels, then it is considered to be noise-dominated and hence unusable.
| Quadrant | # 1 sec bins | Bins with >0 counts | Bins with >2000 counts | High rate bins dominated by noise | Noise dominated (total time) | Noise dominated (detector-on time) | Marked lightcurve |
|---|---|---|---|---|---|---|---|
| A | 19551 | 18021 | 13185 | 13185 | 67.44% | 73.16% | 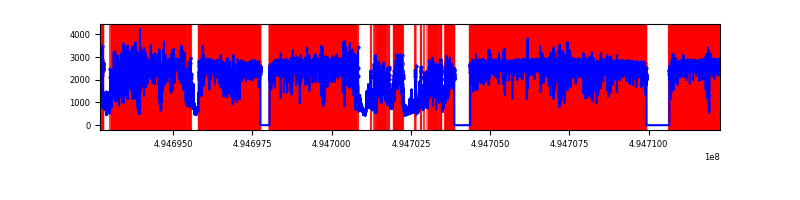 |
| B | 19551 | 18024 | 287 | 287 | 1.47% | 1.59% | 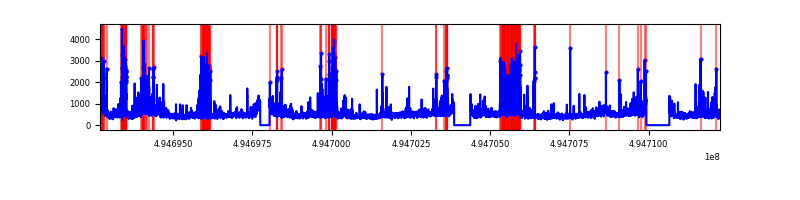 |
| C | 19552 | 18023 | 5787 | 5787 | 29.60% | 32.11% | 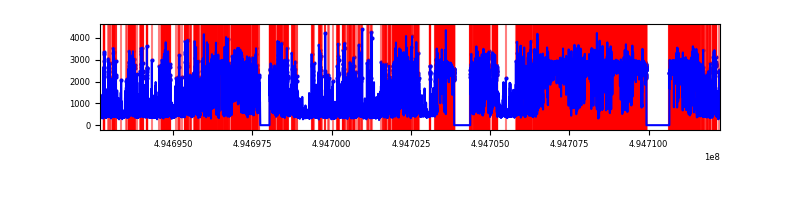 |
| D | 19551 | 18023 | 1148 | 1148 | 5.87% | 6.37% | 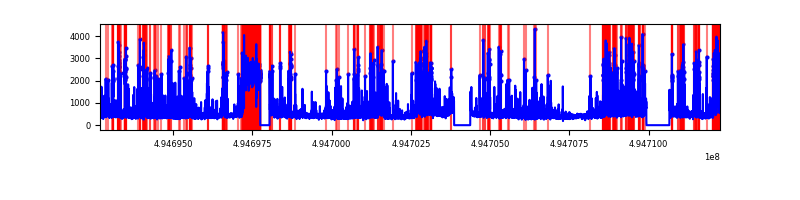 |
Top three noisy pixels from each quadrant. If the there are fewer than three noisy pixels in the level2.evt file, extra rows are filled as -1
| Pixel properties | Quadrant properties | ||||||
|---|---|---|---|---|---|---|---|
| Quadrant | DetID | PixID | Counts | Sigma | Mean | Median | Sigma |
| A | 3 | 63 | 33176886 | 118493.0 | 1132 | 1107 | 280.0 |
| A | 3 | 78 | 876693 | 3127.31 | 1132 | 1107 | 280.0 |
| A | 0 | 8 | 589213 | 2100.52 | 1132 | 1107 | 280.0 |
| B | 4 | 81 | 1165657 | 2978.65 | 1837 | 1771 | 390.7 |
| B | 7 | 0 | 911418 | 2328.0 | 1837 | 1771 | 390.7 |
| B | 0 | 213 | 278512 | 708.24 | 1837 | 1771 | 390.7 |
| C | 1 | 241 | 11046592 | 26871.08 | 1479 | 1464 | 411.0 |
| C | 15 | 224 | 5882180 | 14306.87 | 1479 | 1464 | 411.0 |
| C | 3 | 242 | 811660 | 1971.08 | 1479 | 1464 | 411.0 |
| D | 2 | 172 | 1676819 | 3250.8 | 1779 | 1696 | 515.3 |
| D | 7 | 70 | 1353674 | 2623.7 | 1779 | 1696 | 515.3 |
| D | 8 | 176 | 578741 | 1119.83 | 1779 | 1696 | 515.3 |
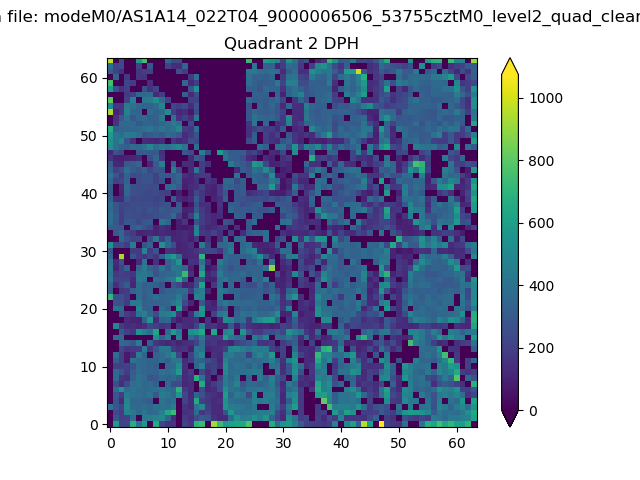
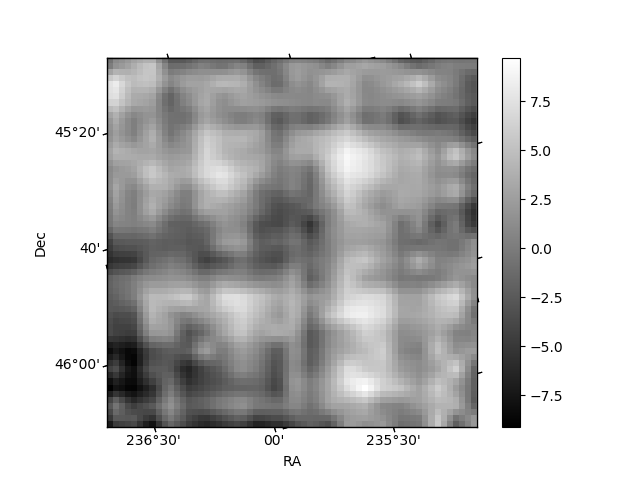
Histogram calculated using DETX and DETY for each event in the final _common_clean file
| Quadrant A | 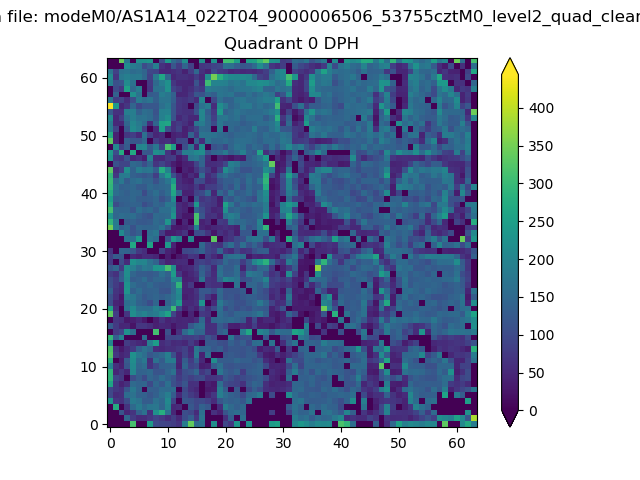 |
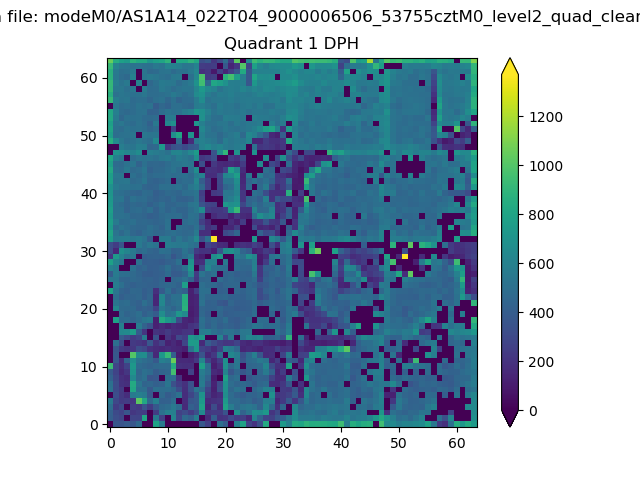 |
Quadrant B |
|---|---|---|---|
| Quadrant D | 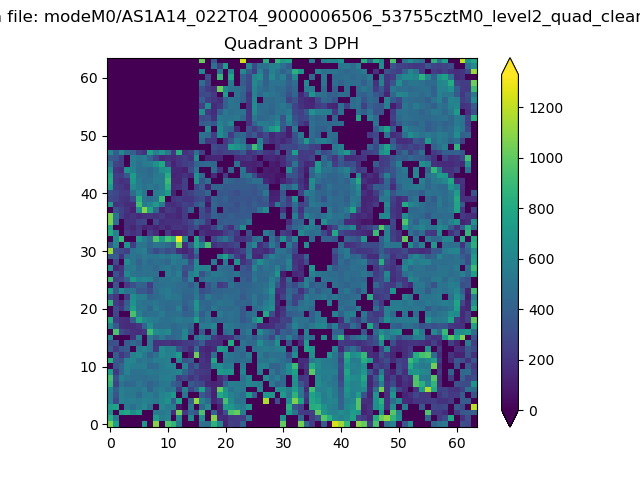 |
 |
Quadrant C |
| Plot type | Count rate plots | Images |
|---|---|---|
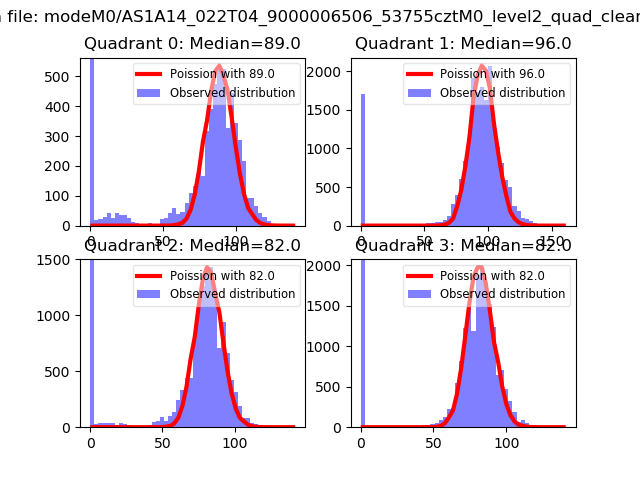
| Comparison with Poisson distribution Blue bars denote a histogram of data divided into 1 sec bins. Red curve is a Poisson curve with rate = median count rate of data. |
 |
 |
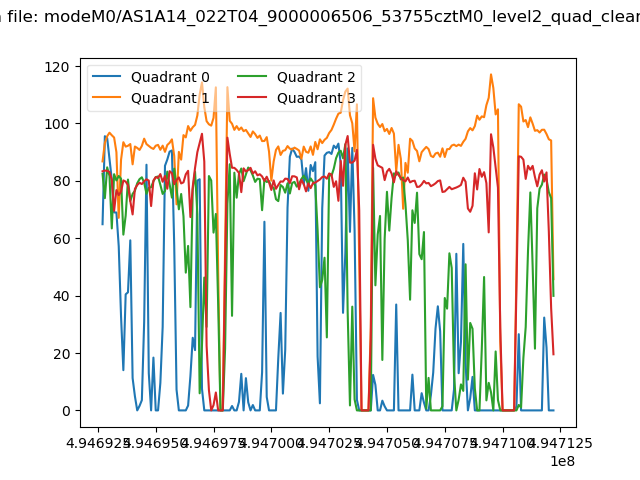
| Quadrant-wise count rates Data is divided into 100 sec bins |
 |
|
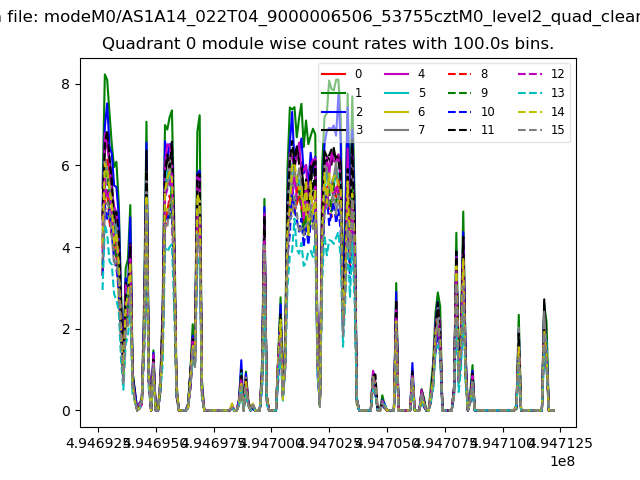
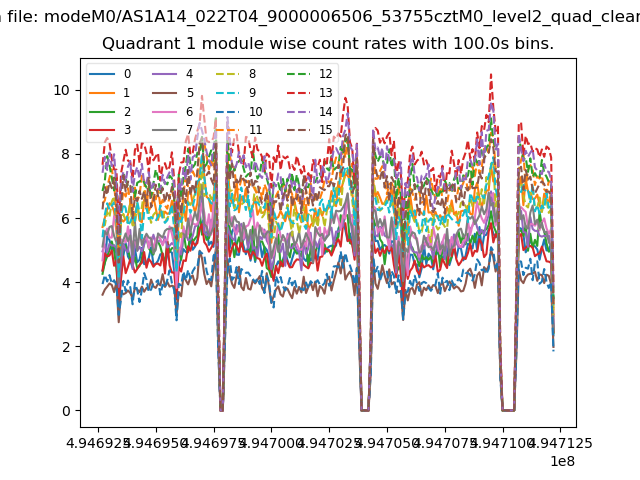
| Module-wise count rates for Quadrant A Data is divided into 100 sec bins |
 |
 |
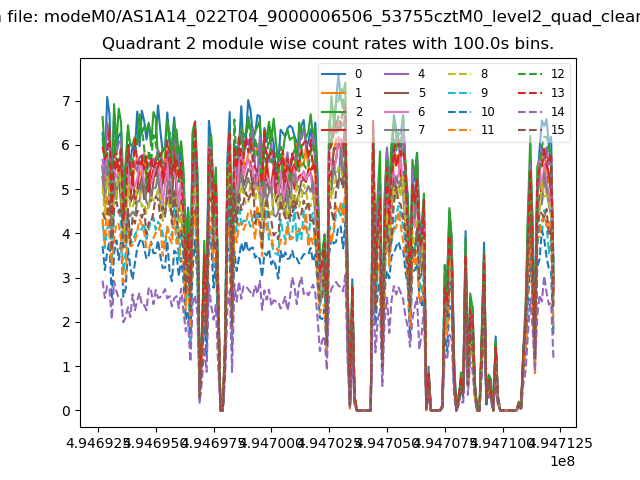
| Module-wise count rates for Quadrant B Data is divided into 100 sec bins |
 |
 |
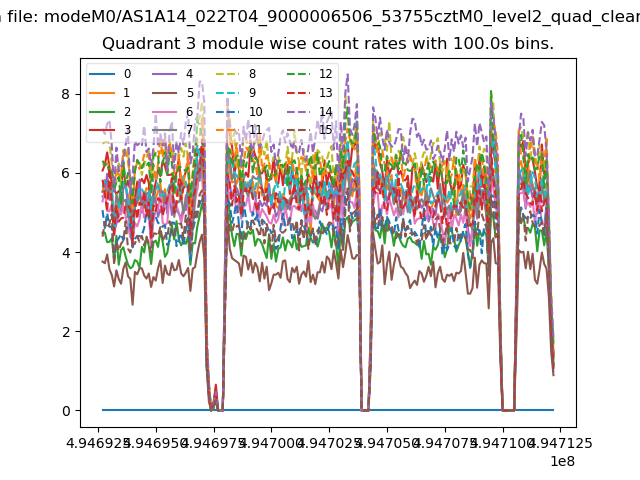
| Module-wise count rates for Quadrant C Data is divided into 100 sec bins |
 |
 |
| Module-wise count rates for Quadrant D Data is divided into 100 sec bins |
 |
 |
| Parameter | Plot |
|---|---|
| CZT HV Monitor | 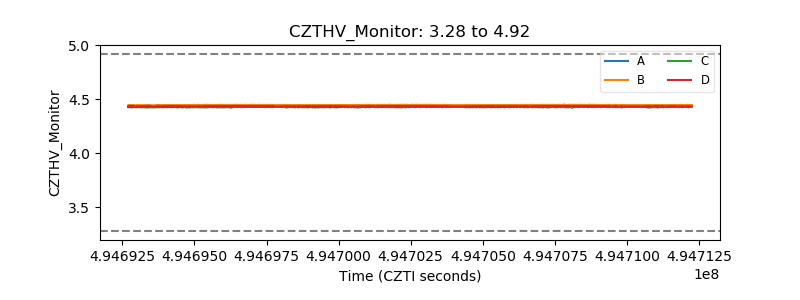 |
| D_VDD | 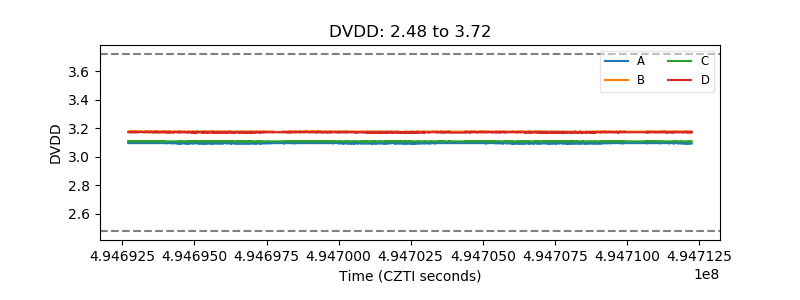 |
| Temperature 1 | 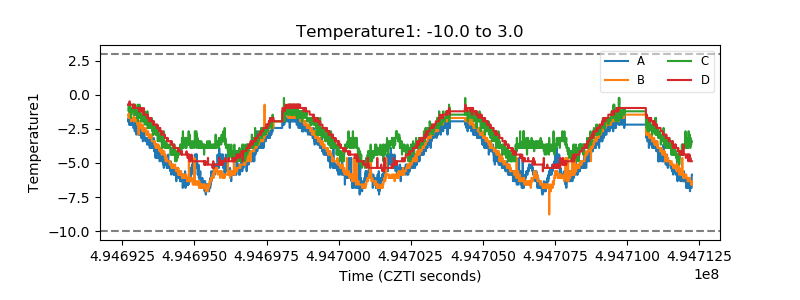 |
| Veto HV Monitor | 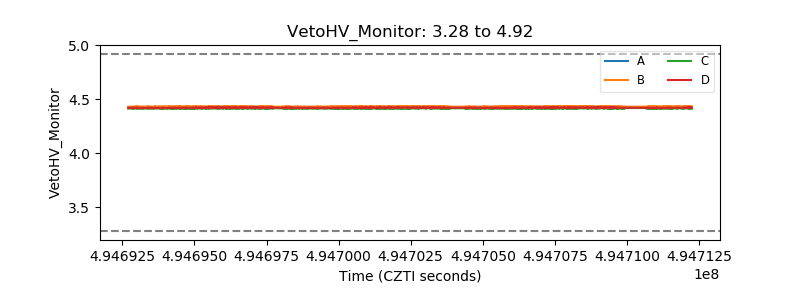 |
| Veto LLD | 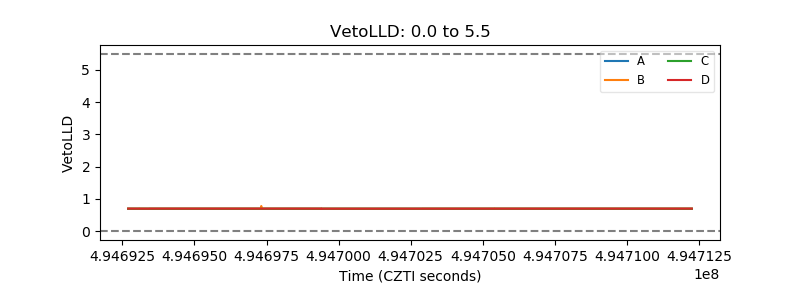 |
| Alpha Counter | 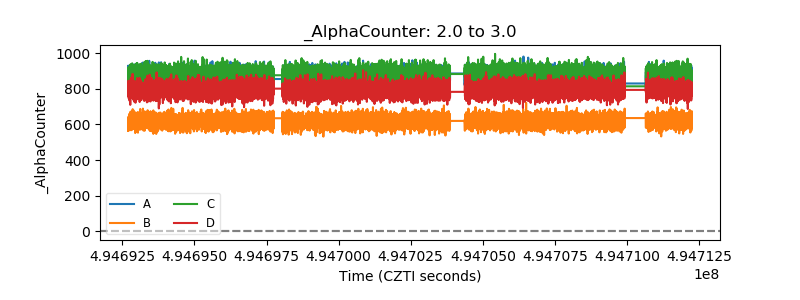 |
| _CPM_Rate | 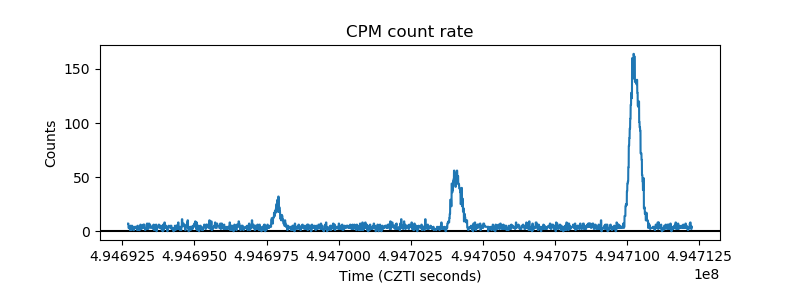 |
| CZT Counter | 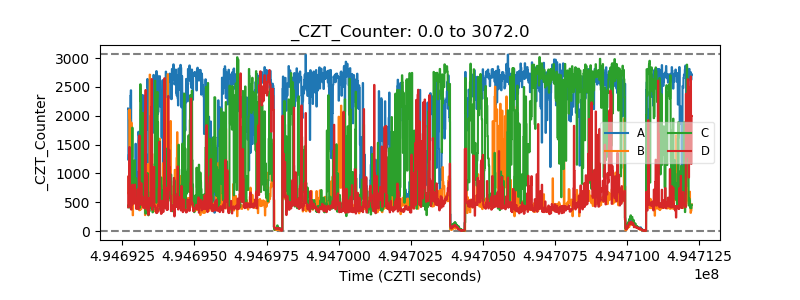 |
| +2.5 Volts monitor |  |
| +5 Volts monitor | 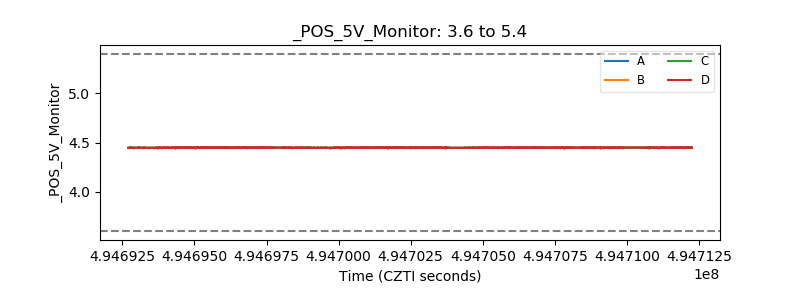 |
| _ROLL_ROT | 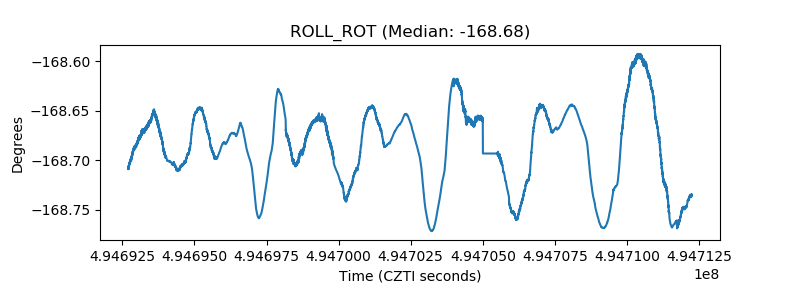 |
| _Roll_DEC | 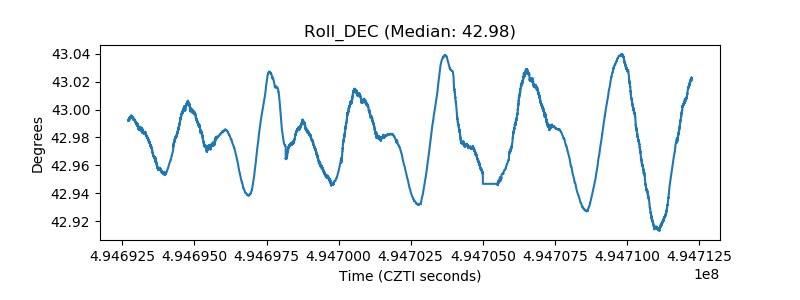 |
| _Roll_RA | 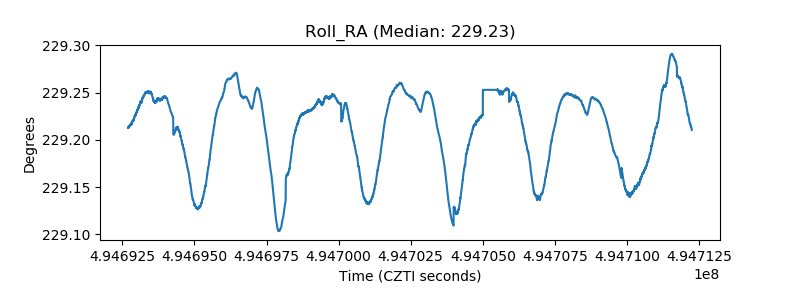 |
| Veto Counter | 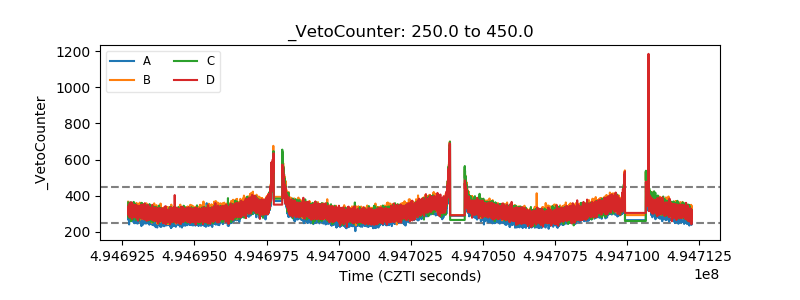 |