| Param | Original file | Final file |
|---|---|---|
| Filename | modeM0/AS1A14_022T04_9000006506_53756cztM0_level2.fits | modeM0/AS1A14_022T04_9000006506_53756cztM0_level2_quad_clean.evt |
| Size (bytes) | 976,187,520 | 76,011,840 |
| Size | 931.0 MB | 72.5 MB |
| Events in quadrant A | 17,159,905 | 79,796 |
| Events in quadrant B | 3,690,289 | 682,948 |
| Events in quadrant C | 8,230,332 | 495,980 |
| Events in quadrant D | 6,516,919 | 557,844 |
| Mode M0 | |||
|---|---|---|---|
| Quadrant | BADHDUFLAG | Total packets | Discarded packets |
| A | 0 | 55777 | 1 |
| B | 0 | 16130 | 1 |
| C | 0 | 29309 | 1 |
| D | 0 | 24255 | 1 |
| Mode SS | |||
|---|---|---|---|
| Quadrant | BADHDUFLAG | Total packets | Discarded packets |
| A | 0 | 142 | 0 |
| B | 0 | 142 | 0 |
| C | 0 | 142 | 0 |
| D | 0 | 142 | 0 |
| Mode M9 | |||
|---|---|---|---|
| Quadrant | BADHDUFLAG | Total packets | Discarded packets |
| A | 0 | 9 | 0 |
| B | 0 | 9 | 0 |
| C | 0 | 9 | 0 |
| D | 0 | 9 | 0 |
| Quadrant | Total seconds | Saturated seconds | Saturation percentage |
|---|---|---|---|
| A | 6952 | 6221 | 89.485040% |
| B | 6953 | 131 | 1.884079% |
| C | 6953 | 1550 | 22.292536% |
| D | 6953 | 608 | 8.744427% |
Noise dominated data is calculated using 1-second bins in cleaned event files. If a bin has >2000 counts, and if more than 50% of those come from <1% of pixels, then it is considered to be noise-dominated and hence unusable.
| Quadrant | # 1 sec bins | Bins with >0 counts | Bins with >2000 counts | High rate bins dominated by noise | Noise dominated (total time) | Noise dominated (detector-on time) | Marked lightcurve |
|---|---|---|---|---|---|---|---|
| A | 7842 | 6952 | 6111 | 6111 | 77.93% | 87.90% | 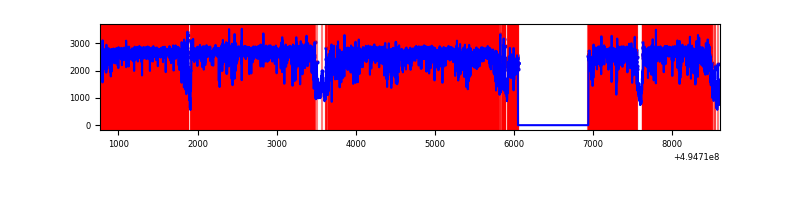 |
| B | 7843 | 6954 | 74 | 74 | 0.94% | 1.06% | 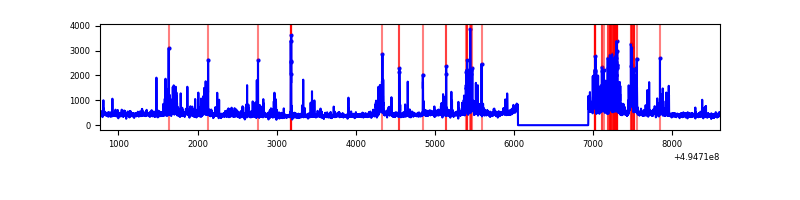 |
| C | 7843 | 6953 | 1443 | 1443 | 18.40% | 20.75% | 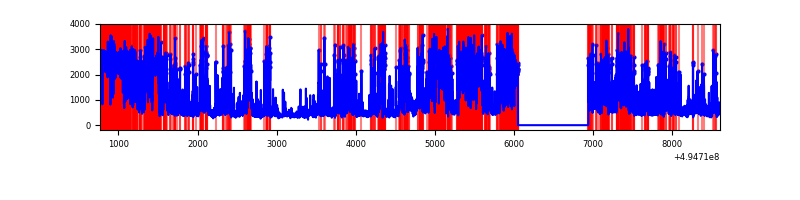 |
| D | 7843 | 6954 | 694 | 694 | 8.85% | 9.98% | 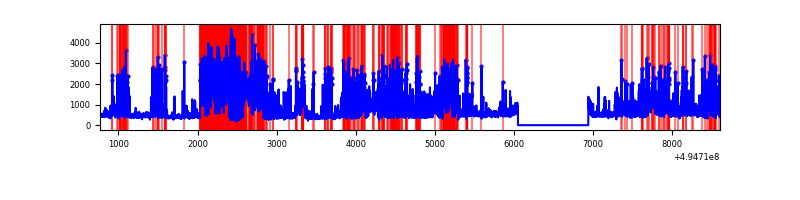 |
Top three noisy pixels from each quadrant. If the there are fewer than three noisy pixels in the level2.evt file, extra rows are filled as -1
| Pixel properties | Quadrant properties | ||||||
|---|---|---|---|---|---|---|---|
| Quadrant | DetID | PixID | Counts | Sigma | Mean | Median | Sigma |
| A | 3 | 63 | 15081583 | 159331.39 | 375 | 366 | 94.7 |
| A | 8 | 245 | 264198 | 2787.36 | 375 | 366 | 94.7 |
| A | 3 | 78 | 75012 | 788.63 | 375 | 366 | 94.7 |
| B | 4 | 81 | 493682 | 3222.44 | 710 | 684 | 153.0 |
| B | 6 | 255 | 117484 | 763.45 | 710 | 684 | 153.0 |
| B | 5 | 185 | 69820 | 451.9 | 710 | 684 | 153.0 |
| C | 15 | 224 | 2864883 | 16506.07 | 627 | 620 | 173.5 |
| C | 1 | 241 | 2383654 | 13732.86 | 627 | 620 | 173.5 |
| C | 13 | 3 | 125752 | 721.11 | 627 | 620 | 173.5 |
| D | 2 | 172 | 2873484 | 14695.81 | 684 | 655 | 195.5 |
| D | 2 | 120 | 160498 | 817.67 | 684 | 655 | 195.5 |
| D | 10 | 172 | 150676 | 767.42 | 684 | 655 | 195.5 |
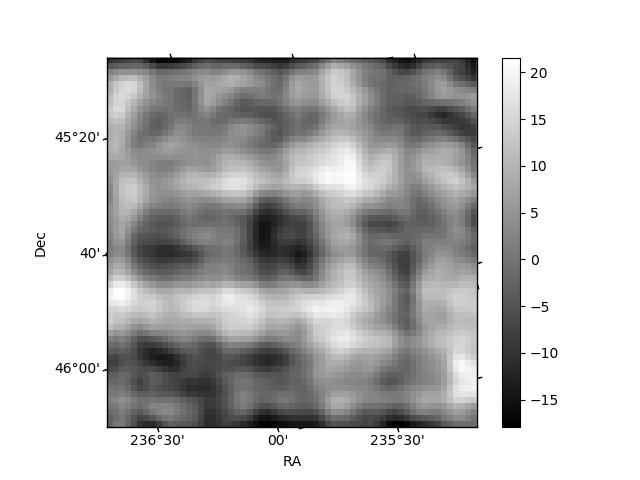
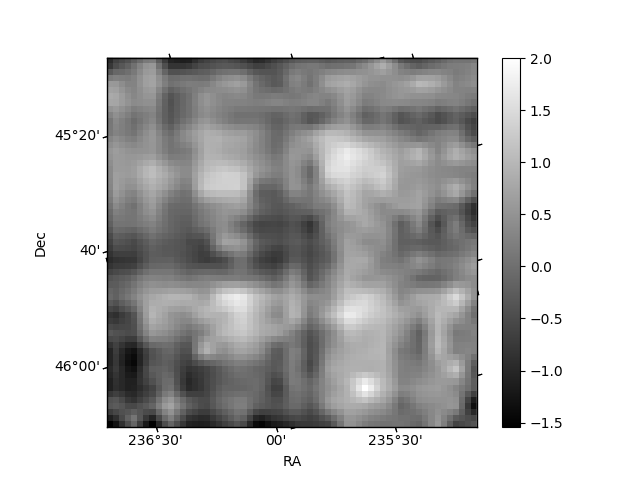
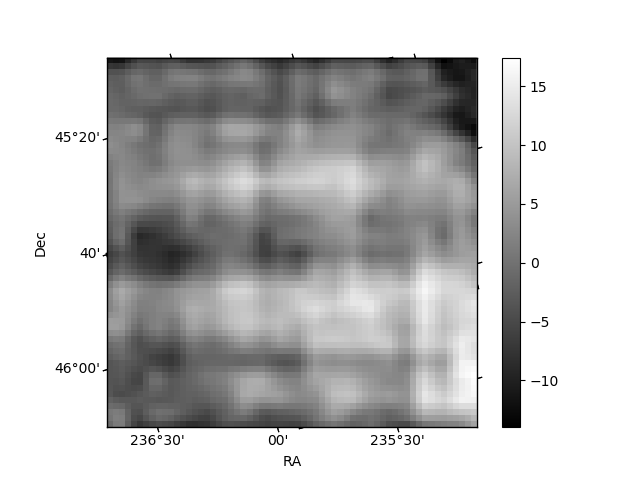
Histogram calculated using DETX and DETY for each event in the final _common_clean file
| Quadrant A | 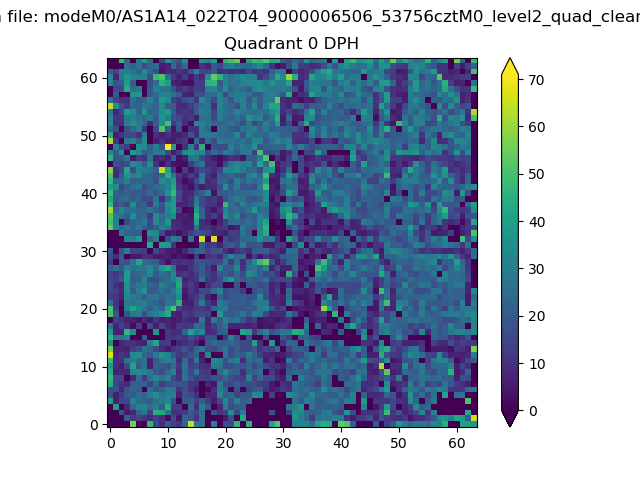 |
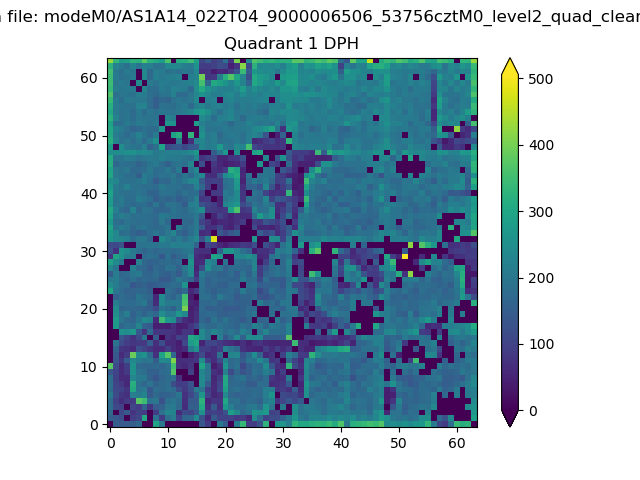 |
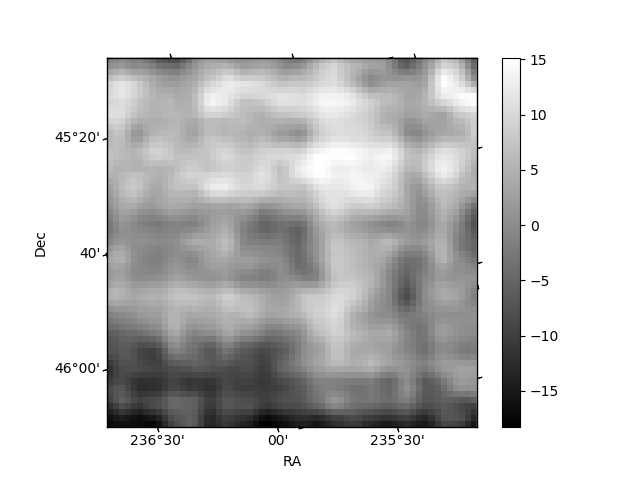
Quadrant B |
|---|---|---|---|
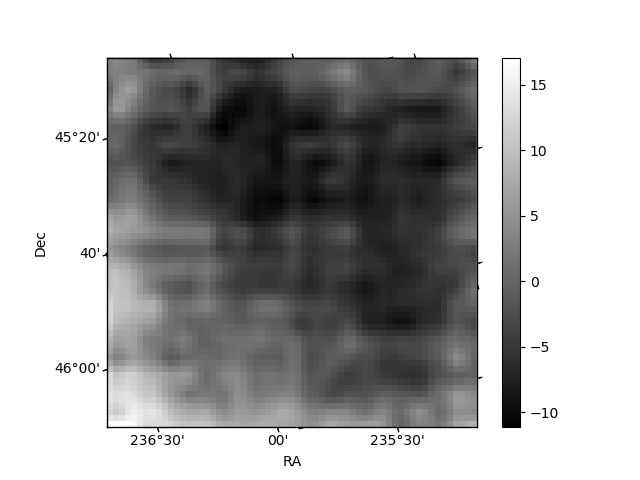
| Quadrant D | 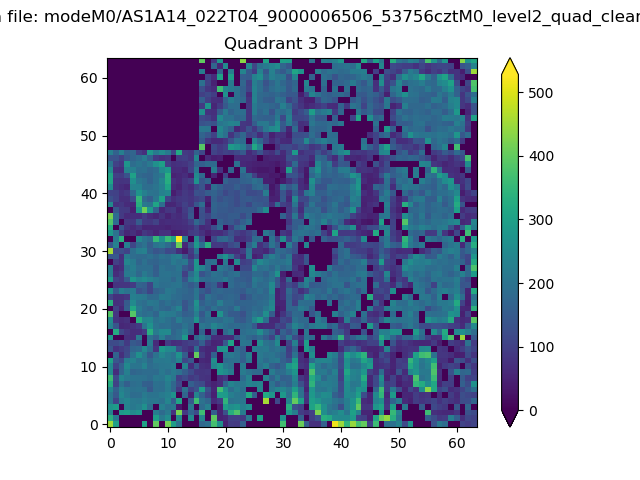 |
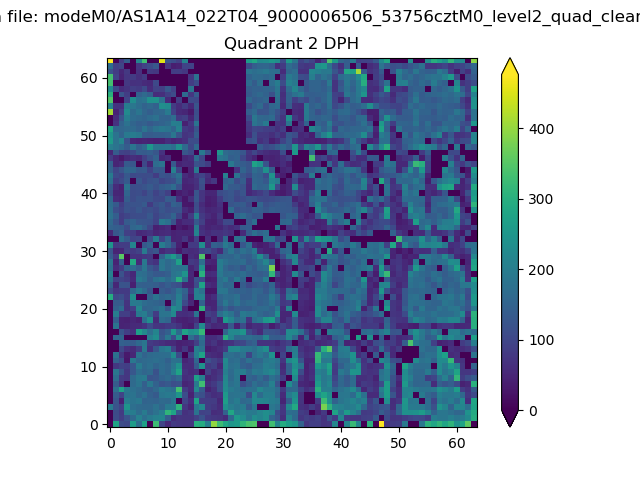 |
Quadrant C |
| Plot type | Count rate plots | Images |
|---|---|---|
| Comparison with Poisson distribution Blue bars denote a histogram of data divided into 1 sec bins. Red curve is a Poisson curve with rate = median count rate of data. |
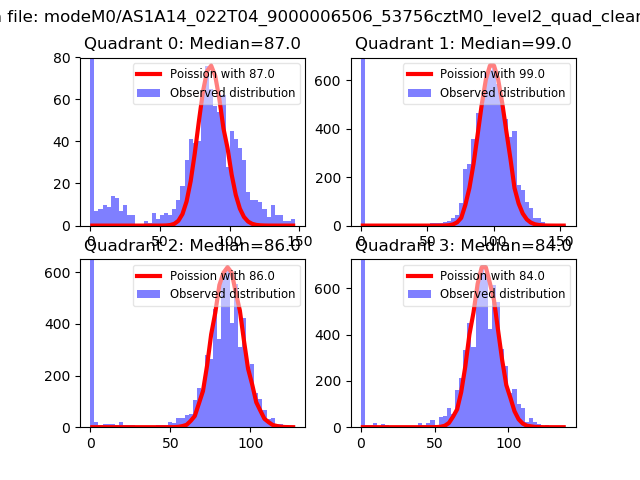 |
 |
| Quadrant-wise count rates Data is divided into 100 sec bins |
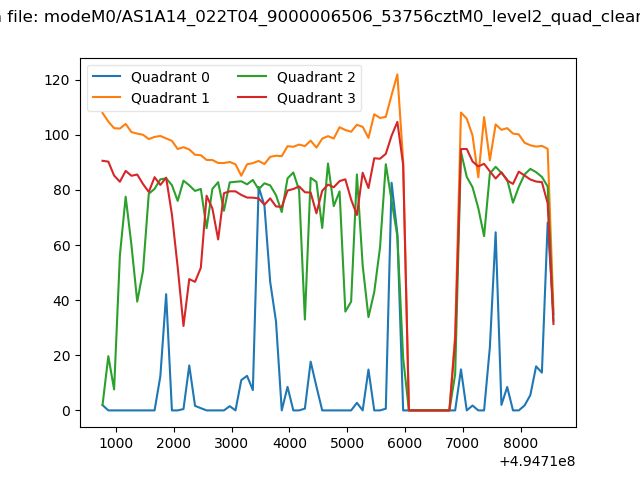 |
|
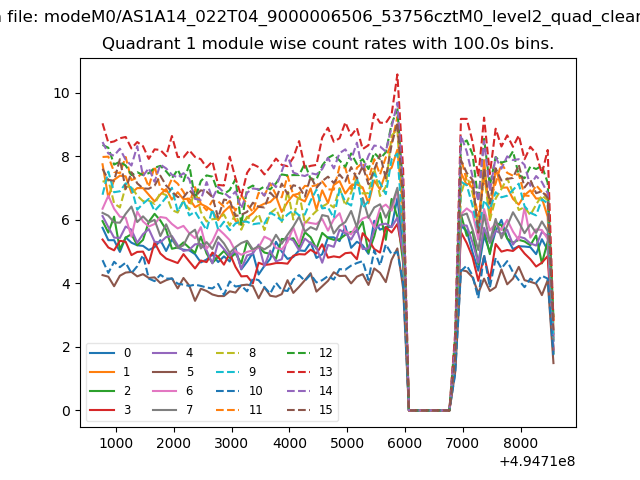
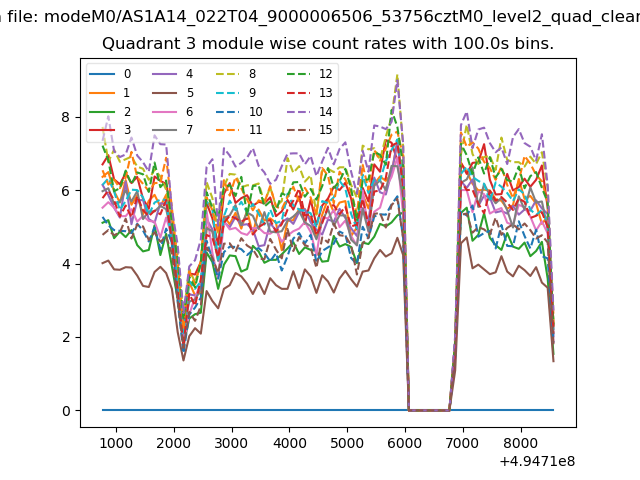
| Module-wise count rates for Quadrant A Data is divided into 100 sec bins |
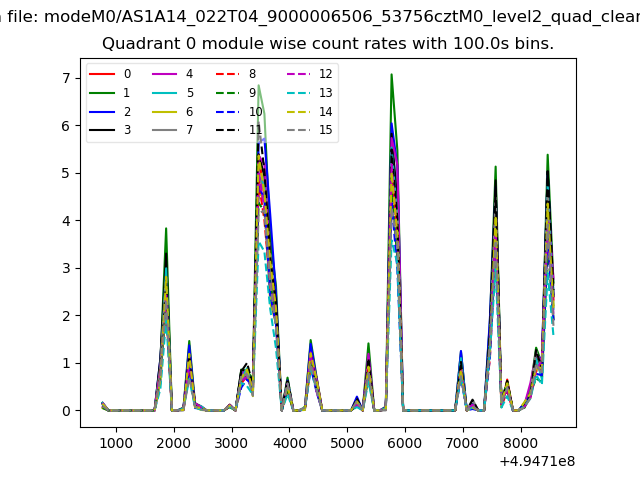 |
 |
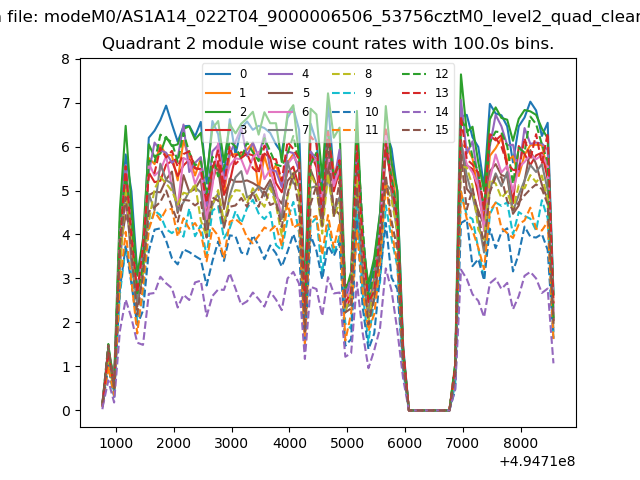
| Module-wise count rates for Quadrant B Data is divided into 100 sec bins |
 |
 |
| Module-wise count rates for Quadrant C Data is divided into 100 sec bins |
 |
 |
| Module-wise count rates for Quadrant D Data is divided into 100 sec bins |
 |
 |
| Parameter | Plot |
|---|---|
| CZT HV Monitor | 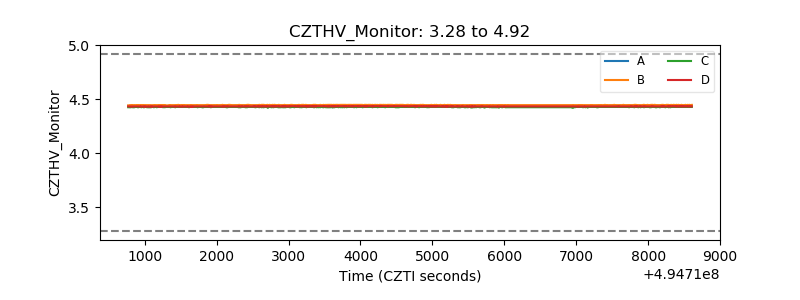 |
| D_VDD | 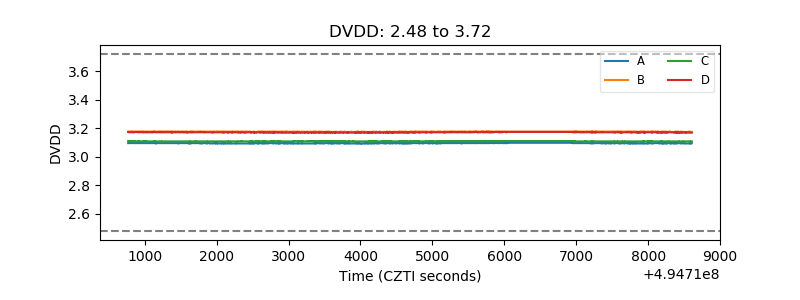 |
| Temperature 1 | 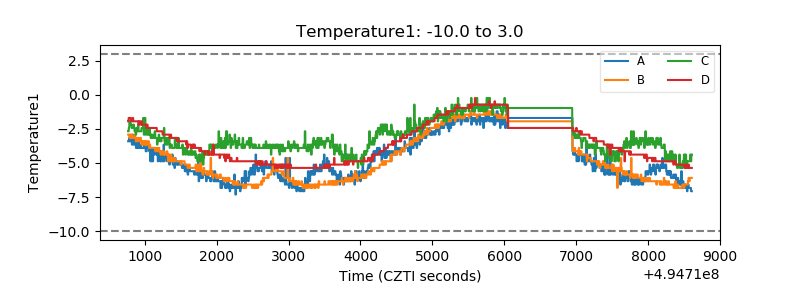 |
| Veto HV Monitor | 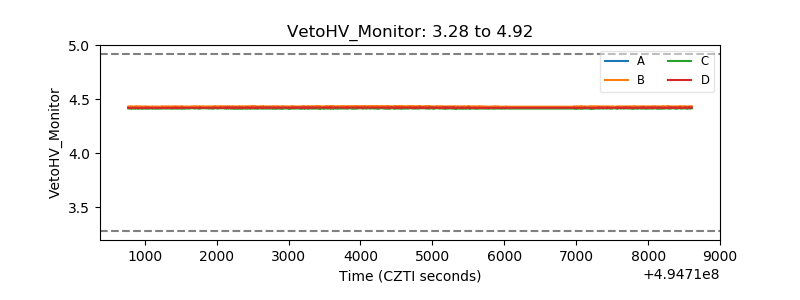 |
| Veto LLD | 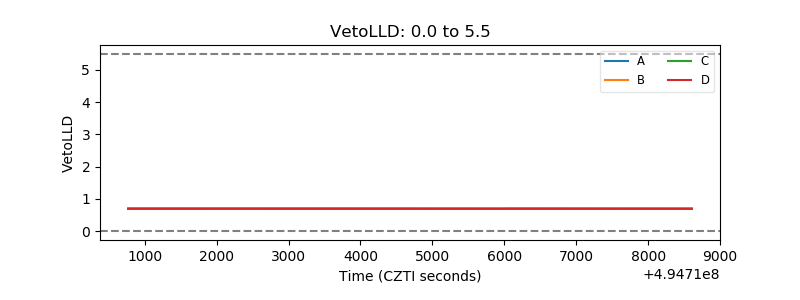 |
| Alpha Counter | 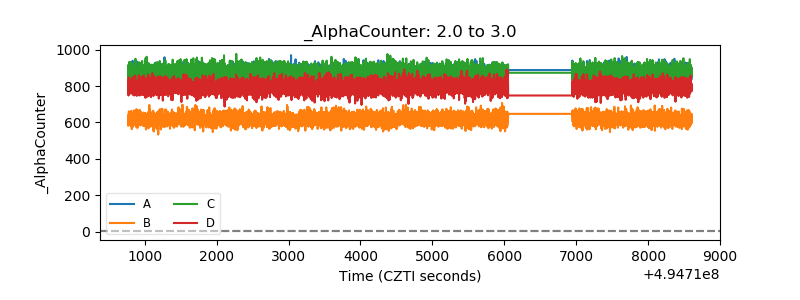 |
| _CPM_Rate | 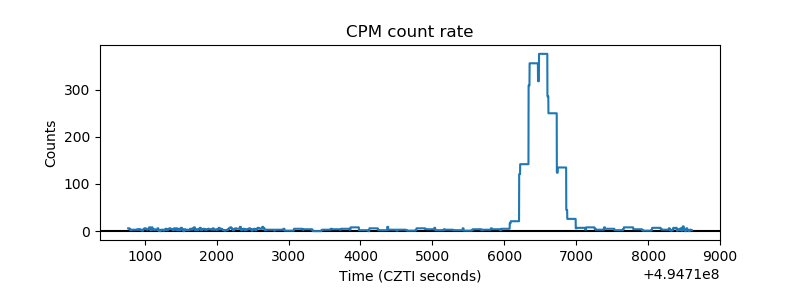 |
| CZT Counter | 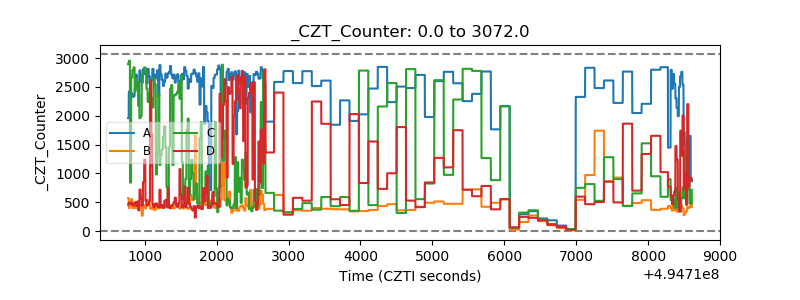 |
| +2.5 Volts monitor | 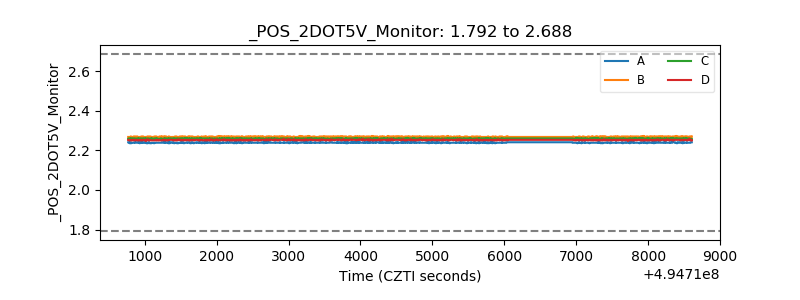 |
| +5 Volts monitor | 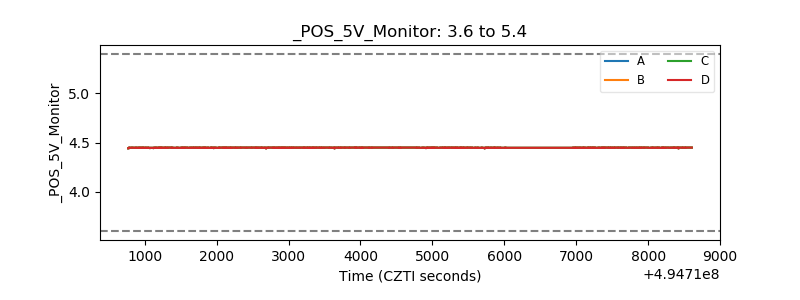 |
| _ROLL_ROT | 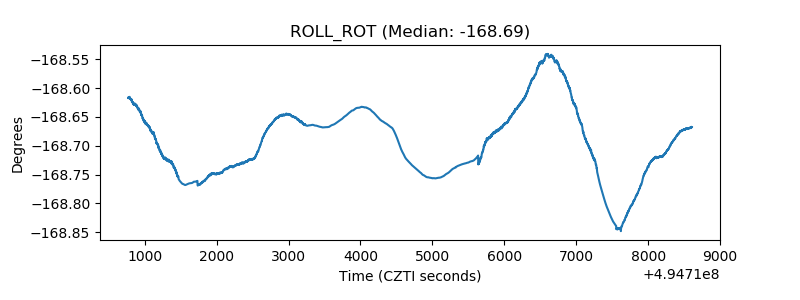 |
| _Roll_DEC | 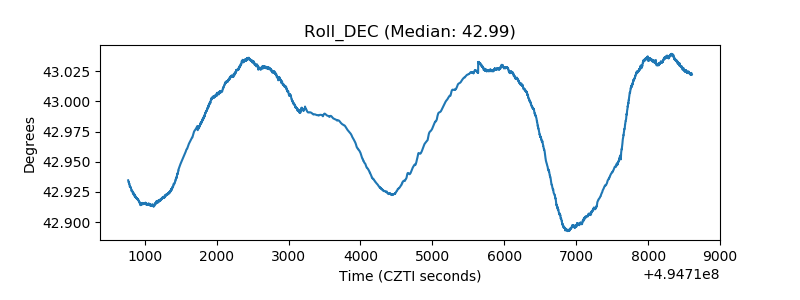 |
| _Roll_RA | 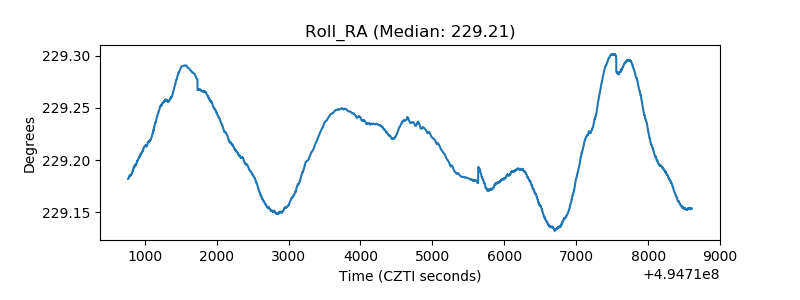 |
| Veto Counter | 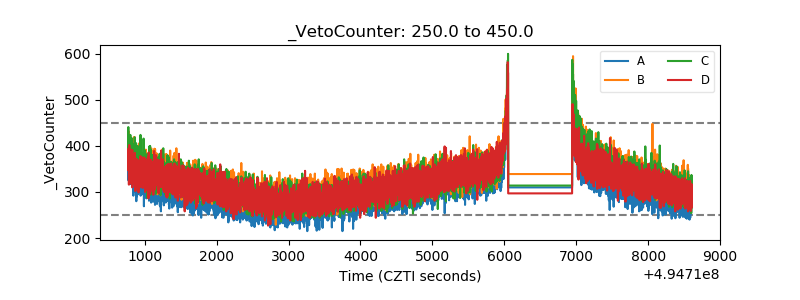 |