| Param | Original file | Final file |
|---|---|---|
| Filename | modeM0/AS1A14_022T04_9000006506_53759cztM0_level2.fits | modeM0/AS1A14_022T04_9000006506_53759cztM0_level2_quad_clean.evt |
| Size (bytes) | 914,800,320 | 65,969,280 |
| Size | 872.4 MB | 62.9 MB |
| Events in quadrant A | 14,300,698 | 132,942 |
| Events in quadrant B | 2,913,071 | 624,039 |
| Events in quadrant C | 10,927,397 | 303,390 |
| Events in quadrant D | 5,250,040 | 510,817 |
| Mode M0 | |||
|---|---|---|---|
| Quadrant | BADHDUFLAG | Total packets | Discarded packets |
| A | 0 | 46733 | 1 |
| B | 0 | 13158 | 1 |
| C | 0 | 36652 | 7 |
| D | 0 | 19921 | 1 |
| Mode SS | |||
|---|---|---|---|
| Quadrant | BADHDUFLAG | Total packets | Discarded packets |
| A | 0 | 124 | 0 |
| B | 0 | 124 | 0 |
| C | 0 | 124 | 0 |
| D | 0 | 124 | 0 |
| Mode M9 | |||
|---|---|---|---|
| Quadrant | BADHDUFLAG | Total packets | Discarded packets |
| A | 0 | 11 | 0 |
| B | 0 | 11 | 0 |
| C | 0 | 11 | 0 |
| D | 0 | 11 | 0 |
| Quadrant | Total seconds | Saturated seconds | Saturation percentage |
|---|---|---|---|
| A | 6099 | 4871 | 79.865552% |
| B | 6100 | 99 | 1.622951% |
| C | 6099 | 3032 | 49.713068% |
| D | 6099 | 471 | 7.722577% |
Noise dominated data is calculated using 1-second bins in cleaned event files. If a bin has >2000 counts, and if more than 50% of those come from <1% of pixels, then it is considered to be noise-dominated and hence unusable.
| Quadrant | # 1 sec bins | Bins with >0 counts | Bins with >2000 counts | High rate bins dominated by noise | Noise dominated (total time) | Noise dominated (detector-on time) | Marked lightcurve |
|---|---|---|---|---|---|---|---|
| A | 7199 | 6099 | 4911 | 4911 | 68.22% | 80.52% | 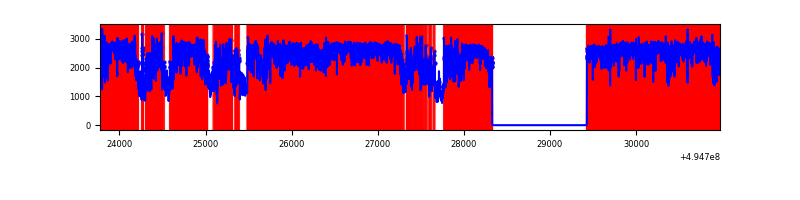 |
| B | 7200 | 6100 | 33 | 33 | 0.46% | 0.54% | 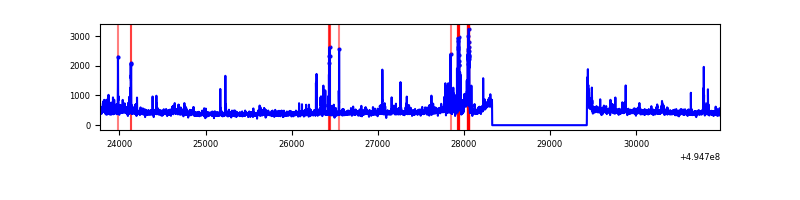 |
| C | 7198 | 6098 | 2996 | 2996 | 41.62% | 49.13% | 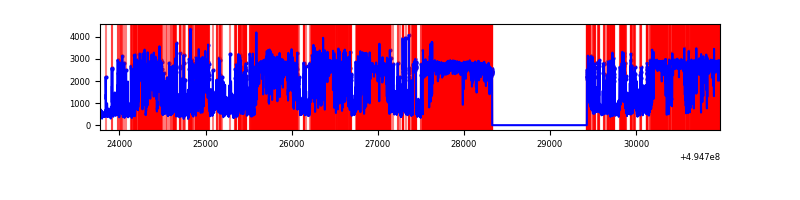 |
| D | 7199 | 6100 | 531 | 531 | 7.38% | 8.70% | 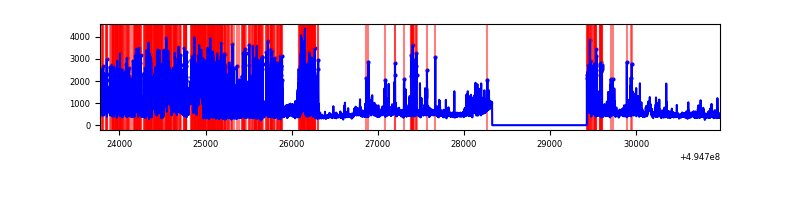 |
Top three noisy pixels from each quadrant. If the there are fewer than three noisy pixels in the level2.evt file, extra rows are filled as -1
| Pixel properties | Quadrant properties | ||||||
|---|---|---|---|---|---|---|---|
| Quadrant | DetID | PixID | Counts | Sigma | Mean | Median | Sigma |
| A | 3 | 63 | 12415209 | 122760.47 | 408 | 399 | 101.1 |
| A | 12 | 3 | 131487 | 1296.23 | 408 | 399 | 101.1 |
| A | 3 | 78 | 35069 | 342.82 | 408 | 399 | 101.1 |
| B | 0 | 213 | 184313 | 1333.1 | 641 | 619 | 137.8 |
| B | 5 | 185 | 71959 | 517.73 | 641 | 619 | 137.8 |
| B | 4 | 81 | 31932 | 227.24 | 641 | 619 | 137.8 |
| C | 1 | 241 | 6180197 | 48951.84 | 456 | 452 | 126.2 |
| C | 15 | 224 | 2448832 | 19394.44 | 456 | 452 | 126.2 |
| C | 13 | 3 | 167738 | 1325.13 | 456 | 452 | 126.2 |
| D | 2 | 172 | 2019861 | 11490.83 | 611 | 584 | 175.7 |
| D | 10 | 172 | 373389 | 2121.47 | 611 | 584 | 175.7 |
| D | 2 | 120 | 108909 | 616.43 | 611 | 584 | 175.7 |
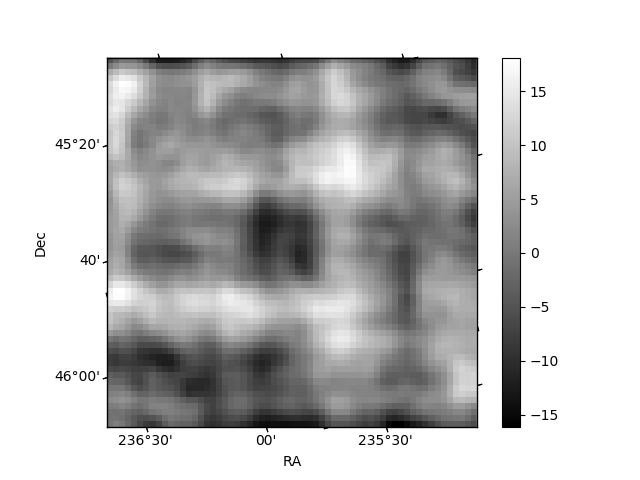
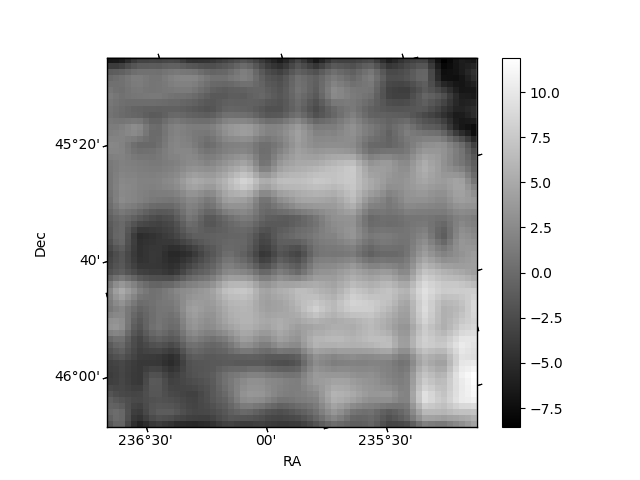
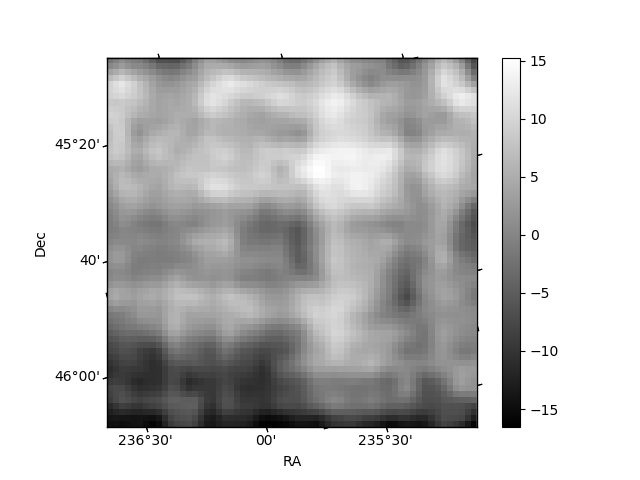
Histogram calculated using DETX and DETY for each event in the final _common_clean file
| Quadrant A | 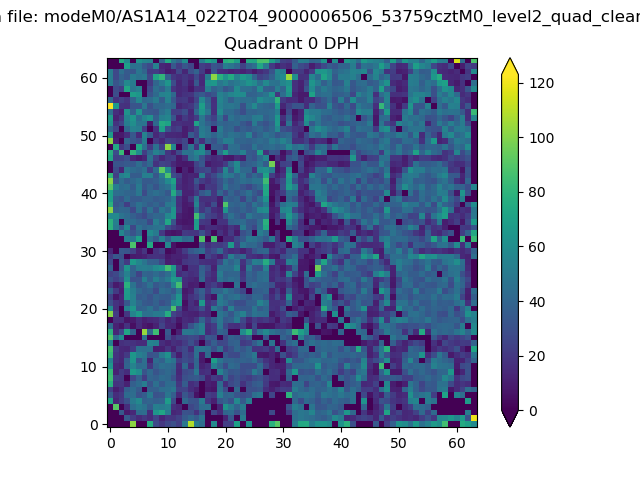 |
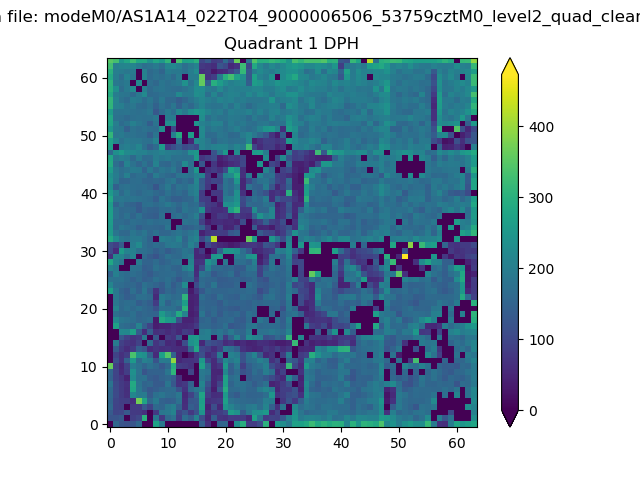 |
Quadrant B |
|---|---|---|---|
| Quadrant D | 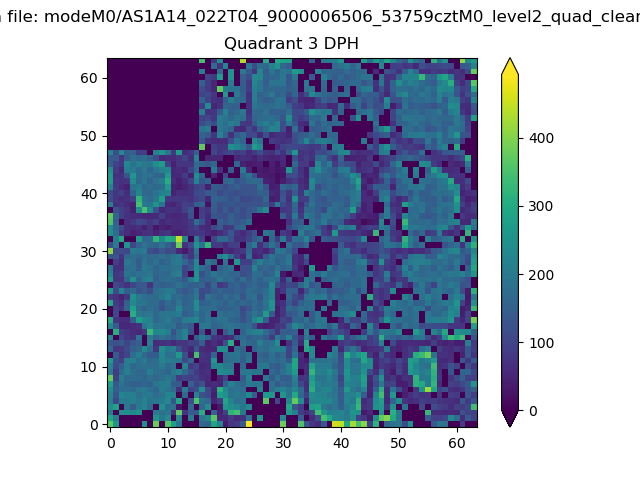 |
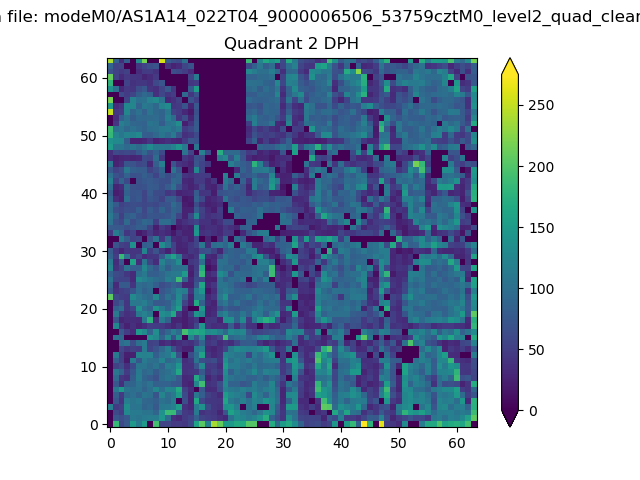 |
Quadrant C |
| Plot type | Count rate plots | Images |
|---|---|---|
| Comparison with Poisson distribution Blue bars denote a histogram of data divided into 1 sec bins. Red curve is a Poisson curve with rate = median count rate of data. |
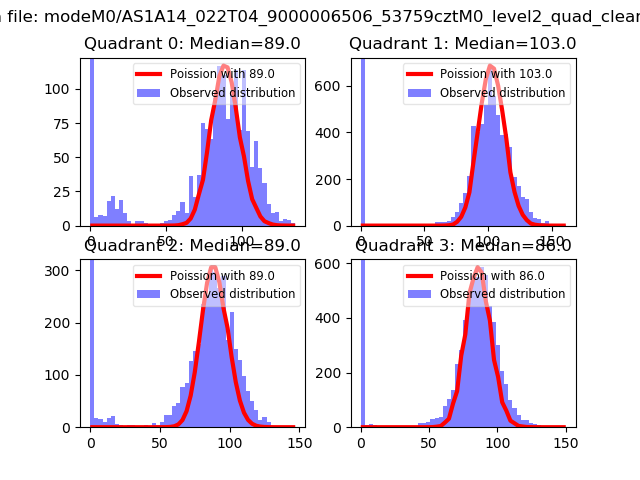 |
 |
| Quadrant-wise count rates Data is divided into 100 sec bins |
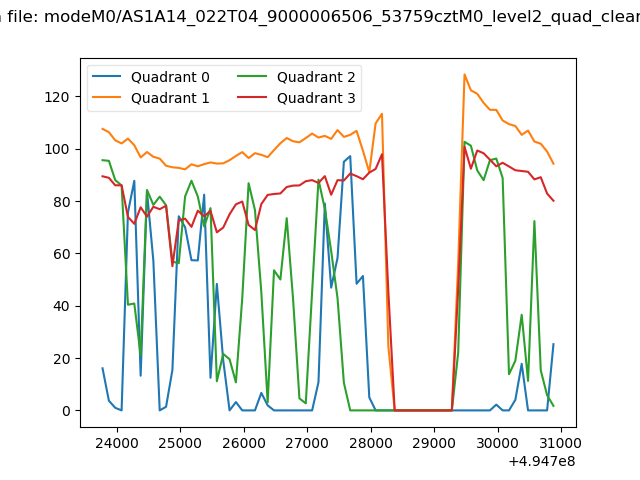 |
|
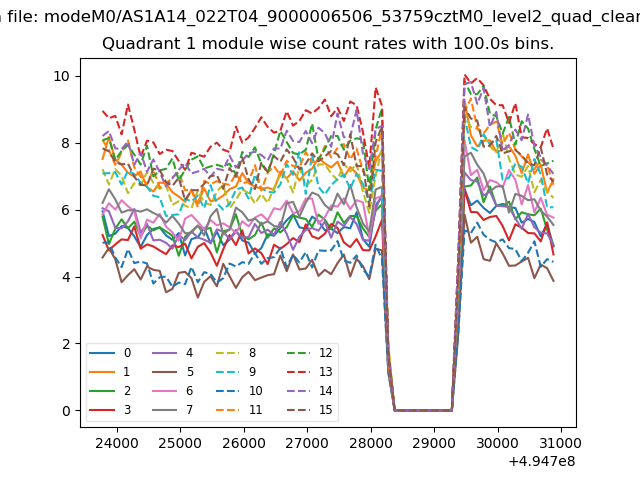
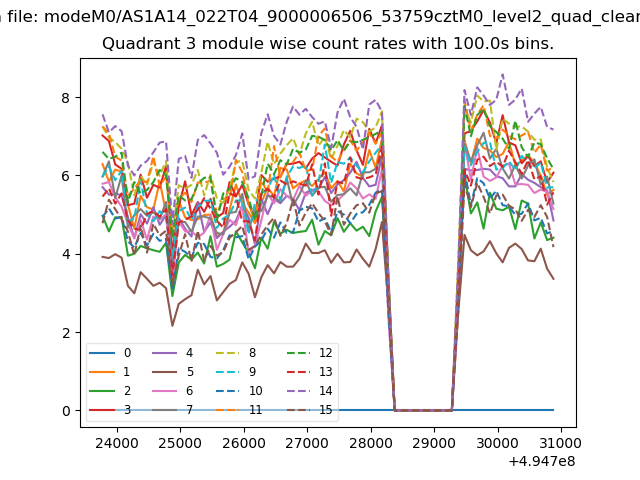
| Module-wise count rates for Quadrant A Data is divided into 100 sec bins |
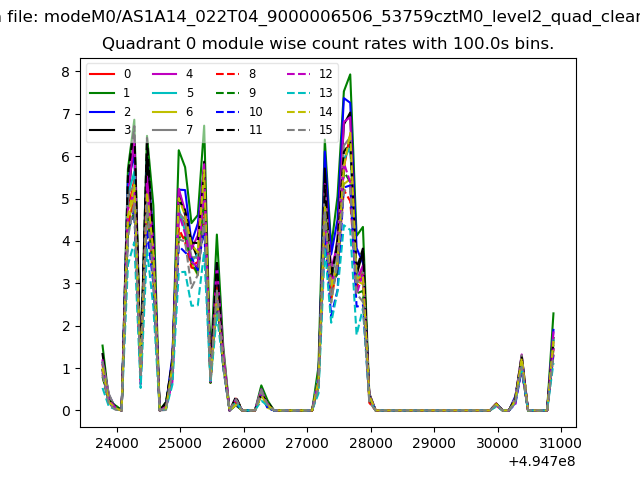 |
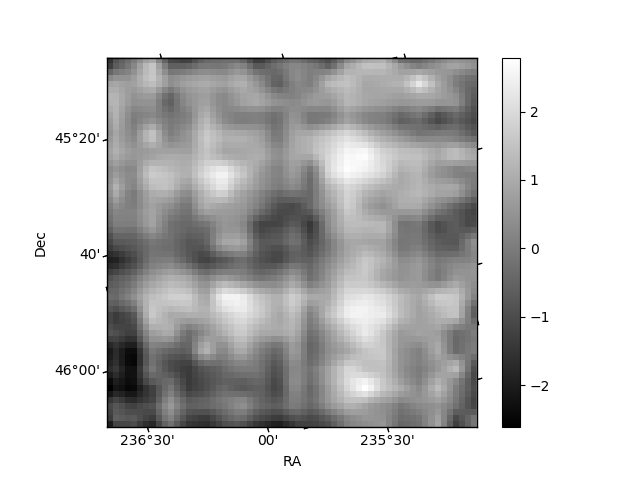 |
| Module-wise count rates for Quadrant B Data is divided into 100 sec bins |
 |
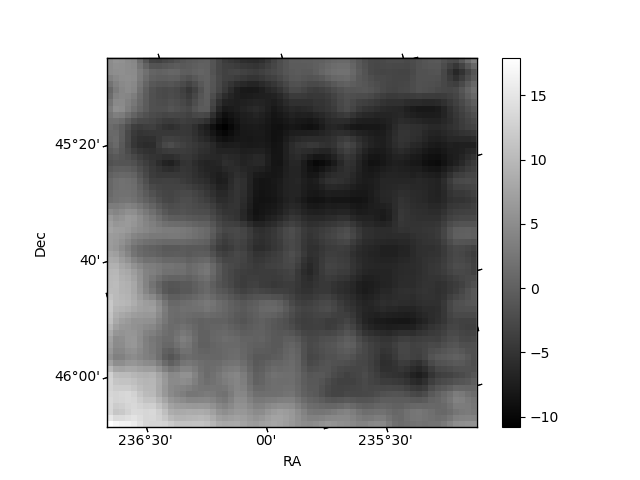 |
| Module-wise count rates for Quadrant C Data is divided into 100 sec bins |
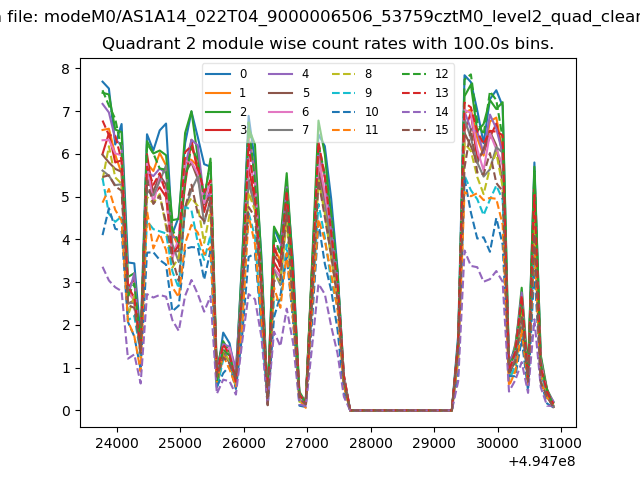 |
 |
| Module-wise count rates for Quadrant D Data is divided into 100 sec bins |
 |
 |
| Parameter | Plot |
|---|---|
| CZT HV Monitor | 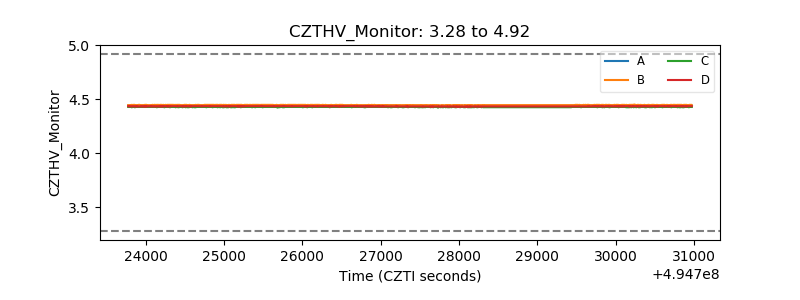 |
| D_VDD | 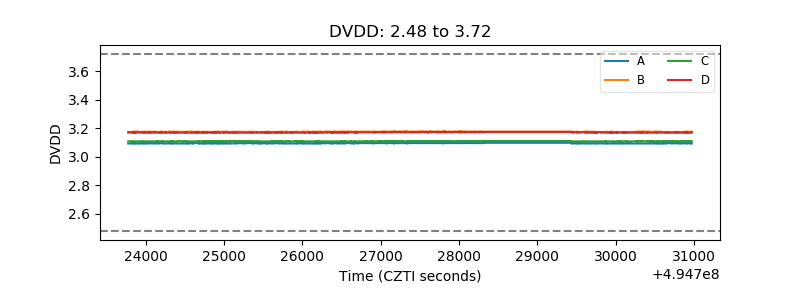 |
| Temperature 1 | 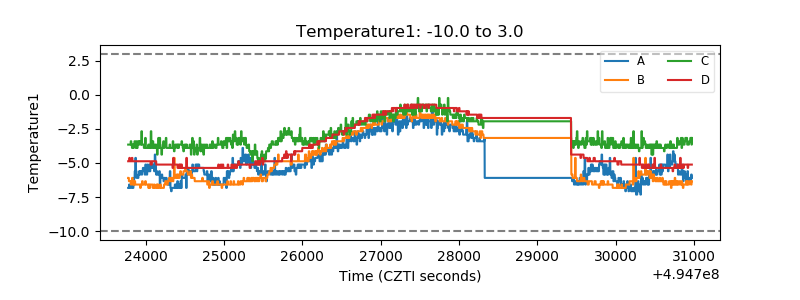 |
| Veto HV Monitor | 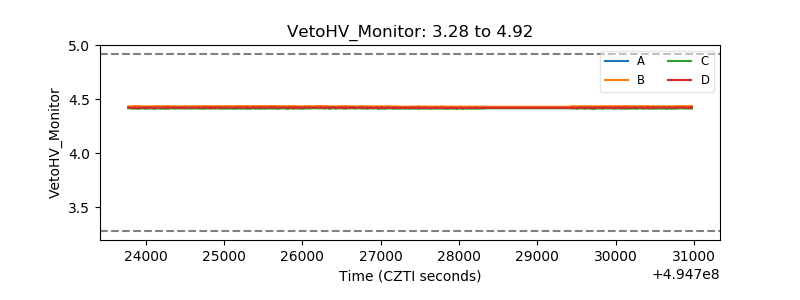 |
| Veto LLD | 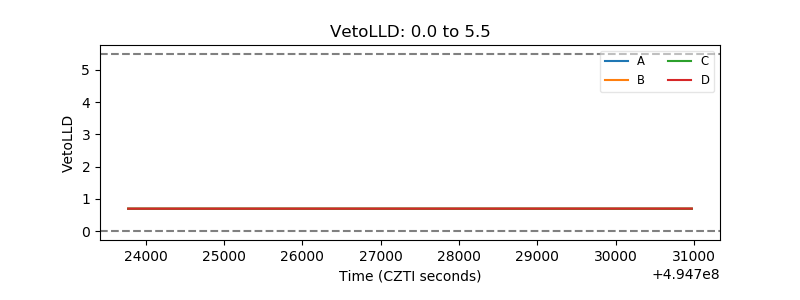 |
| Alpha Counter | 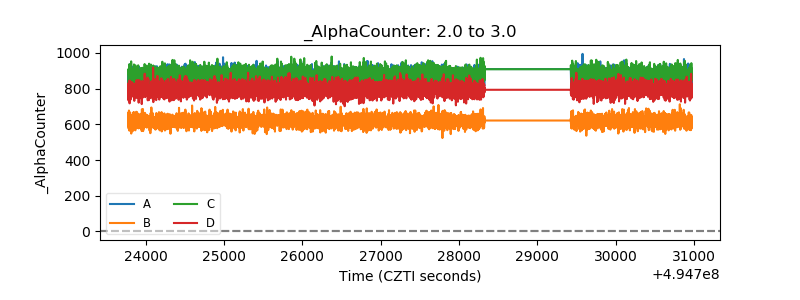 |
| _CPM_Rate | 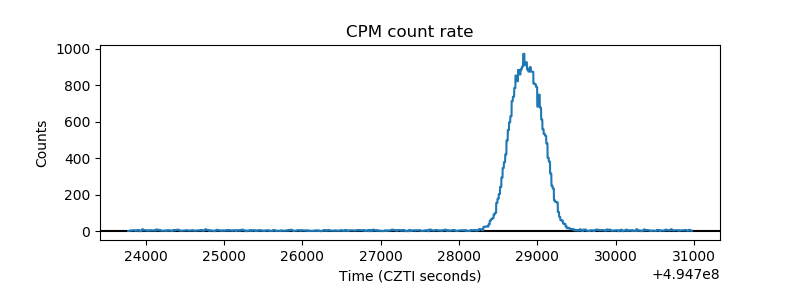 |
| CZT Counter | 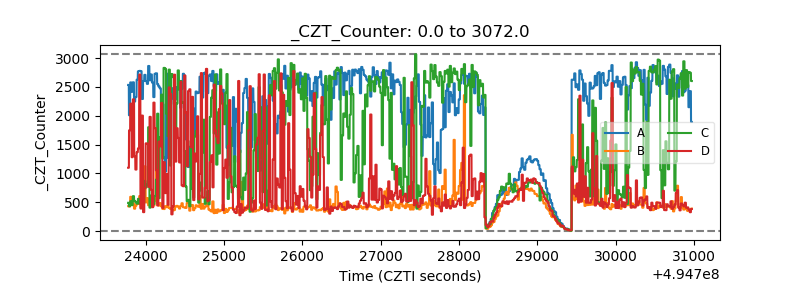 |
| +2.5 Volts monitor |  |
| +5 Volts monitor |  |
| _ROLL_ROT | 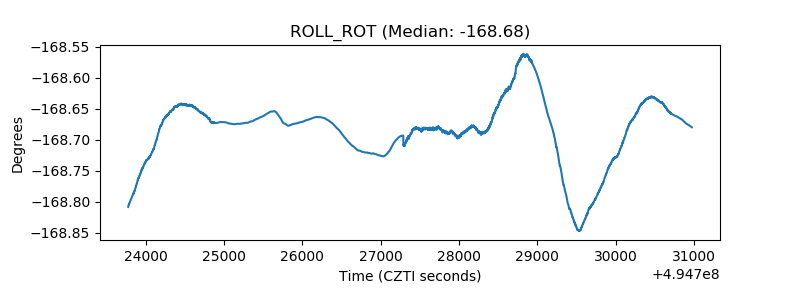 |
| _Roll_DEC | 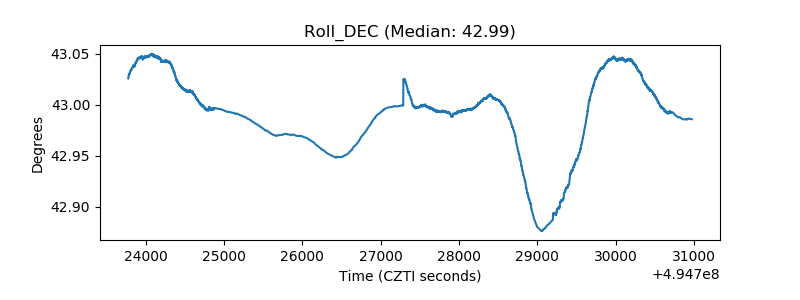 |
| _Roll_RA | 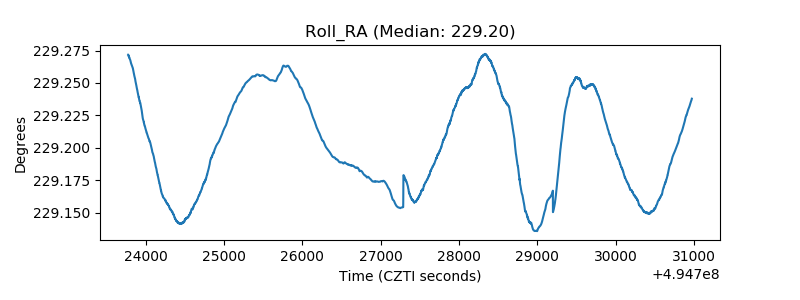 |
| Veto Counter | 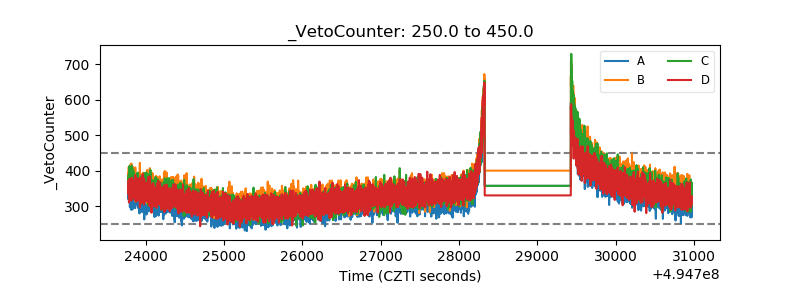 |