| Param | Original file | Final file |
|---|---|---|
| Filename | modeM0/AS1A14_022T04_9000006506_53760cztM0_level2.fits | modeM0/AS1A14_022T04_9000006506_53760cztM0_level2_quad_clean.evt |
| Size (bytes) | 1,023,235,200 | 62,795,520 |
| Size | 975.8 MB | 59.9 MB |
| Events in quadrant A | 16,300,655 | 8,293 |
| Events in quadrant B | 3,138,564 | 665,799 |
| Events in quadrant C | 12,671,482 | 267,485 |
| Events in quadrant D | 5,276,425 | 517,472 |
| Mode M0 | |||
|---|---|---|---|
| Quadrant | BADHDUFLAG | Total packets | Discarded packets |
| A | 0 | 52827 | 1 |
| B | 0 | 13866 | 1 |
| C | 0 | 41824 | 1 |
| D | 0 | 20166 | 1 |
| Mode SS | |||
|---|---|---|---|
| Quadrant | BADHDUFLAG | Total packets | Discarded packets |
| A | 0 | 130 | 0 |
| B | 0 | 130 | 0 |
| C | 0 | 130 | 0 |
| D | 0 | 130 | 0 |
| Mode M9 | |||
|---|---|---|---|
| Quadrant | BADHDUFLAG | Total packets | Discarded packets |
| A | 0 | 11 | 0 |
| B | 0 | 11 | 0 |
| C | 0 | 11 | 0 |
| D | 0 | 11 | 0 |
| Quadrant | Total seconds | Saturated seconds | Saturation percentage |
|---|---|---|---|
| A | 6333 | 6275 | 99.084162% |
| B | 6333 | 149 | 2.352755% |
| C | 6333 | 3856 | 60.887415% |
| D | 6333 | 691 | 10.911101% |
Noise dominated data is calculated using 1-second bins in cleaned event files. If a bin has >2000 counts, and if more than 50% of those come from <1% of pixels, then it is considered to be noise-dominated and hence unusable.
| Quadrant | # 1 sec bins | Bins with >0 counts | Bins with >2000 counts | High rate bins dominated by noise | Noise dominated (total time) | Noise dominated (detector-on time) | Marked lightcurve |
|---|---|---|---|---|---|---|---|
| A | 7458 | 6332 | 6073 | 6073 | 81.43% | 95.91% | 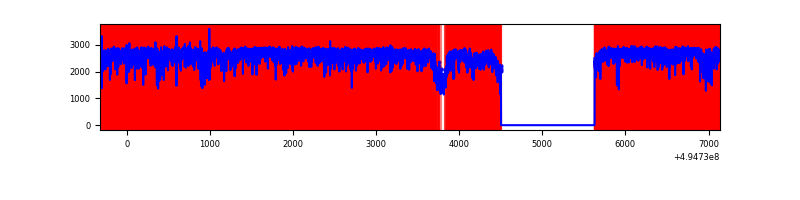 |
| B | 7459 | 6333 | 36 | 36 | 0.48% | 0.57% | 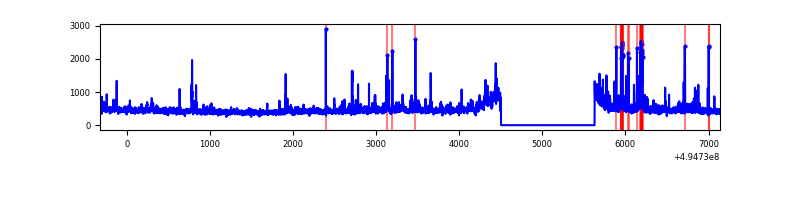 |
| C | 7459 | 6333 | 3728 | 3728 | 49.98% | 58.87% | 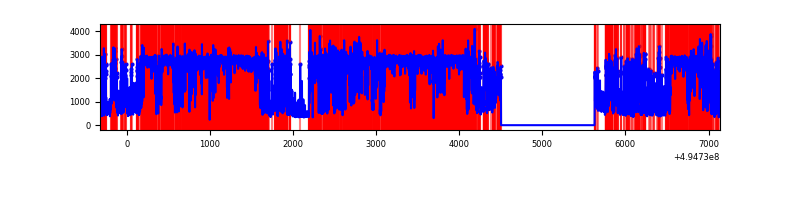 |
| D | 7459 | 6333 | 656 | 656 | 8.79% | 10.36% | 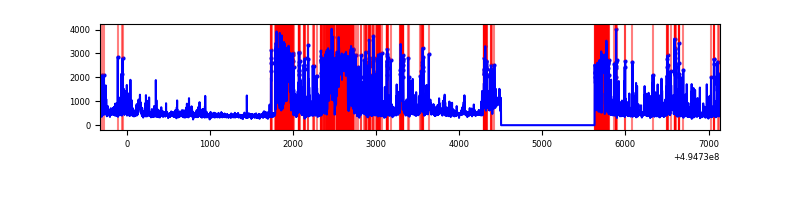 |
Top three noisy pixels from each quadrant. If the there are fewer than three noisy pixels in the level2.evt file, extra rows are filled as -1
| Pixel properties | Quadrant properties | ||||||
|---|---|---|---|---|---|---|---|
| Quadrant | DetID | PixID | Counts | Sigma | Mean | Median | Sigma |
| A | 3 | 63 | 15183463 | 252082.65 | 236 | 230 | 60.2 |
| A | 12 | 3 | 73739 | 1220.45 | 236 | 230 | 60.2 |
| A | 3 | 78 | 30702 | 505.92 | 236 | 230 | 60.2 |
| B | 0 | 213 | 183507 | 1251.77 | 683 | 657 | 146.1 |
| B | 7 | 0 | 46729 | 315.4 | 683 | 657 | 146.1 |
| B | 4 | 81 | 43816 | 295.46 | 683 | 657 | 146.1 |
| C | 1 | 241 | 7906816 | 65218.63 | 436 | 433 | 121.2 |
| C | 15 | 224 | 2665446 | 21983.31 | 436 | 433 | 121.2 |
| C | 13 | 3 | 212798 | 1751.77 | 436 | 433 | 121.2 |
| D | 8 | 176 | 1533497 | 8477.92 | 634 | 607 | 180.8 |
| D | 3 | 12 | 578432 | 3195.76 | 634 | 607 | 180.8 |
| D | 2 | 172 | 363972 | 2009.65 | 634 | 607 | 180.8 |
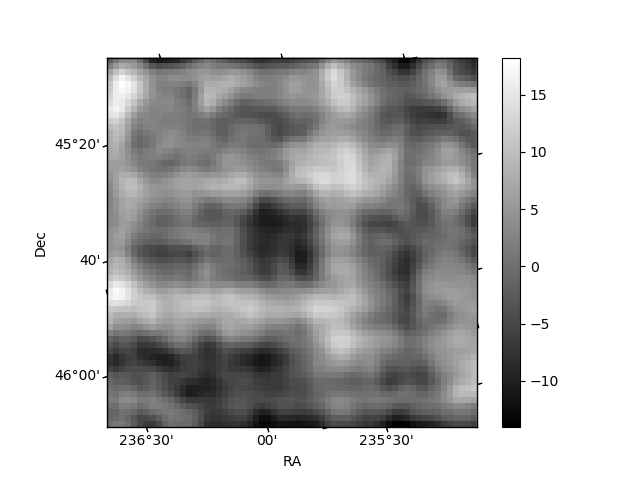
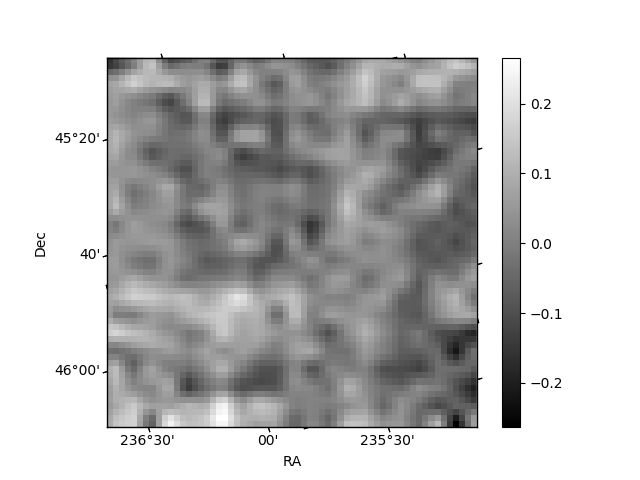
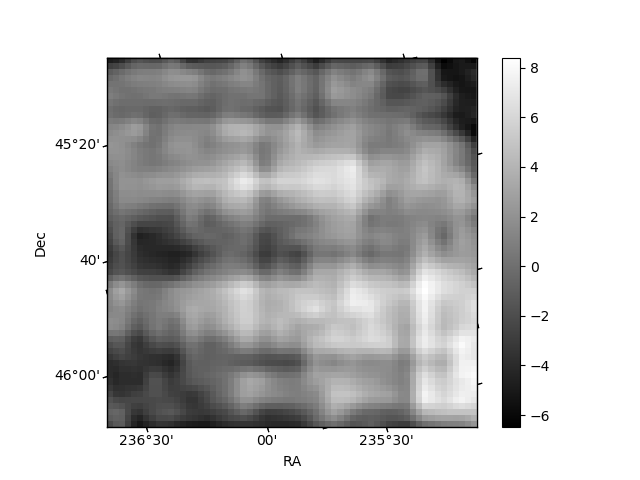
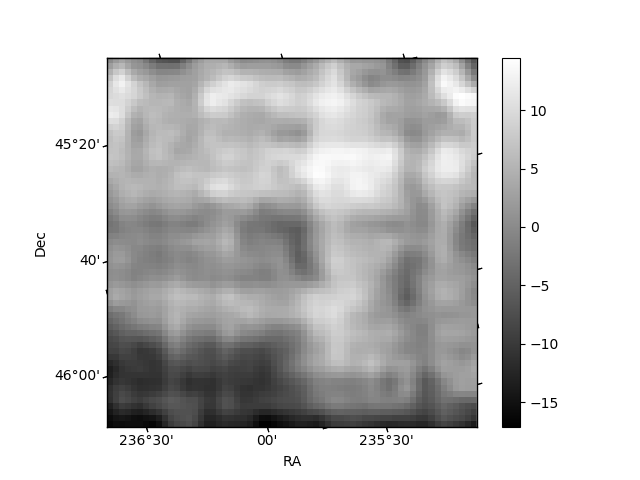
Histogram calculated using DETX and DETY for each event in the final _common_clean file
| Quadrant A | 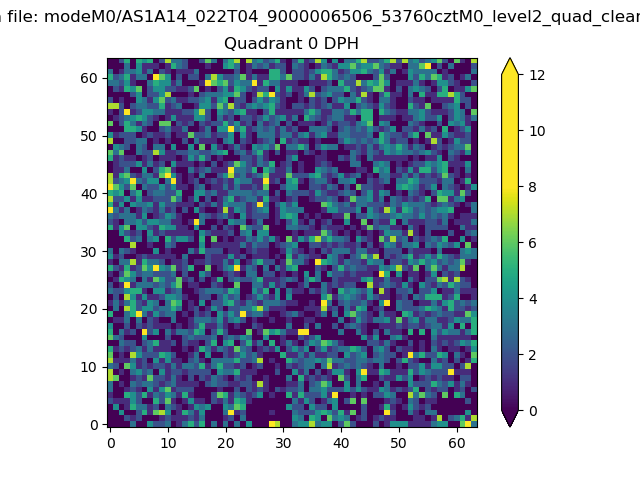 |
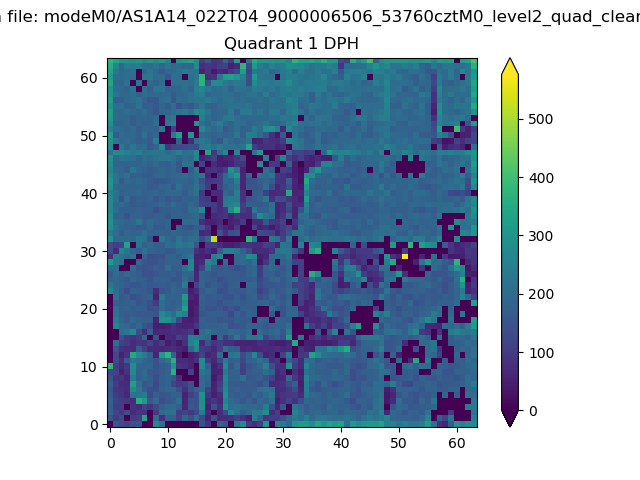 |
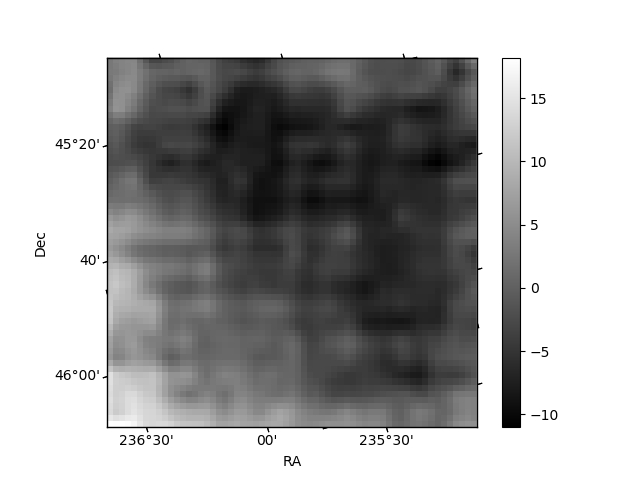
Quadrant B |
|---|---|---|---|
| Quadrant D | 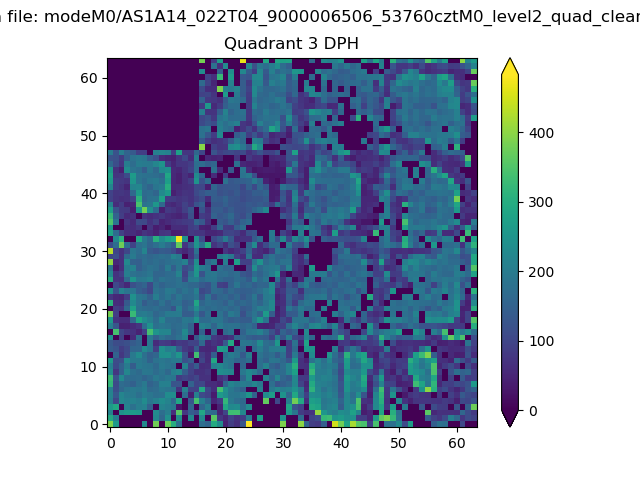 |
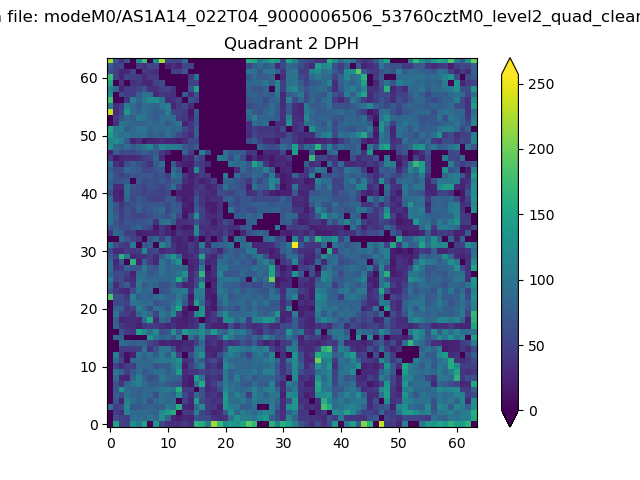 |
Quadrant C |
| Plot type | Count rate plots | Images |
|---|---|---|
| Comparison with Poisson distribution Blue bars denote a histogram of data divided into 1 sec bins. Red curve is a Poisson curve with rate = median count rate of data. |
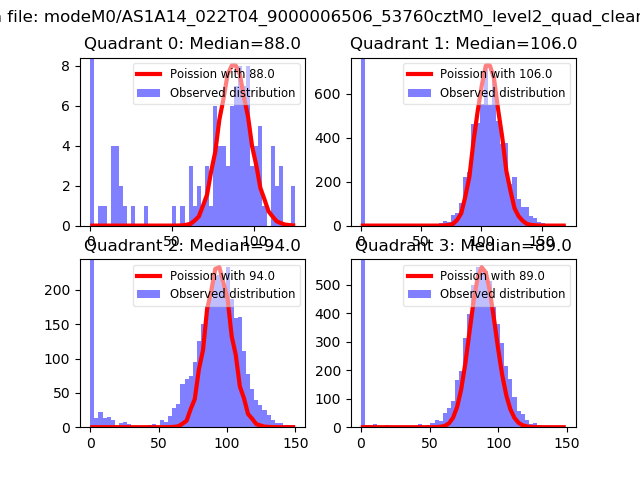 |
 |
| Quadrant-wise count rates Data is divided into 100 sec bins |
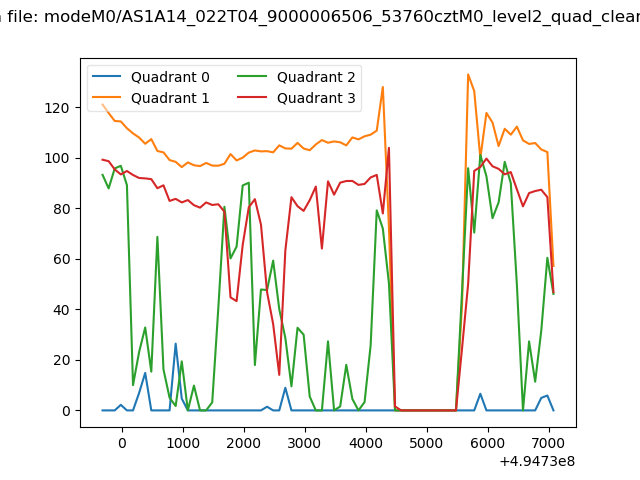 |
|
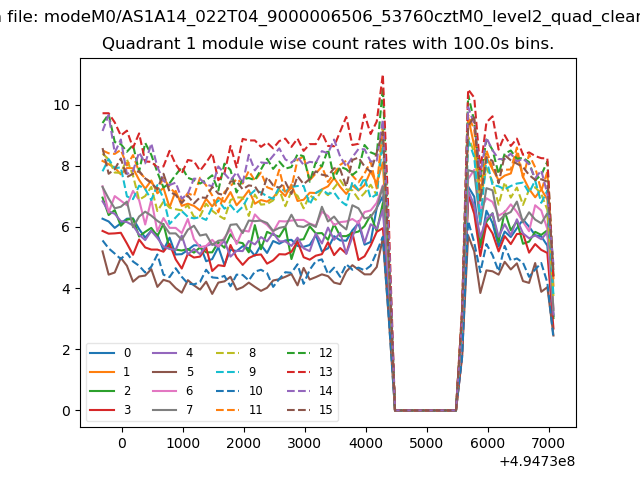
| Module-wise count rates for Quadrant A Data is divided into 100 sec bins |
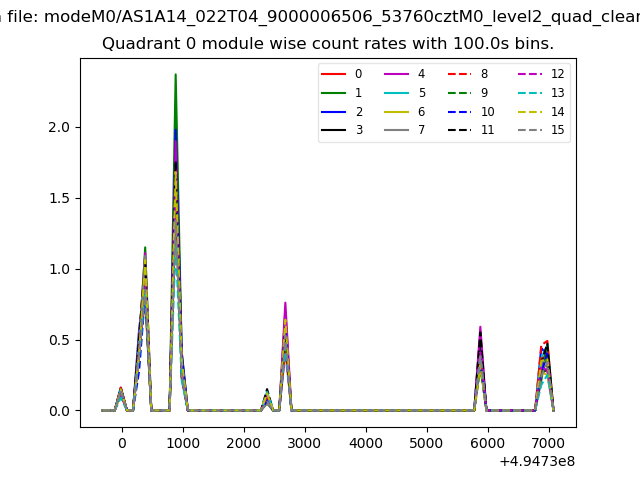 |
 |
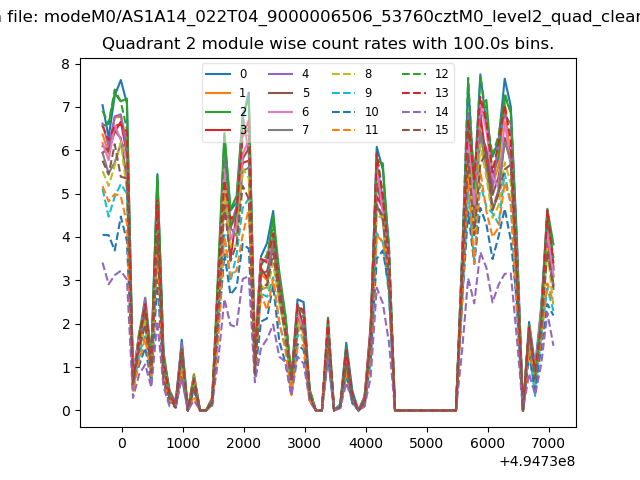
| Module-wise count rates for Quadrant B Data is divided into 100 sec bins |
 |
 |
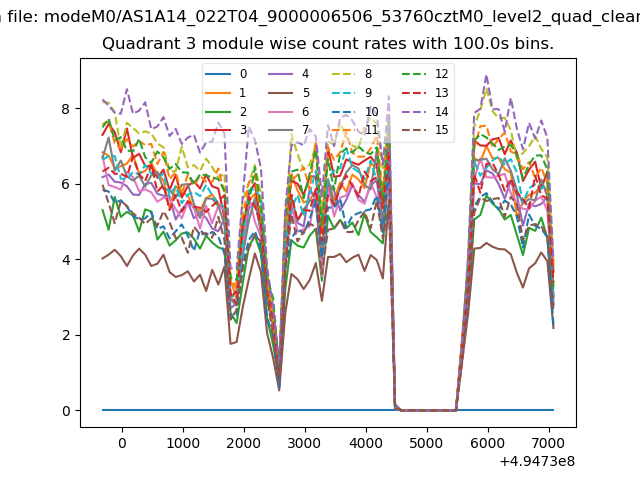
| Module-wise count rates for Quadrant C Data is divided into 100 sec bins |
 |
 |
| Module-wise count rates for Quadrant D Data is divided into 100 sec bins |
 |
 |
| Parameter | Plot |
|---|---|
| CZT HV Monitor | 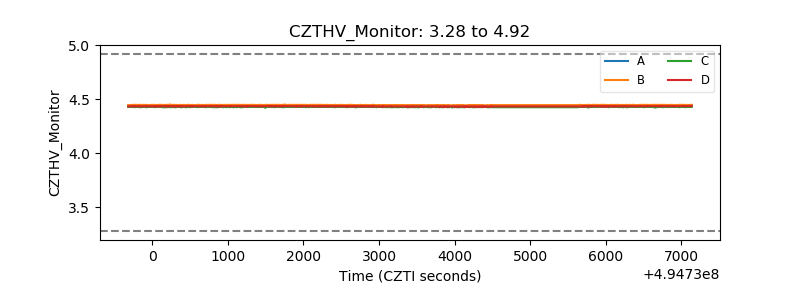 |
| D_VDD | 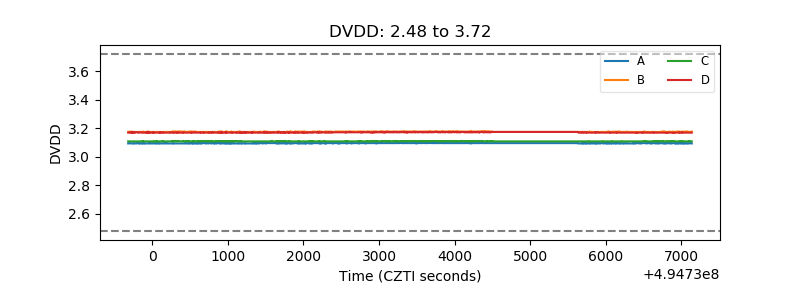 |
| Temperature 1 | 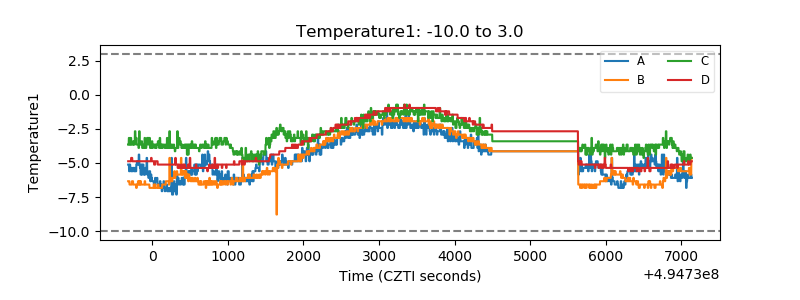 |
| Veto HV Monitor | 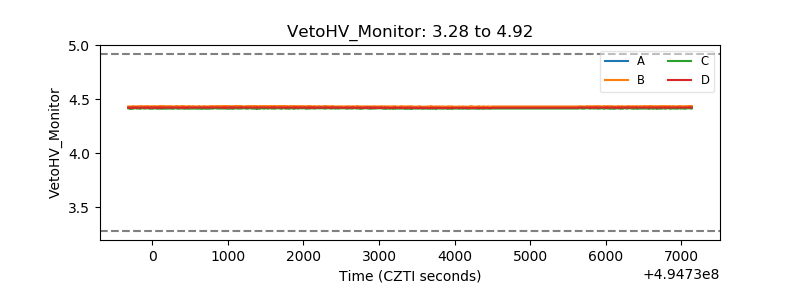 |
| Veto LLD | 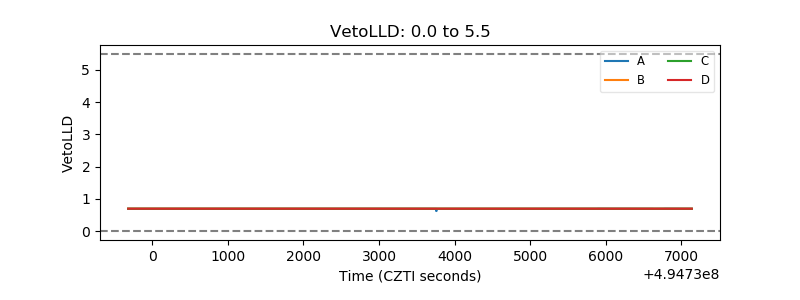 |
| Alpha Counter | 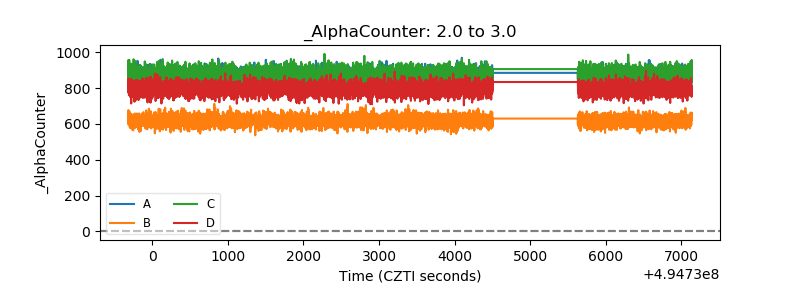 |
| _CPM_Rate | 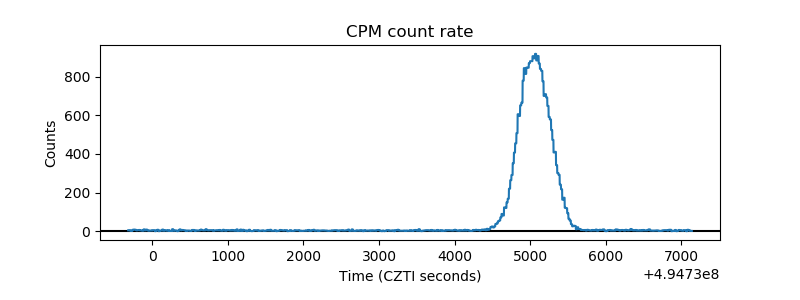 |
| CZT Counter | 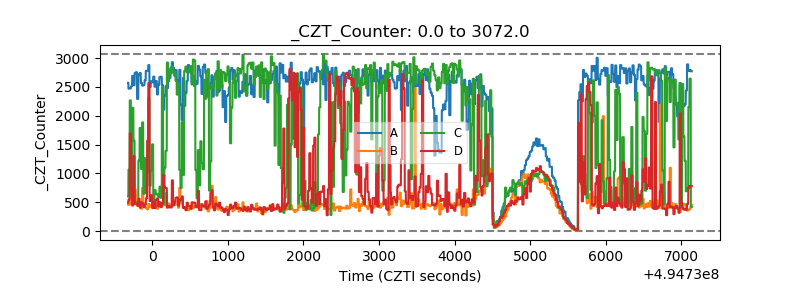 |
| +2.5 Volts monitor | 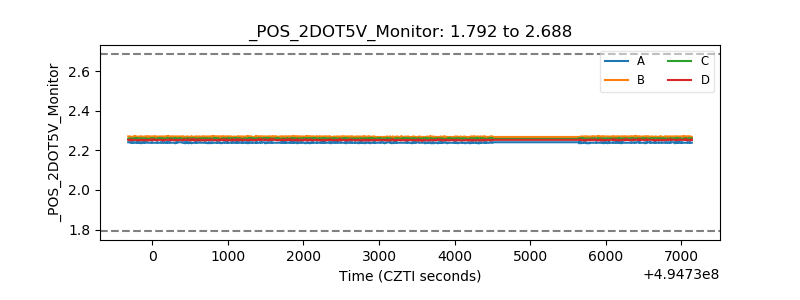 |
| +5 Volts monitor | 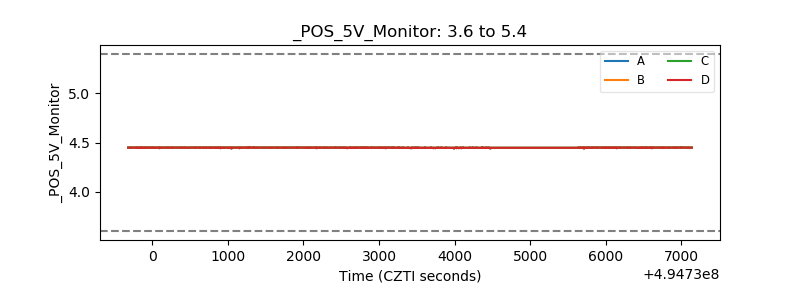 |
| _ROLL_ROT | 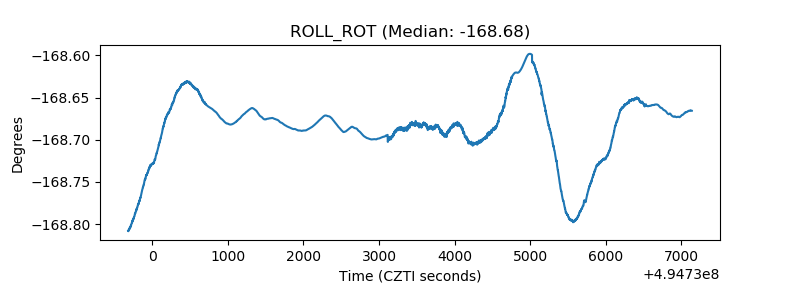 |
| _Roll_DEC | 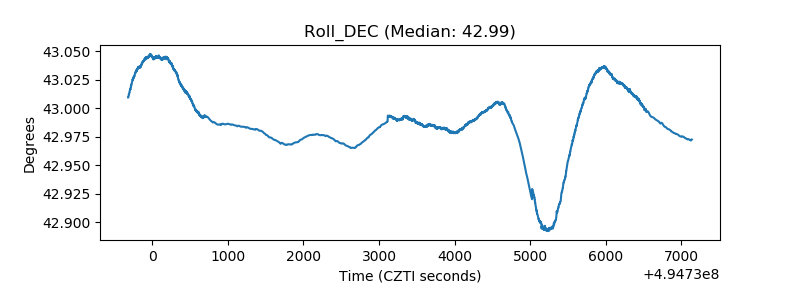 |
| _Roll_RA | 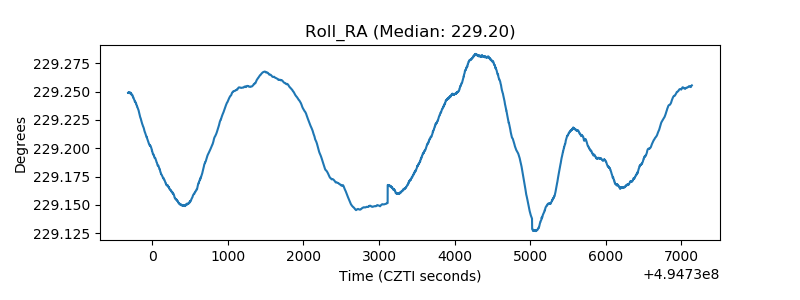 |
| Veto Counter | 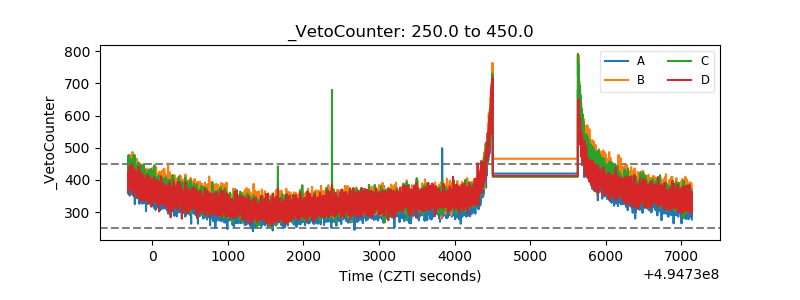 |