| Param | Original file | Final file |
|---|---|---|
| Filename | modeM0/AS1A14_022T04_9000006506_53761cztM0_level2.fits | modeM0/AS1A14_022T04_9000006506_53761cztM0_level2_quad_clean.evt |
| Size (bytes) | 891,129,600 | 72,089,280 |
| Size | 849.8 MB | 68.7 MB |
| Events in quadrant A | 15,994,639 | 6,181 |
| Events in quadrant B | 3,345,181 | 690,267 |
| Events in quadrant C | 8,596,221 | 458,119 |
| Events in quadrant D | 4,543,048 | 571,724 |
| Mode M0 | |||
|---|---|---|---|
| Quadrant | BADHDUFLAG | Total packets | Discarded packets |
| A | 0 | 52053 | 4 |
| B | 0 | 14553 | 2 |
| C | 0 | 30014 | 2 |
| D | 0 | 18131 | 2 |
| Mode SS | |||
|---|---|---|---|
| Quadrant | BADHDUFLAG | Total packets | Discarded packets |
| A | 0 | 134 | 0 |
| B | 0 | 134 | 0 |
| C | 0 | 134 | 0 |
| D | 0 | 134 | 0 |
| Mode M9 | |||
|---|---|---|---|
| Quadrant | BADHDUFLAG | Total packets | Discarded packets |
| A | 0 | 15 | 0 |
| B | 0 | 16 | 0 |
| C | 0 | 16 | 0 |
| D | 0 | 16 | 0 |
| Quadrant | Total seconds | Saturated seconds | Saturation percentage |
|---|---|---|---|
| A | 6540 | 6495 | 99.311927% |
| B | 6540 | 201 | 3.073394% |
| C | 6540 | 1944 | 29.724771% |
| D | 6540 | 251 | 3.837920% |
Noise dominated data is calculated using 1-second bins in cleaned event files. If a bin has >2000 counts, and if more than 50% of those come from <1% of pixels, then it is considered to be noise-dominated and hence unusable.
| Quadrant | # 1 sec bins | Bins with >0 counts | Bins with >2000 counts | High rate bins dominated by noise | Noise dominated (total time) | Noise dominated (detector-on time) | Marked lightcurve |
|---|---|---|---|---|---|---|---|
| A | 7679 | 6539 | 5730 | 5730 | 74.62% | 87.63% | 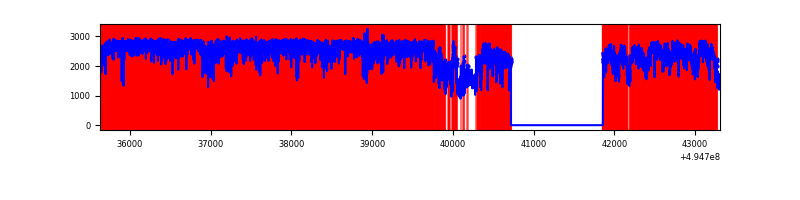 |
| B | 7680 | 6540 | 48 | 48 | 0.62% | 0.73% | 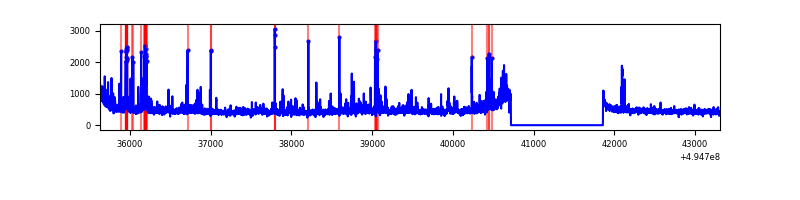 |
| C | 7679 | 6539 | 1795 | 1795 | 23.38% | 27.45% | 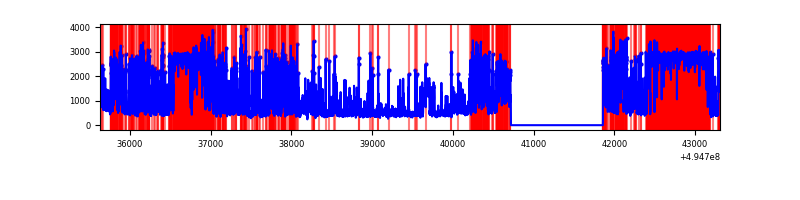 |
| D | 7680 | 6540 | 208 | 208 | 2.71% | 3.18% | 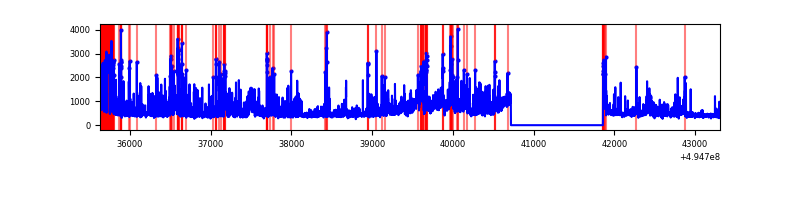 |
Top three noisy pixels from each quadrant. If the there are fewer than three noisy pixels in the level2.evt file, extra rows are filled as -1
| Pixel properties | Quadrant properties | ||||||
|---|---|---|---|---|---|---|---|
| Quadrant | DetID | PixID | Counts | Sigma | Mean | Median | Sigma |
| A | 3 | 63 | 15098446 | 292273.32 | 199 | 193 | 51.7 |
| A | 0 | 8 | 32596 | 627.26 | 199 | 193 | 51.7 |
| A | 3 | 78 | 29021 | 558.05 | 199 | 193 | 51.7 |
| B | 0 | 213 | 189494 | 1217.82 | 716 | 689 | 155.0 |
| B | 4 | 81 | 119128 | 763.95 | 716 | 689 | 155.0 |
| B | 5 | 250 | 63548 | 405.45 | 716 | 689 | 155.0 |
| C | 1 | 241 | 3113848 | 19410.24 | 583 | 576 | 160.4 |
| C | 15 | 224 | 2533337 | 15790.94 | 583 | 576 | 160.4 |
| C | 12 | 252 | 331594 | 2063.79 | 583 | 576 | 160.4 |
| D | 2 | 172 | 530795 | 2718.73 | 687 | 658 | 195.0 |
| D | 3 | 12 | 446557 | 2286.73 | 687 | 658 | 195.0 |
| D | 10 | 172 | 369951 | 1893.86 | 687 | 658 | 195.0 |
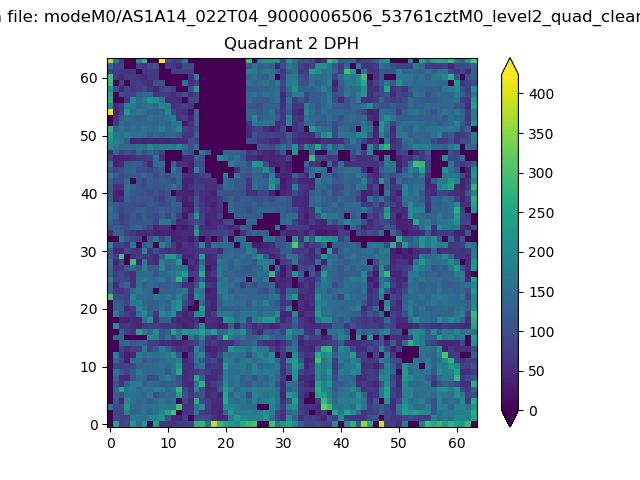
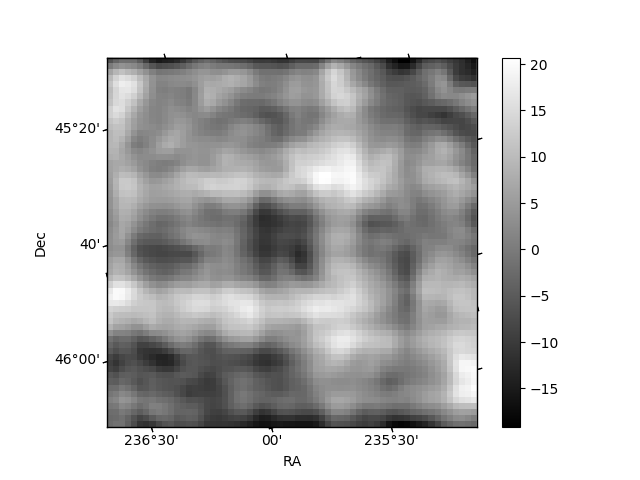
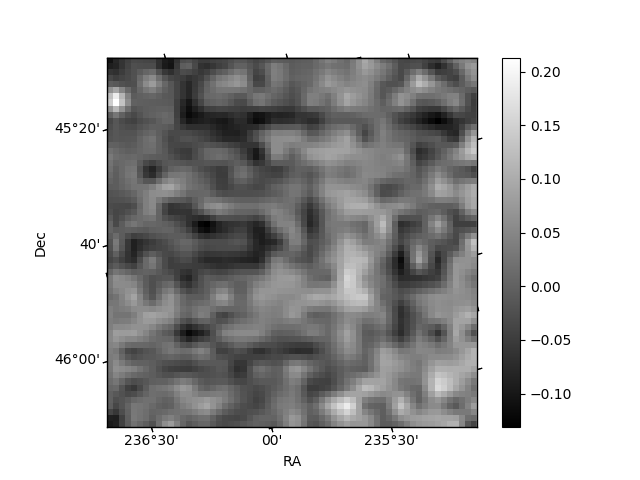
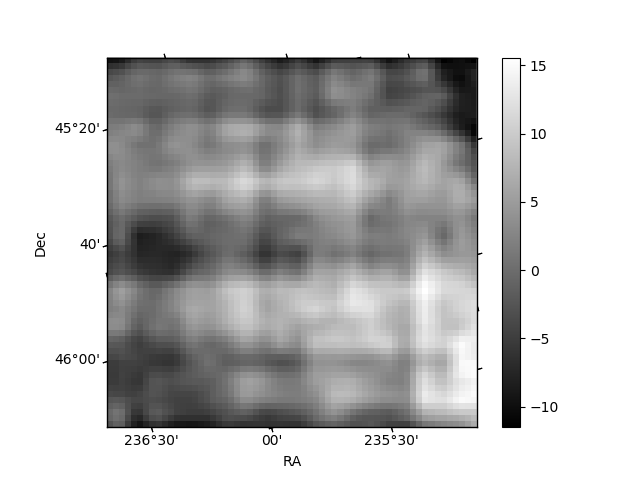
Histogram calculated using DETX and DETY for each event in the final _common_clean file
| Quadrant A | 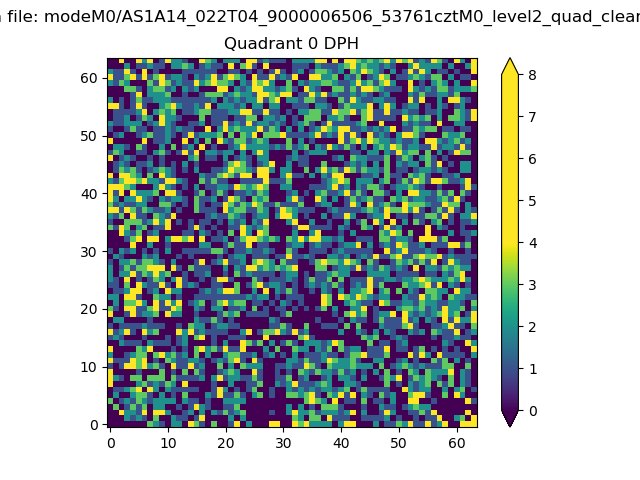 |
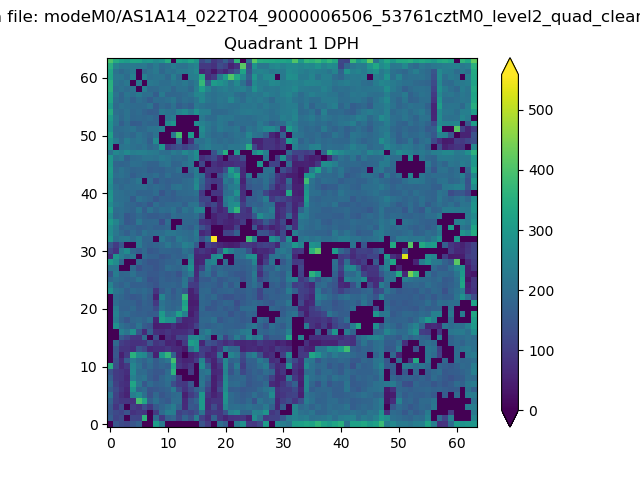 |
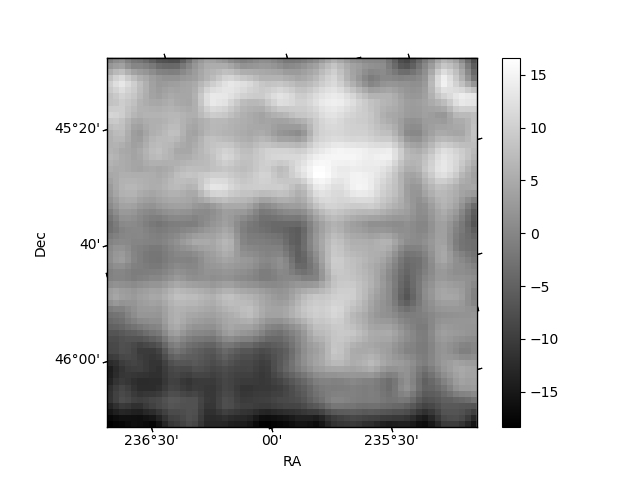
Quadrant B |
|---|---|---|---|
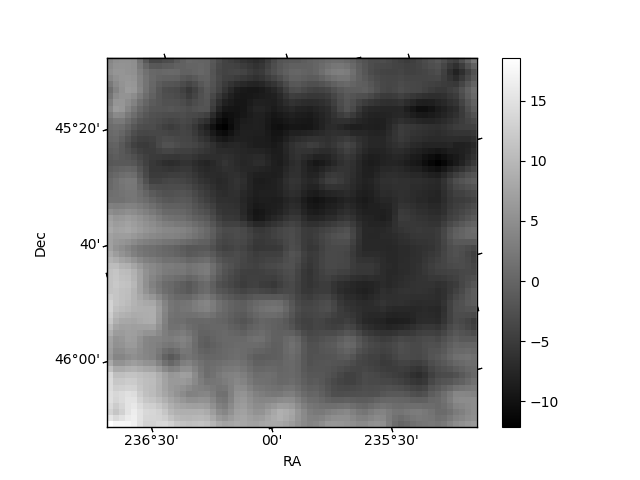
| Quadrant D | 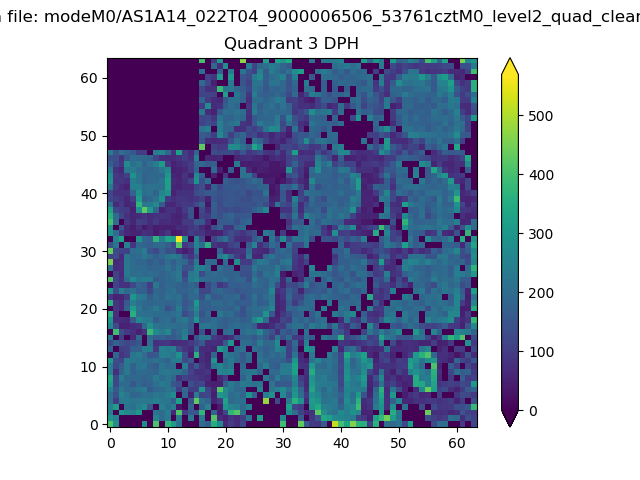 |
 |
Quadrant C |
| Plot type | Count rate plots | Images |
|---|---|---|
| Comparison with Poisson distribution Blue bars denote a histogram of data divided into 1 sec bins. Red curve is a Poisson curve with rate = median count rate of data. |
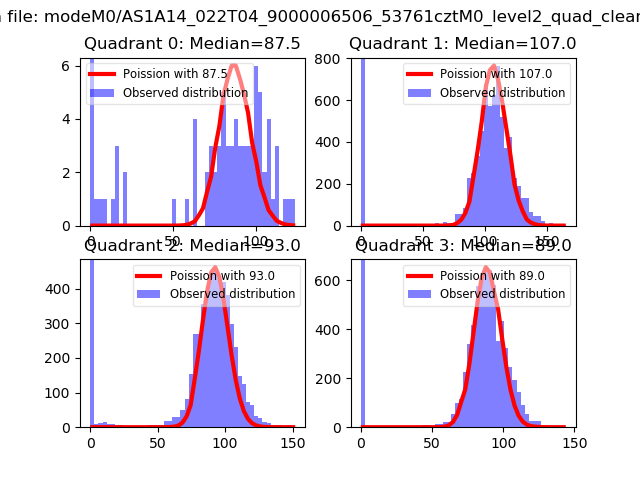 |
 |
| Quadrant-wise count rates Data is divided into 100 sec bins |
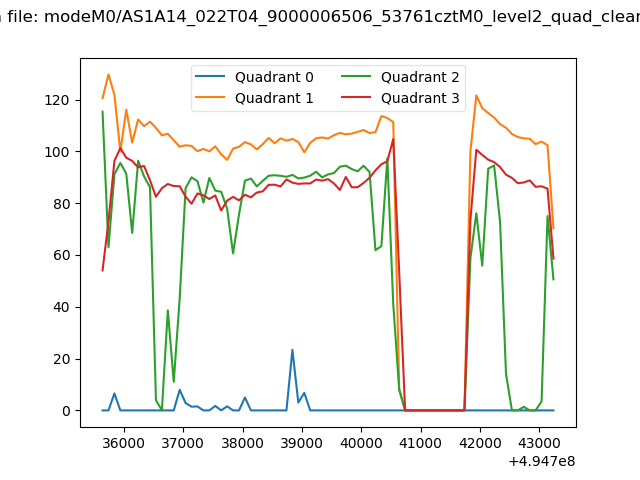 |
|
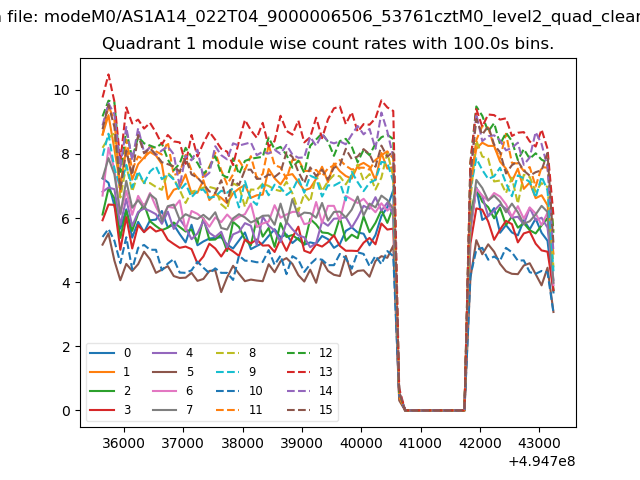
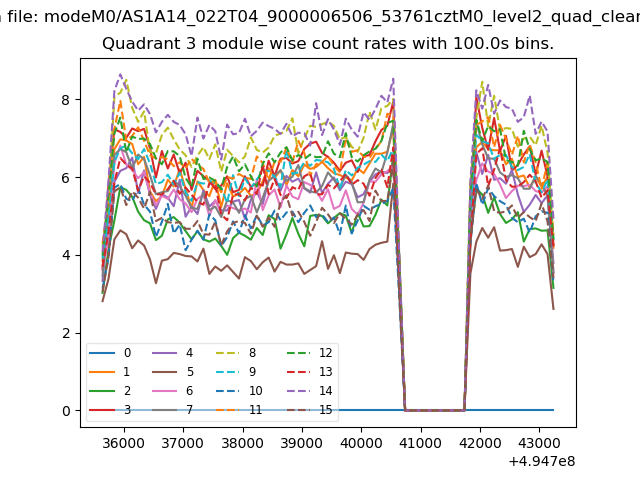
| Module-wise count rates for Quadrant A Data is divided into 100 sec bins |
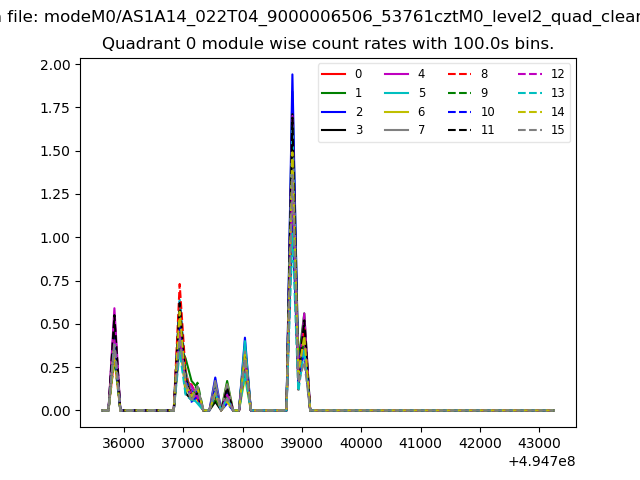 |
 |
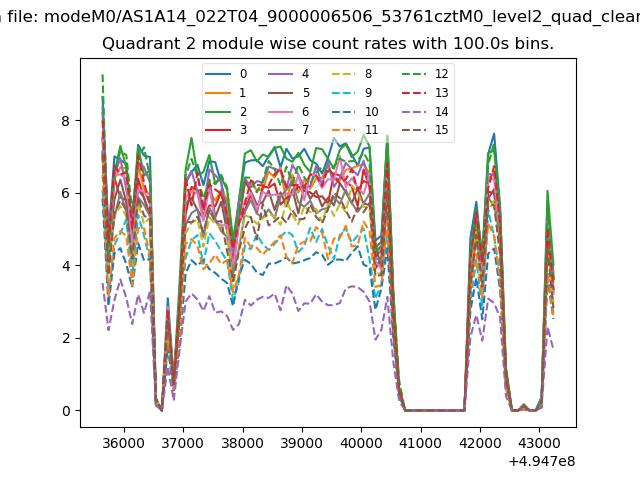
| Module-wise count rates for Quadrant B Data is divided into 100 sec bins |
 |
 |
| Module-wise count rates for Quadrant C Data is divided into 100 sec bins |
 |
 |
| Module-wise count rates for Quadrant D Data is divided into 100 sec bins |
 |
 |
| Parameter | Plot |
|---|---|
| CZT HV Monitor | 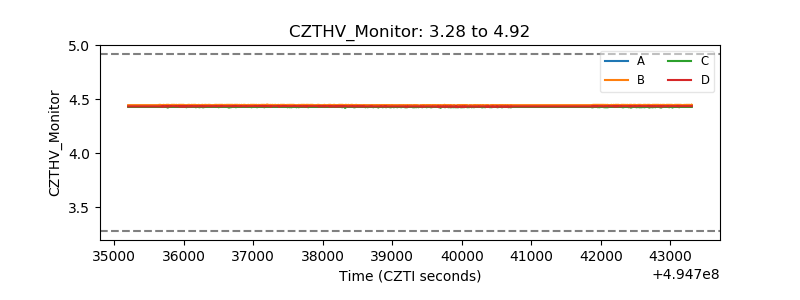 |
| D_VDD | 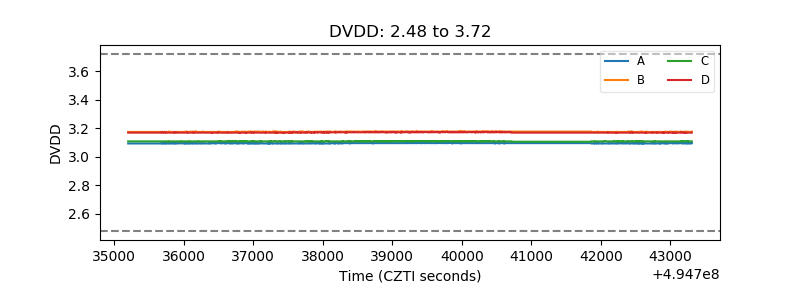 |
| Temperature 1 | 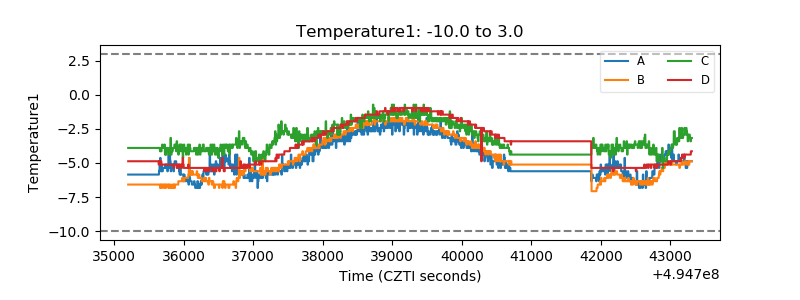 |
| Veto HV Monitor | 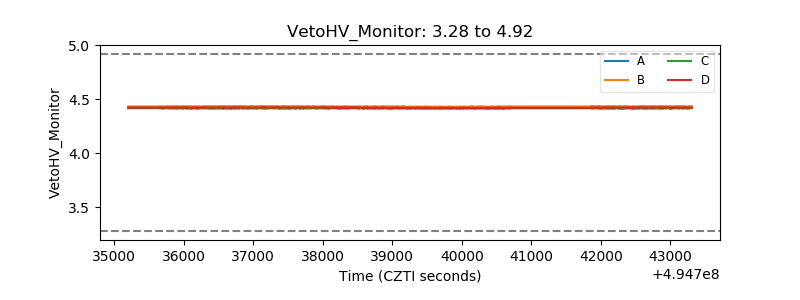 |
| Veto LLD | 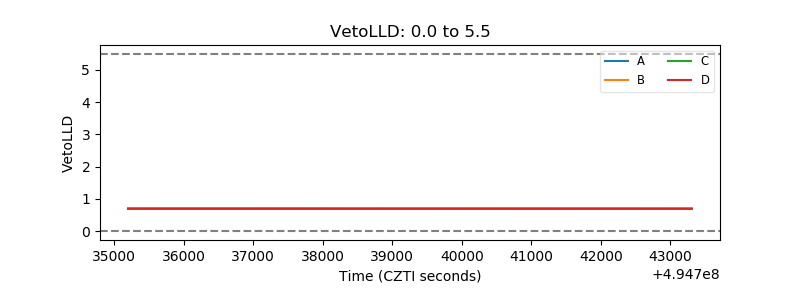 |
| Alpha Counter | 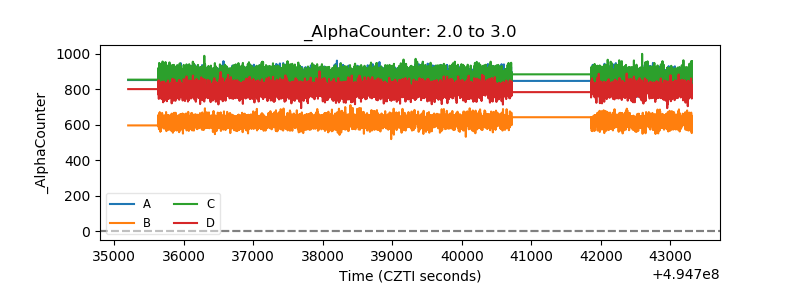 |
| _CPM_Rate | 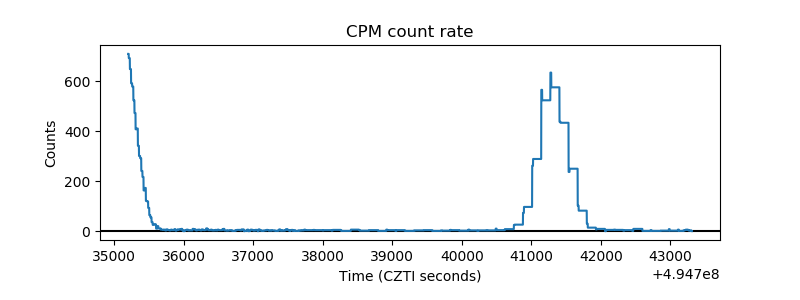 |
| CZT Counter | 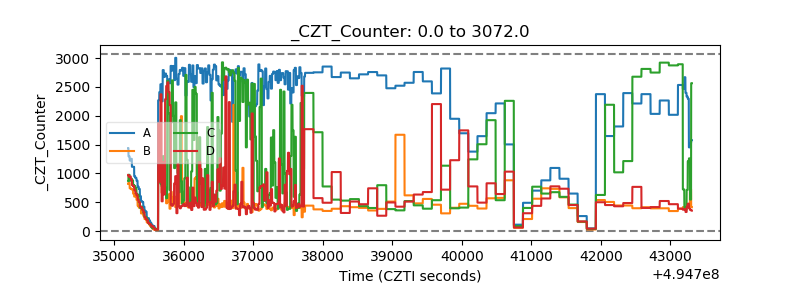 |
| +2.5 Volts monitor |  |
| +5 Volts monitor |  |
| _ROLL_ROT | 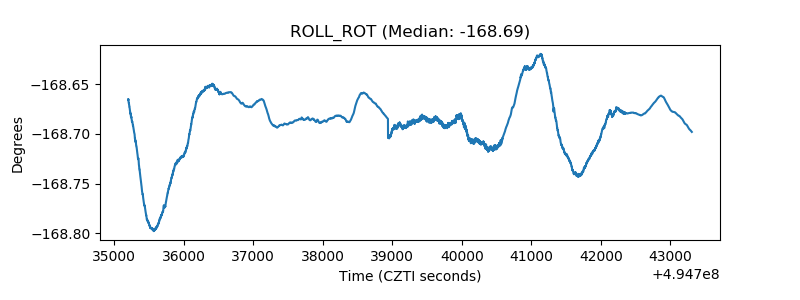 |
| _Roll_DEC | 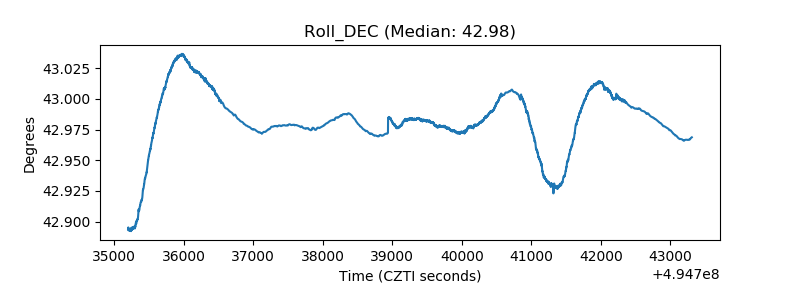 |
| _Roll_RA | 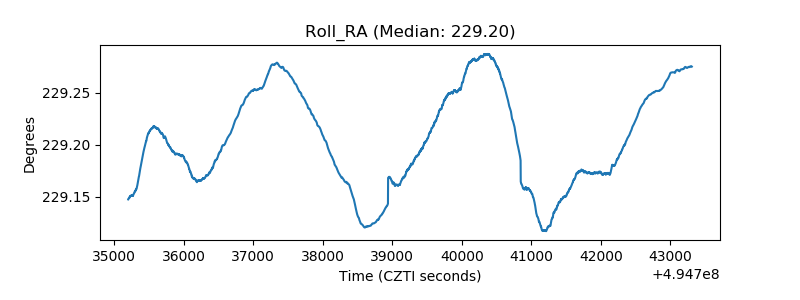 |
| Veto Counter | 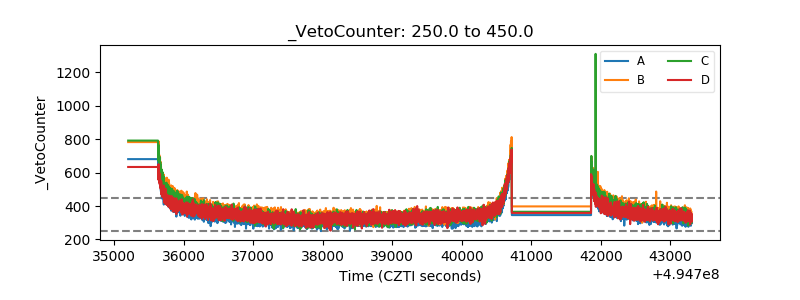 |