| Param | Original file | Final file |
|---|---|---|
| Filename | modeM0/AS1A14_022T04_9000006506_53762cztM0_level2.fits | modeM0/AS1A14_022T04_9000006506_53762cztM0_level2_quad_clean.evt |
| Size (bytes) | 972,921,600 | 70,600,320 |
| Size | 927.9 MB | 67.3 MB |
| Events in quadrant A | 15,225,909 | 121,258 |
| Events in quadrant B | 3,562,624 | 682,032 |
| Events in quadrant C | 11,930,226 | 341,156 |
| Events in quadrant D | 4,781,300 | 529,268 |
| Mode M0 | |||
|---|---|---|---|
| Quadrant | BADHDUFLAG | Total packets | Discarded packets |
| A | 0 | 49812 | 2 |
| B | 0 | 15342 | 2 |
| C | 0 | 39906 | 2 |
| D | 0 | 18943 | 5 |
| Mode SS | |||
|---|---|---|---|
| Quadrant | BADHDUFLAG | Total packets | Discarded packets |
| A | 0 | 134 | 0 |
| B | 0 | 134 | 0 |
| C | 0 | 134 | 0 |
| D | 0 | 134 | 0 |
| Mode M9 | |||
|---|---|---|---|
| Quadrant | BADHDUFLAG | Total packets | Discarded packets |
| A | 0 | 13 | 0 |
| B | 0 | 14 | 0 |
| C | 0 | 14 | 0 |
| D | 0 | 14 | 0 |
| Quadrant | Total seconds | Saturated seconds | Saturation percentage |
|---|---|---|---|
| A | 6649 | 5571 | 83.787036% |
| B | 6649 | 246 | 3.699804% |
| C | 6649 | 3336 | 50.172958% |
| D | 6648 | 710 | 10.679904% |
Noise dominated data is calculated using 1-second bins in cleaned event files. If a bin has >2000 counts, and if more than 50% of those come from <1% of pixels, then it is considered to be noise-dominated and hence unusable.
| Quadrant | # 1 sec bins | Bins with >0 counts | Bins with >2000 counts | High rate bins dominated by noise | Noise dominated (total time) | Noise dominated (detector-on time) | Marked lightcurve |
|---|---|---|---|---|---|---|---|
| A | 7683 | 6648 | 5119 | 5119 | 66.63% | 77.00% | 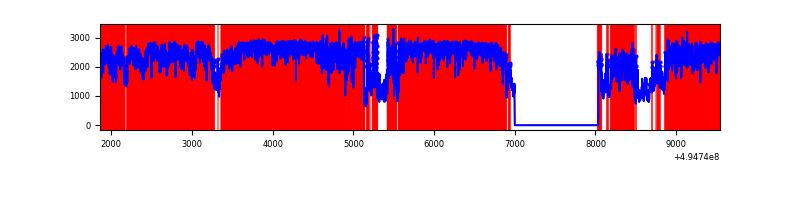 |
| B | 7684 | 6649 | 10 | 10 | 0.13% | 0.15% | 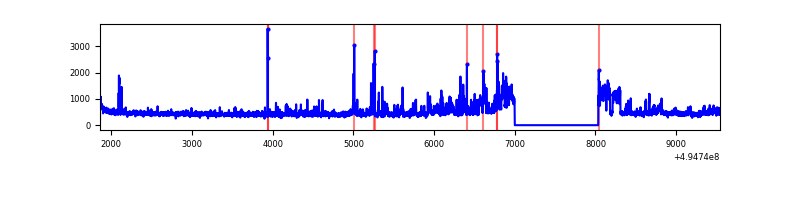 |
| C | 7683 | 6648 | 3240 | 3240 | 42.17% | 48.74% | 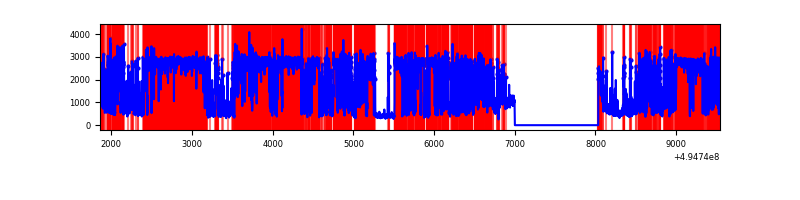 |
| D | 7682 | 6647 | 244 | 244 | 3.18% | 3.67% | 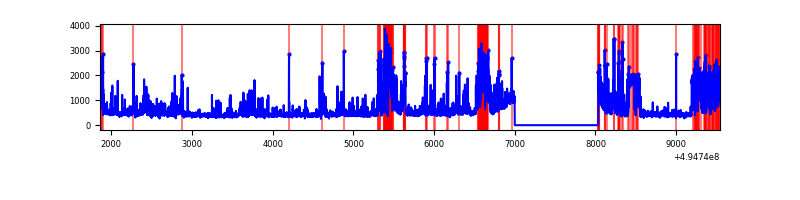 |
Top three noisy pixels from each quadrant. If the there are fewer than three noisy pixels in the level2.evt file, extra rows are filled as -1
| Pixel properties | Quadrant properties | ||||||
|---|---|---|---|---|---|---|---|
| Quadrant | DetID | PixID | Counts | Sigma | Mean | Median | Sigma |
| A | 3 | 63 | 13606967 | 162510.28 | 339 | 332 | 83.7 |
| A | 0 | 8 | 111516 | 1327.92 | 339 | 332 | 83.7 |
| A | 3 | 78 | 90554 | 1077.56 | 339 | 332 | 83.7 |
| B | 5 | 250 | 453156 | 2931.28 | 718 | 690 | 154.4 |
| B | 4 | 81 | 40382 | 257.14 | 718 | 690 | 154.4 |
| B | 5 | 185 | 34934 | 221.85 | 718 | 690 | 154.4 |
| C | 1 | 241 | 6600380 | 46864.79 | 508 | 503 | 140.8 |
| C | 15 | 224 | 2348962 | 16676.07 | 508 | 503 | 140.8 |
| C | 5 | 10 | 242446 | 1718.0 | 508 | 503 | 140.8 |
| D | 2 | 172 | 912663 | 4837.37 | 667 | 639 | 188.5 |
| D | 1 | 241 | 462669 | 2450.61 | 667 | 639 | 188.5 |
| D | 13 | 153 | 301113 | 1593.71 | 667 | 639 | 188.5 |
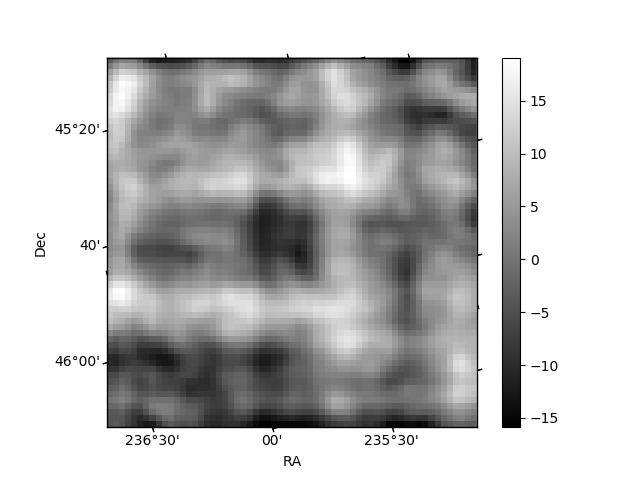
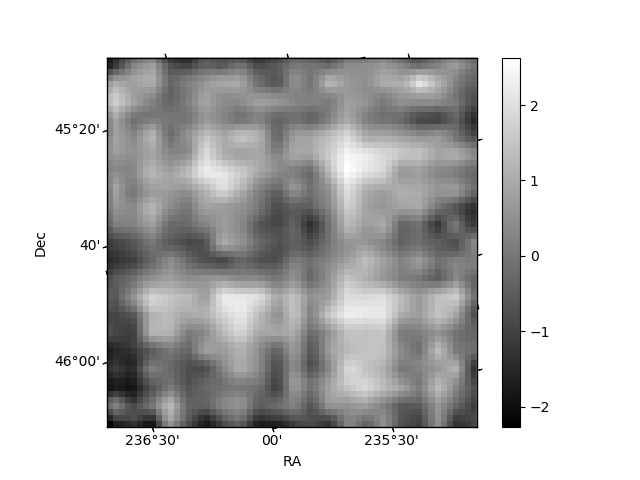
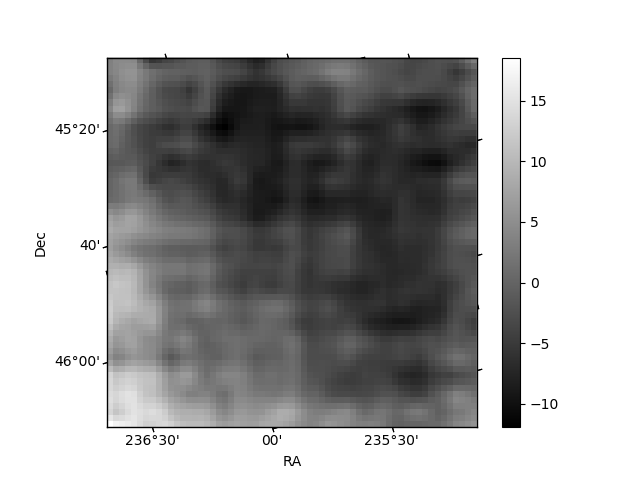
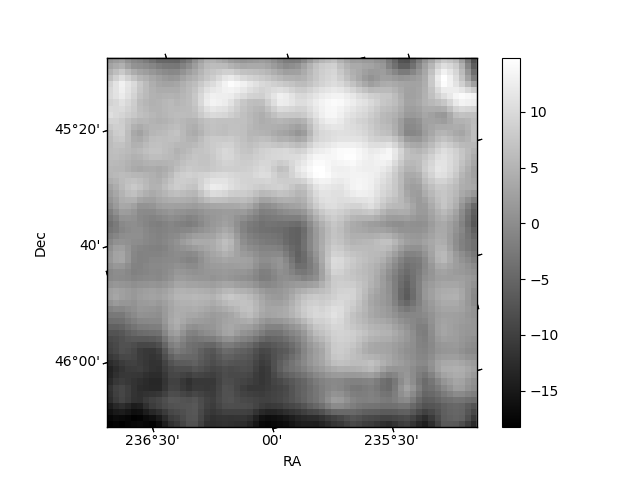
Histogram calculated using DETX and DETY for each event in the final _common_clean file
| Quadrant A | 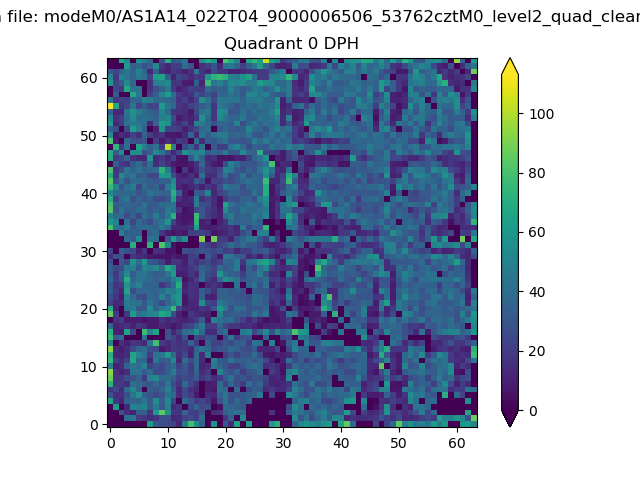 |
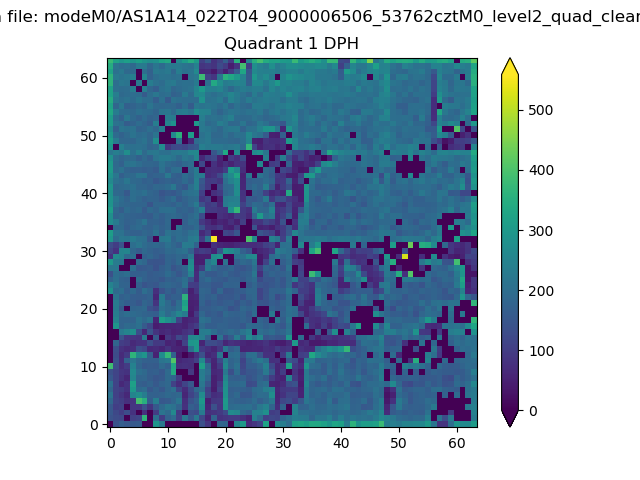 |
Quadrant B |
|---|---|---|---|
| Quadrant D | 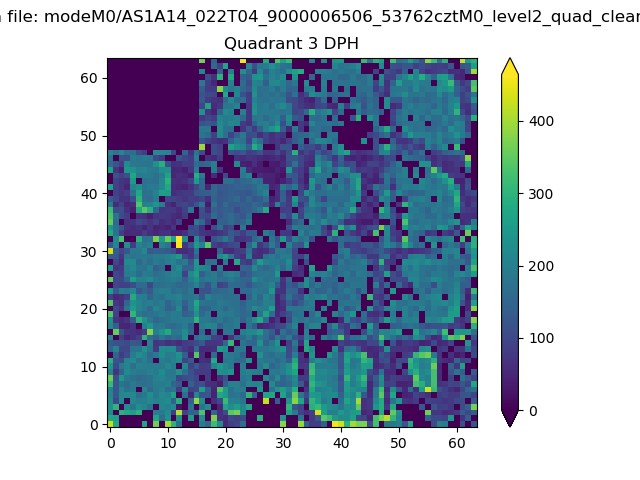 |
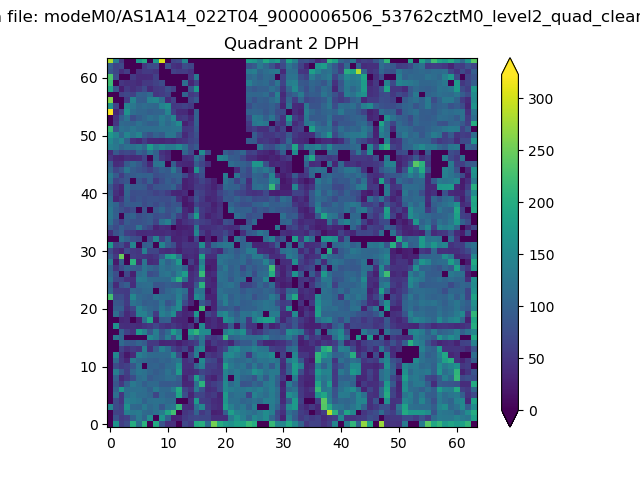 |
Quadrant C |
| Plot type | Count rate plots | Images |
|---|---|---|
| Comparison with Poisson distribution Blue bars denote a histogram of data divided into 1 sec bins. Red curve is a Poisson curve with rate = median count rate of data. |
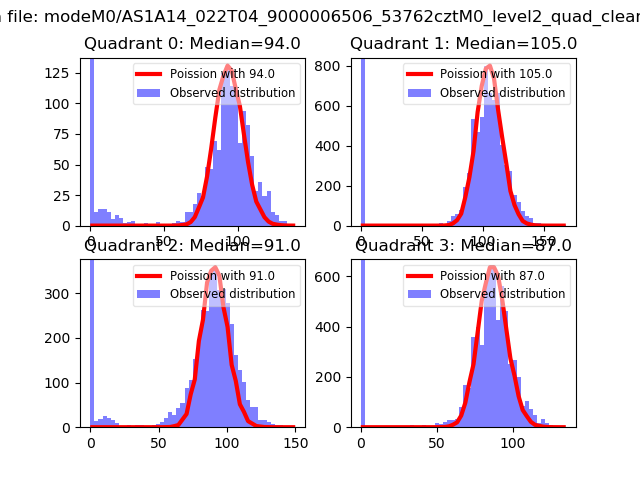 |
 |
| Quadrant-wise count rates Data is divided into 100 sec bins |
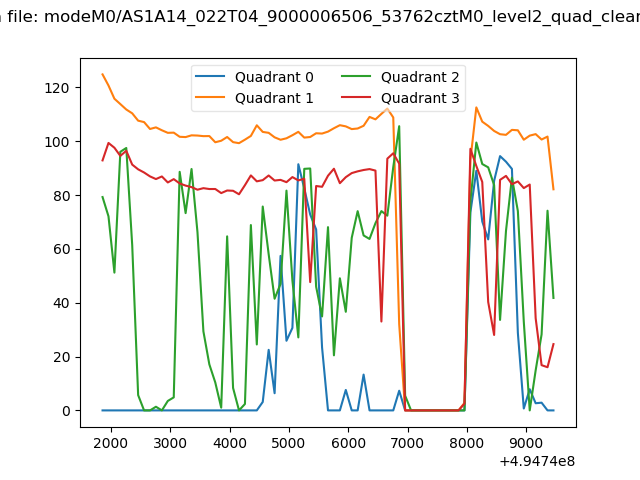 |
|
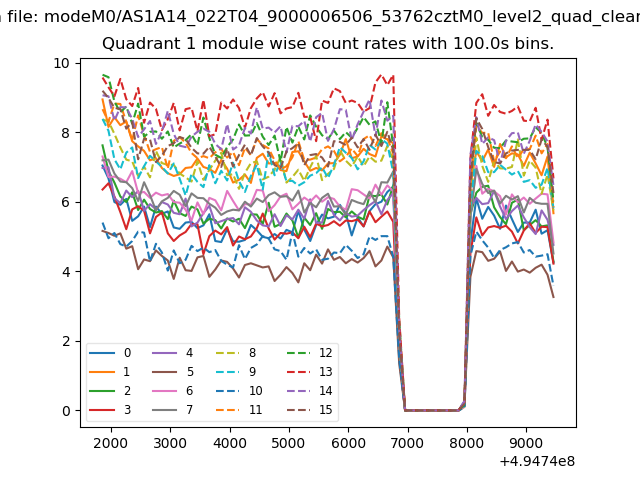
| Module-wise count rates for Quadrant A Data is divided into 100 sec bins |
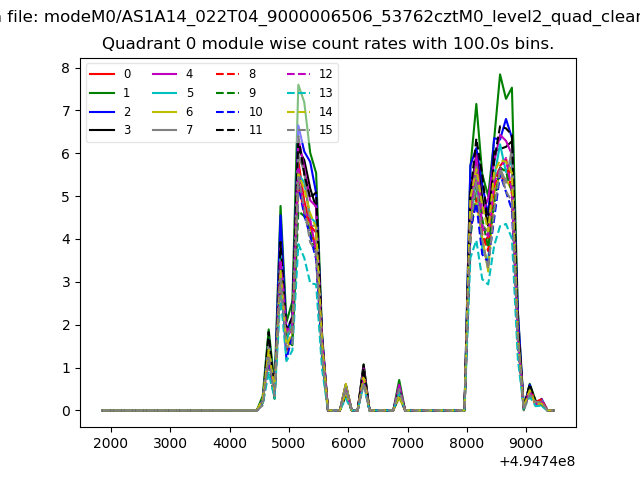 |
 |
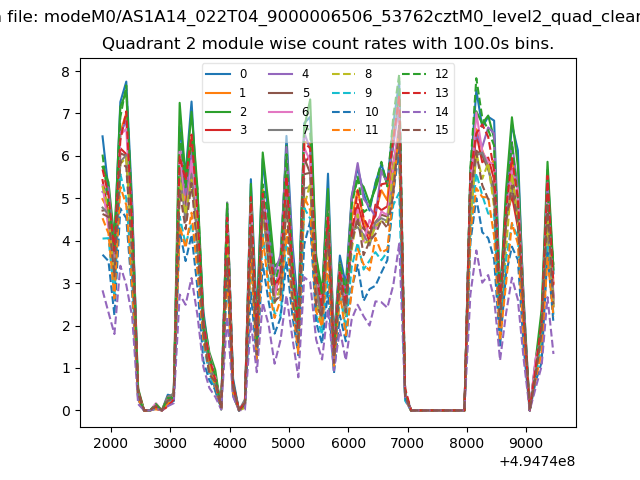
| Module-wise count rates for Quadrant B Data is divided into 100 sec bins |
 |
 |
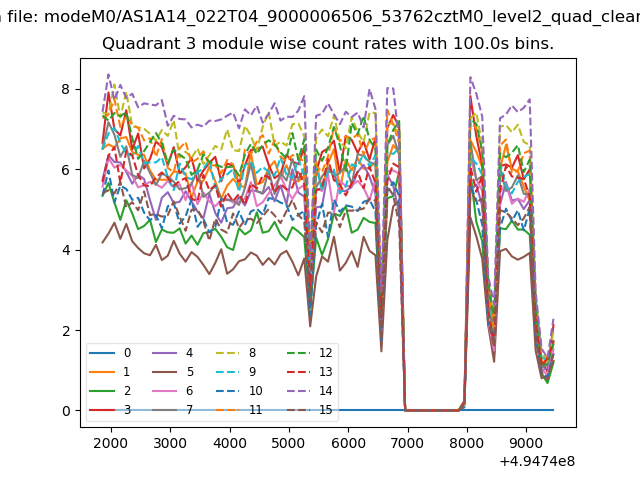
| Module-wise count rates for Quadrant C Data is divided into 100 sec bins |
 |
 |
| Module-wise count rates for Quadrant D Data is divided into 100 sec bins |
 |
 |
| Parameter | Plot |
|---|---|
| CZT HV Monitor | 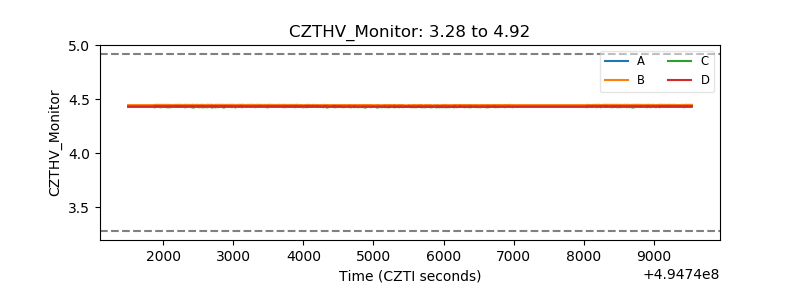 |
| D_VDD | 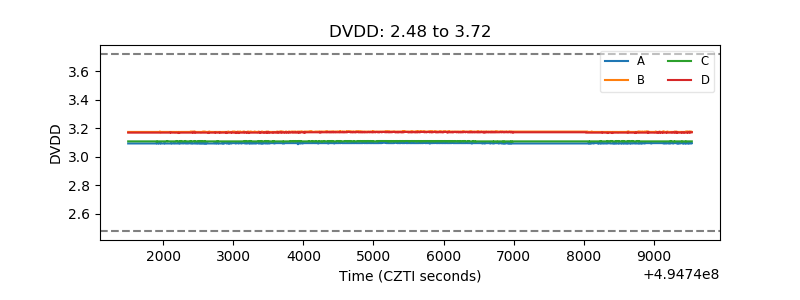 |
| Temperature 1 | 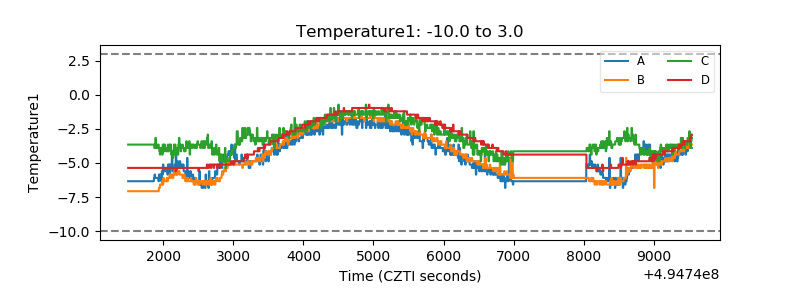 |
| Veto HV Monitor | 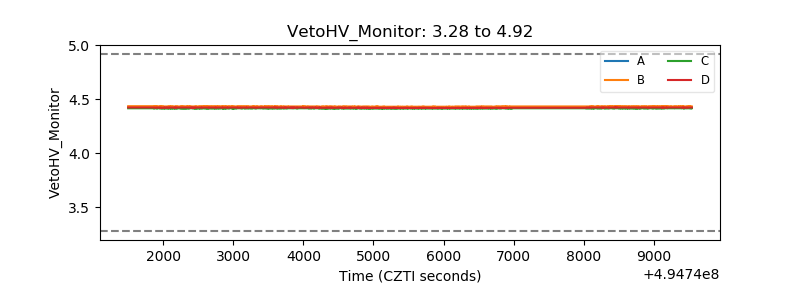 |
| Veto LLD | 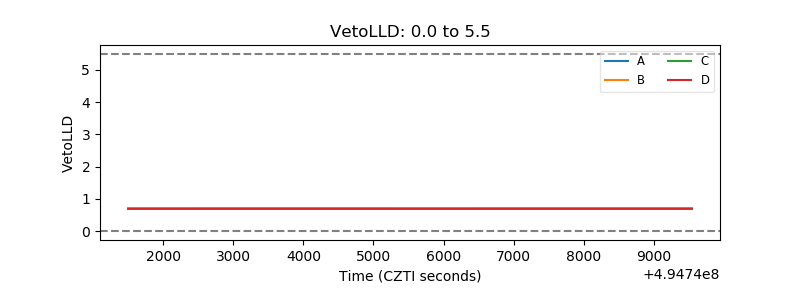 |
| Alpha Counter | 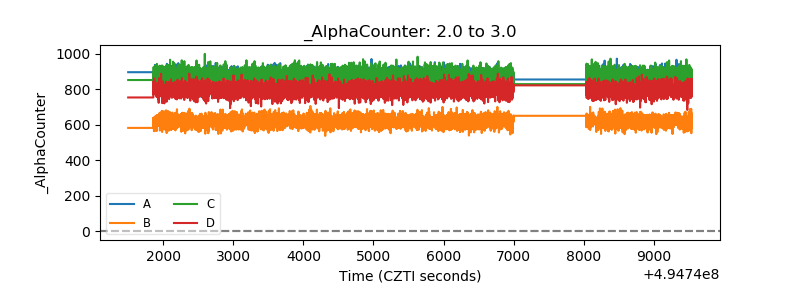 |
| _CPM_Rate | 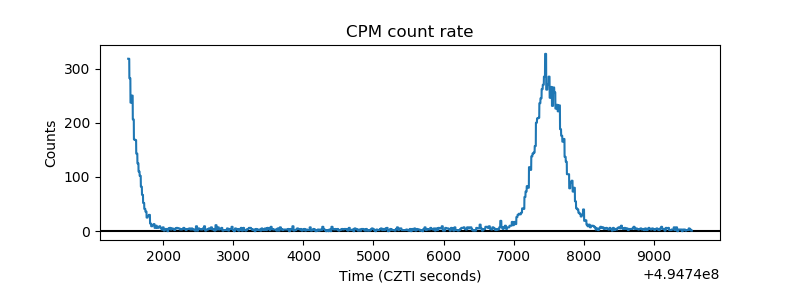 |
| CZT Counter | 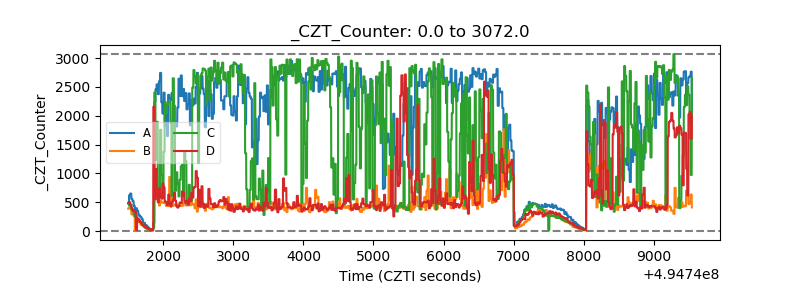 |
| +2.5 Volts monitor |  |
| +5 Volts monitor |  |
| _ROLL_ROT | 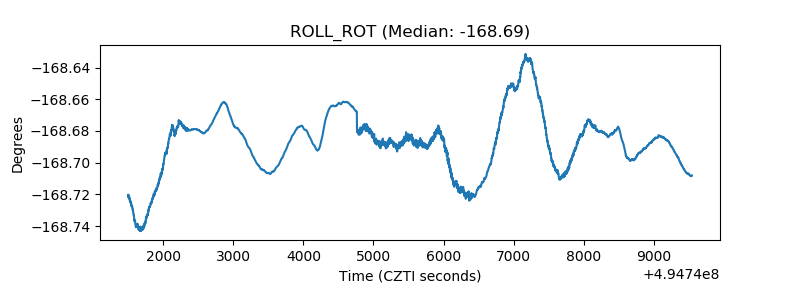 |
| _Roll_DEC | 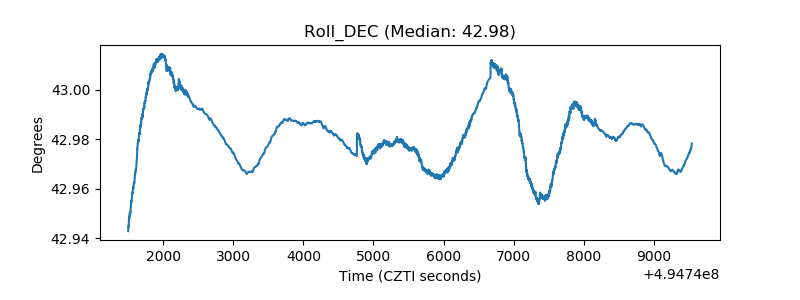 |
| _Roll_RA | 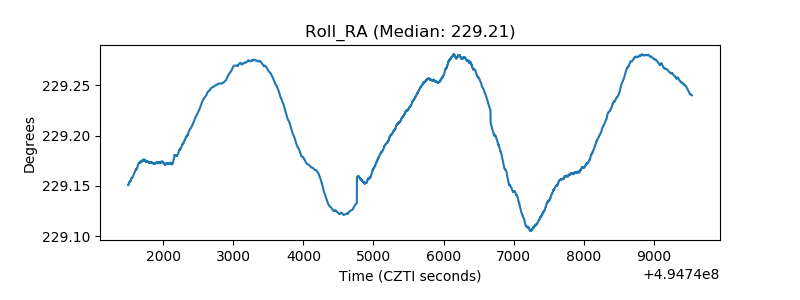 |
| Veto Counter | 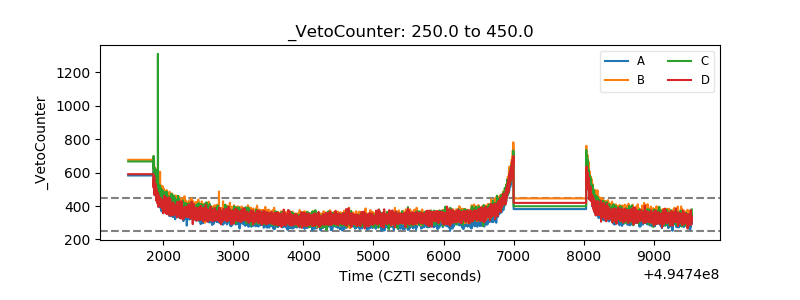 |