| Param | Original file | Final file |
|---|---|---|
| Filename | modeM0/AS1A14_022T04_9000006506_53766cztM0_level2.fits | modeM0/AS1A14_022T04_9000006506_53766cztM0_level2_quad_clean.evt |
| Size (bytes) | 866,946,240 | 91,203,840 |
| Size | 826.8 MB | 87.0 MB |
| Events in quadrant A | 16,849,099 | 210,266 |
| Events in quadrant B | 3,761,815 | 751,891 |
| Events in quadrant C | 5,493,448 | 651,681 |
| Events in quadrant D | 5,402,572 | 622,943 |
| Mode M0 | |||
|---|---|---|---|
| Quadrant | BADHDUFLAG | Total packets | Discarded packets |
| A | 0 | 55246 | 0 |
| B | 0 | 16630 | 0 |
| C | 0 | 21633 | 0 |
| D | 0 | 21326 | 0 |
| Mode SS | |||
|---|---|---|---|
| Quadrant | BADHDUFLAG | Total packets | Discarded packets |
| A | 0 | 150 | 0 |
| B | 0 | 150 | 0 |
| C | 0 | 150 | 0 |
| D | 0 | 150 | 0 |
| Quadrant | Total seconds | Saturated seconds | Saturation percentage |
|---|---|---|---|
| A | 7541 | 5544 | 73.518101% |
| B | 7541 | 64 | 0.848694% |
| C | 7541 | 320 | 4.243469% |
| D | 7541 | 306 | 4.057817% |
Noise dominated data is calculated using 1-second bins in cleaned event files. If a bin has >2000 counts, and if more than 50% of those come from <1% of pixels, then it is considered to be noise-dominated and hence unusable.
| Quadrant | # 1 sec bins | Bins with >0 counts | Bins with >2000 counts | High rate bins dominated by noise | Noise dominated (total time) | Noise dominated (detector-on time) | Marked lightcurve |
|---|---|---|---|---|---|---|---|
| A | 7540 | 7540 | 5618 | 5618 | 74.51% | 74.51% | 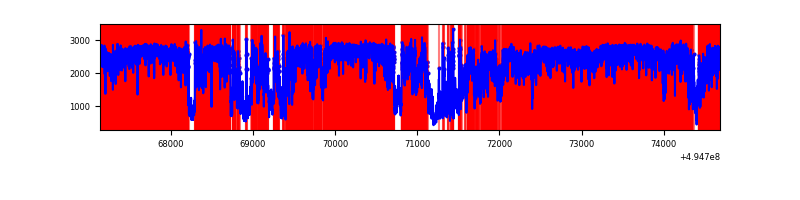 |
| B | 7541 | 7541 | 40 | 40 | 0.53% | 0.53% | 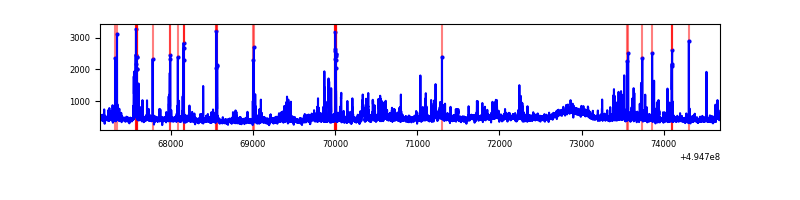 |
| C | 7541 | 7541 | 315 | 315 | 4.18% | 4.18% | 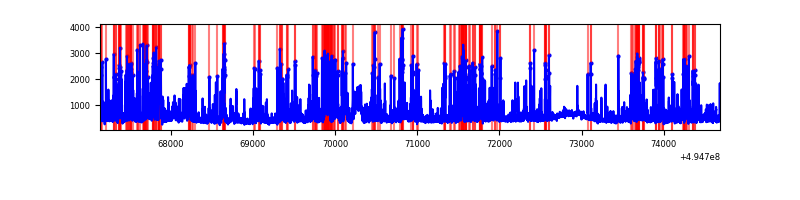 |
| D | 7541 | 7541 | 327 | 327 | 4.34% | 4.34% | 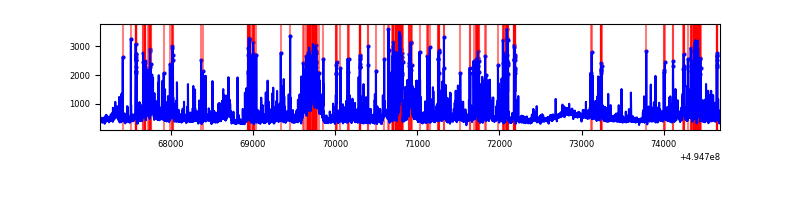 |
Top three noisy pixels from each quadrant. If the there are fewer than three noisy pixels in the level2.evt file, extra rows are filled as -1
| Pixel properties | Quadrant properties | ||||||
|---|---|---|---|---|---|---|---|
| Quadrant | DetID | PixID | Counts | Sigma | Mean | Median | Sigma |
| A | 3 | 63 | 14114278 | 115107.81 | 489 | 477 | 122.6 |
| A | 4 | 249 | 395585 | 3222.38 | 489 | 477 | 122.6 |
| A | 3 | 78 | 230505 | 1876.04 | 489 | 477 | 122.6 |
| B | 5 | 185 | 136554 | 806.49 | 784 | 756 | 168.4 |
| B | 5 | 250 | 111314 | 656.59 | 784 | 756 | 168.4 |
| B | 0 | 213 | 93092 | 548.37 | 784 | 756 | 168.4 |
| C | 15 | 224 | 2003261 | 9562.48 | 760 | 752 | 209.4 |
| C | 15 | 158 | 108634 | 515.16 | 760 | 752 | 209.4 |
| C | 12 | 252 | 94238 | 446.42 | 760 | 752 | 209.4 |
| D | 1 | 241 | 1240656 | 5700.08 | 766 | 734 | 217.5 |
| D | 2 | 172 | 240797 | 1103.6 | 766 | 734 | 217.5 |
| D | 14 | 52 | 167602 | 767.11 | 766 | 734 | 217.5 |
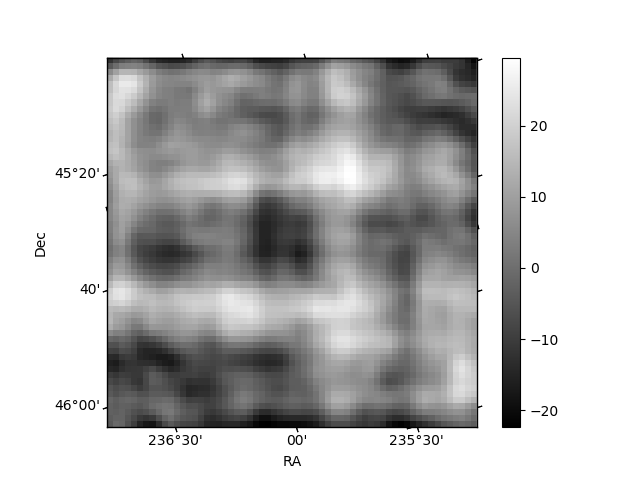
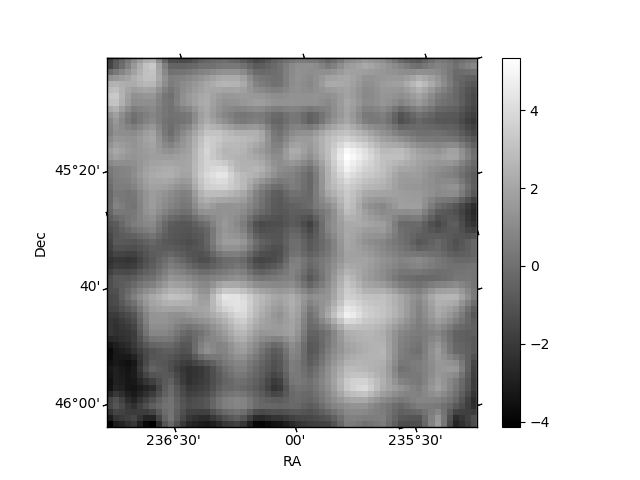
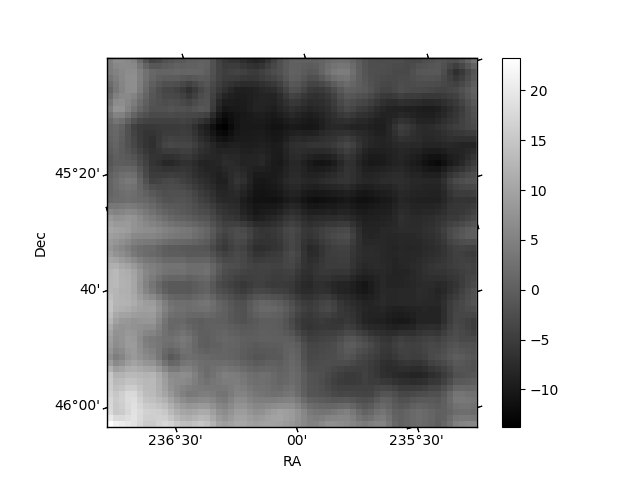
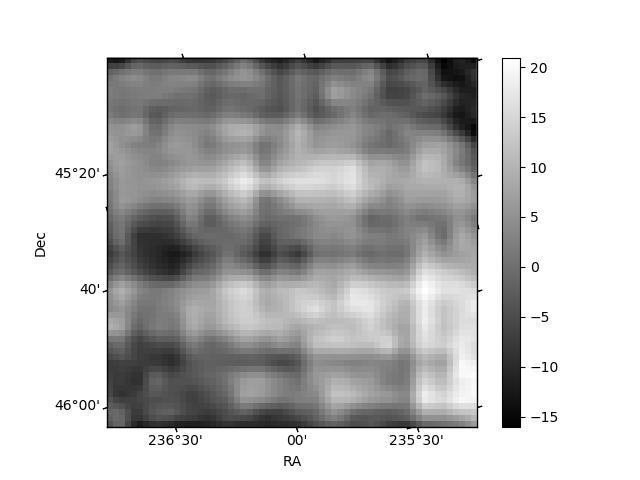
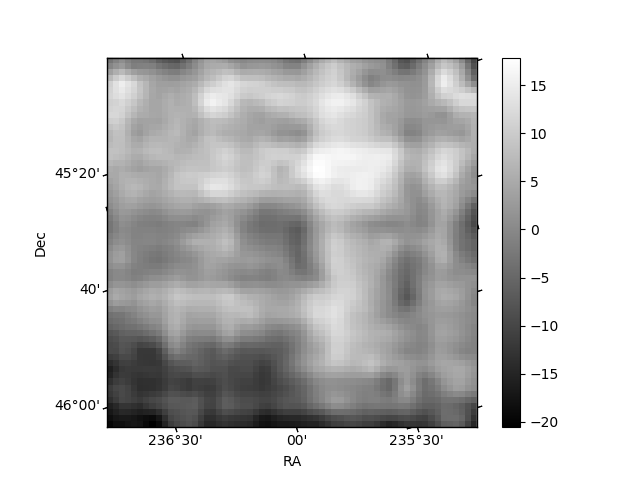
Histogram calculated using DETX and DETY for each event in the final _common_clean file
| Quadrant A | 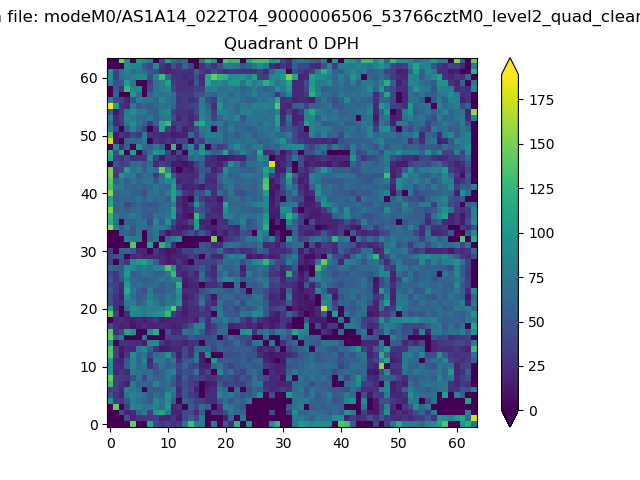 |
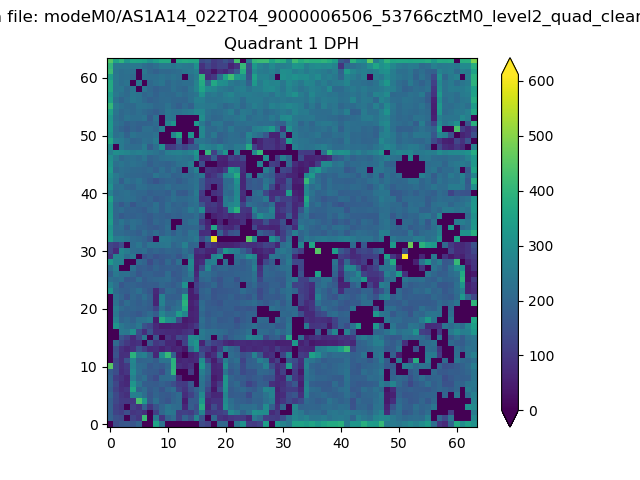 |
Quadrant B |
|---|---|---|---|
| Quadrant D | 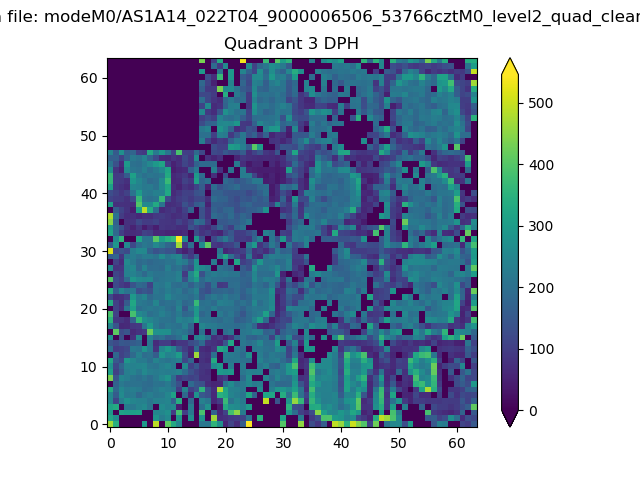 |
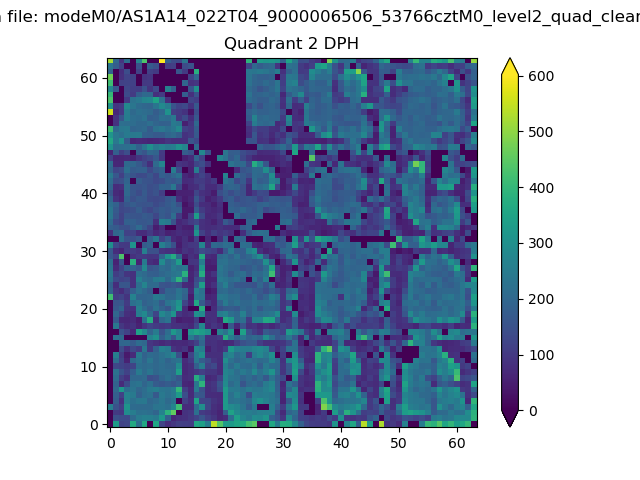 |
Quadrant C |
| Plot type | Count rate plots | Images |
|---|---|---|
| Comparison with Poisson distribution Blue bars denote a histogram of data divided into 1 sec bins. Red curve is a Poisson curve with rate = median count rate of data. |
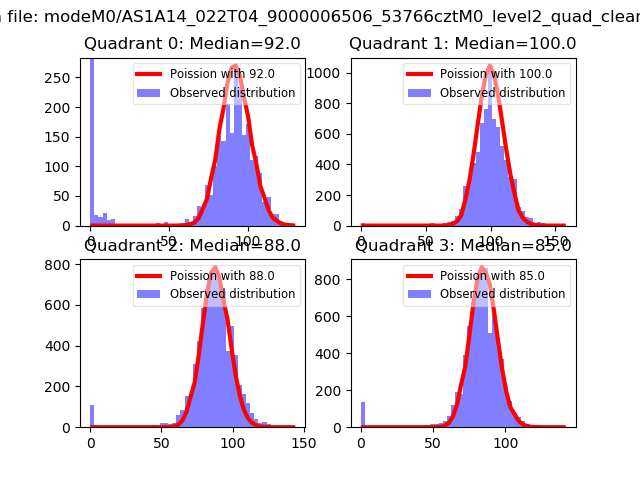 |
 |
| Quadrant-wise count rates Data is divided into 100 sec bins |
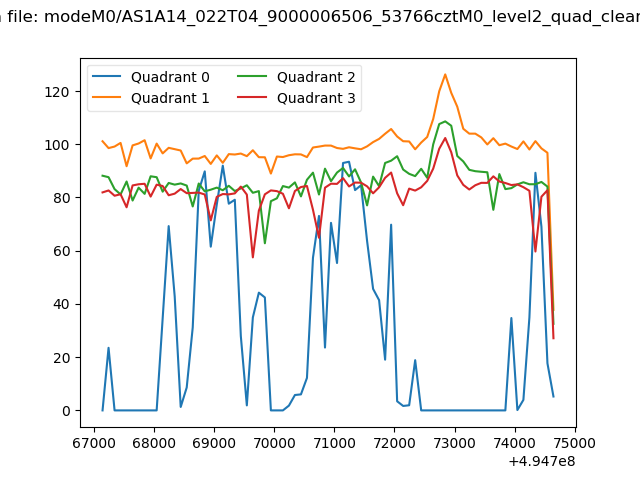 |
|
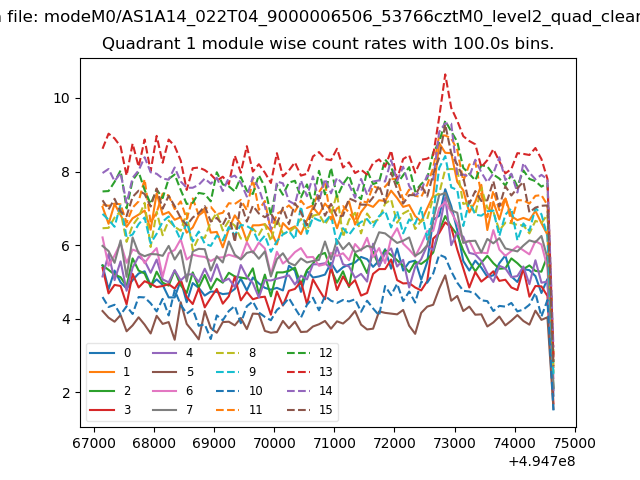
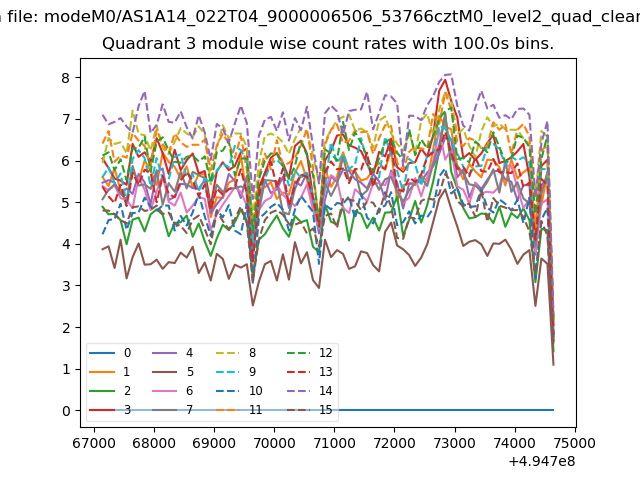
| Module-wise count rates for Quadrant A Data is divided into 100 sec bins |
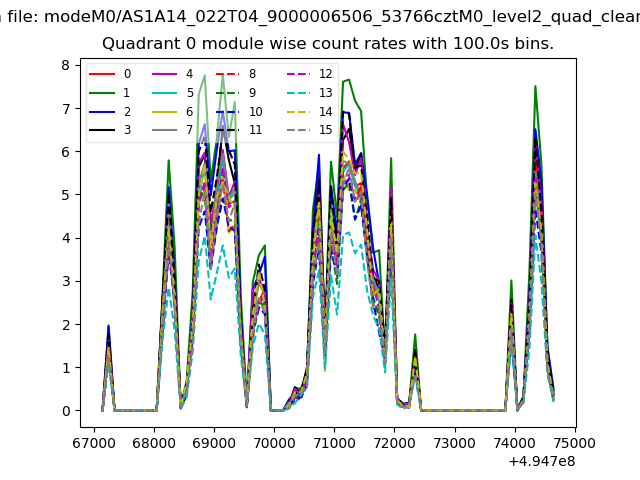 |
 |
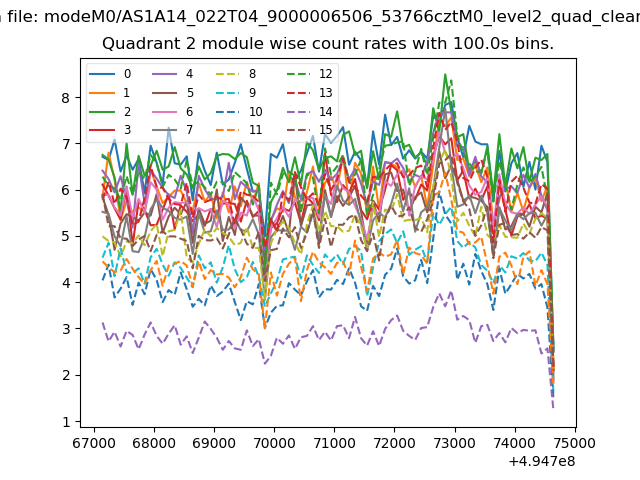
| Module-wise count rates for Quadrant B Data is divided into 100 sec bins |
 |
 |
| Module-wise count rates for Quadrant C Data is divided into 100 sec bins |
 |
 |
| Module-wise count rates for Quadrant D Data is divided into 100 sec bins |
 |
 |
| Parameter | Plot |
|---|---|
| CZT HV Monitor | 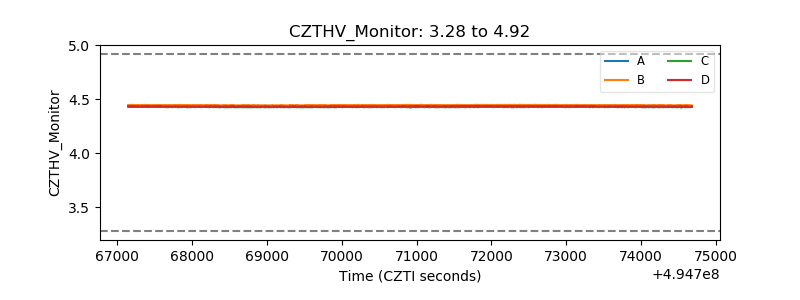 |
| D_VDD | 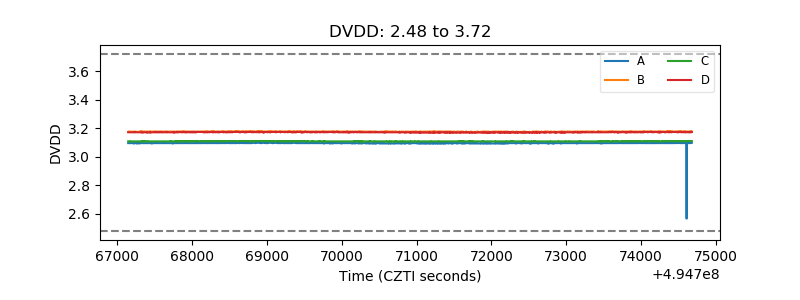 |
| Temperature 1 | 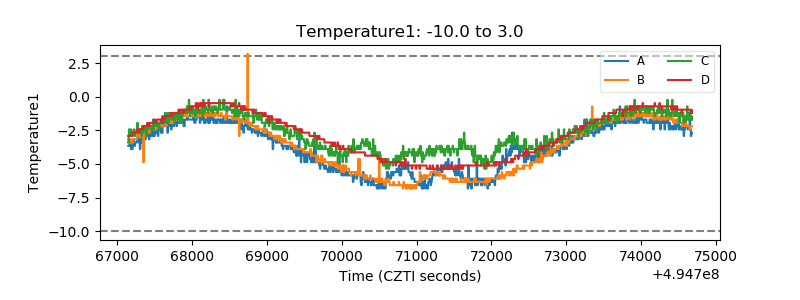 |
| Veto HV Monitor | 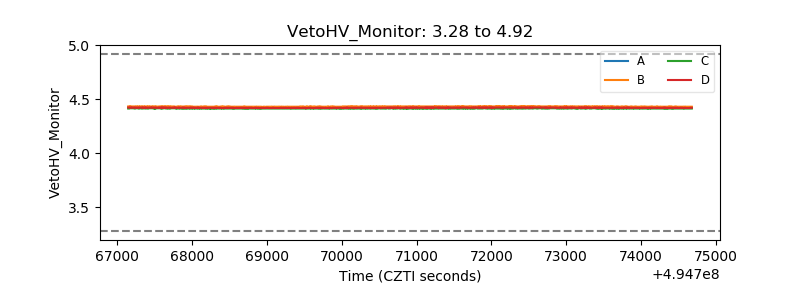 |
| Veto LLD | 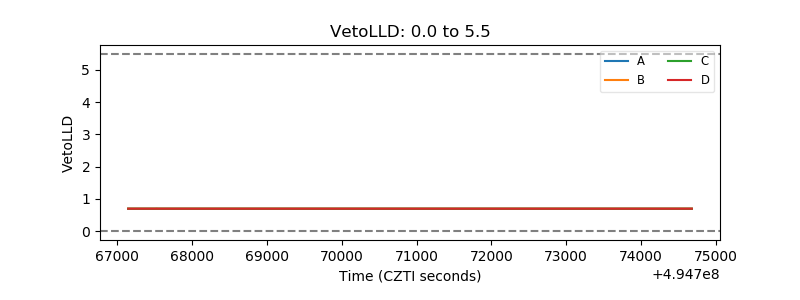 |
| Alpha Counter | 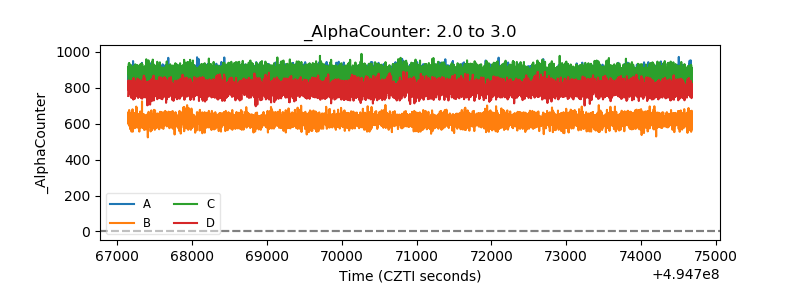 |
| _CPM_Rate | 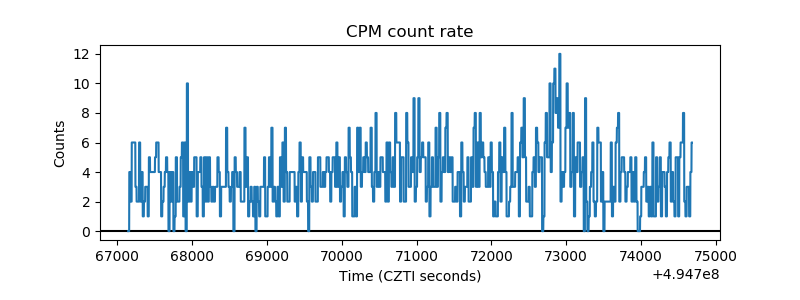 |
| CZT Counter | 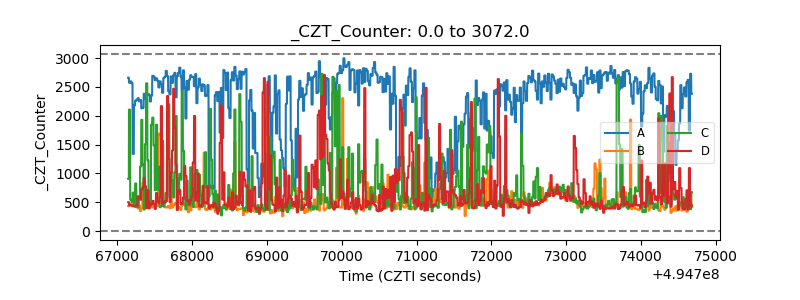 |
| +2.5 Volts monitor |  |
| +5 Volts monitor |  |
| _ROLL_ROT | 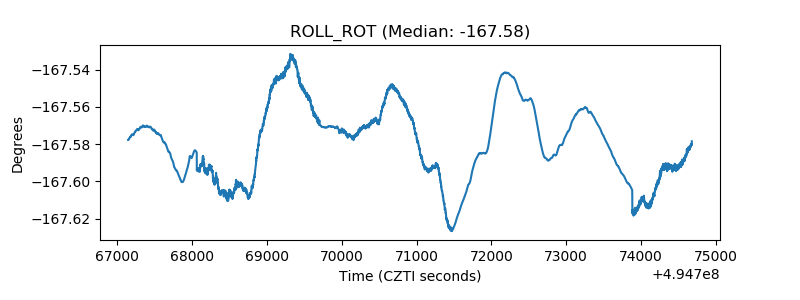 |
| _Roll_DEC | 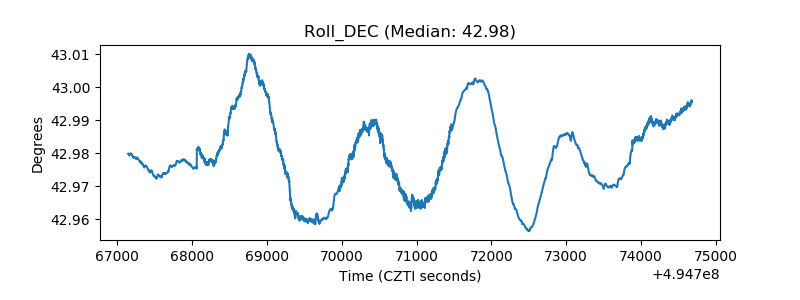 |
| _Roll_RA | 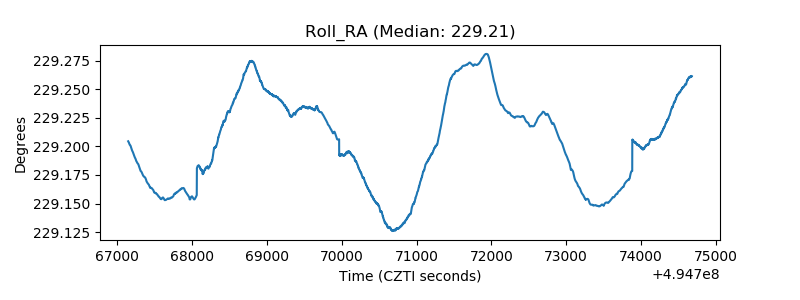 |
| Veto Counter | 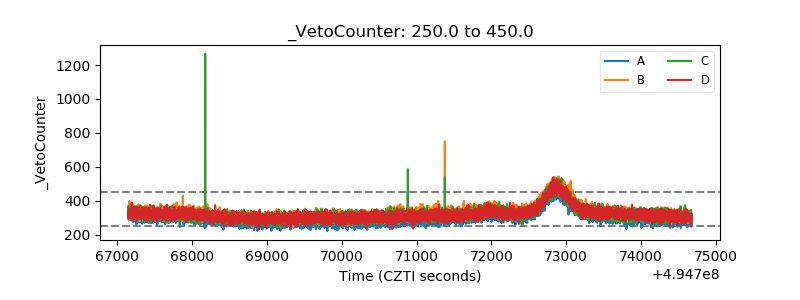 |