| Param | Original file | Final file |
|---|---|---|
| Filename | modeM0/AS1A14_022T04_9000006506_53769cztM0_level2.fits | modeM0/AS1A14_022T04_9000006506_53769cztM0_level2_quad_clean.evt |
| Size (bytes) | 1,117,638,720 | 90,527,040 |
| Size | 1.0 GB | 86.3 MB |
| Events in quadrant A | 20,796,525 | 36,533 |
| Events in quadrant B | 4,672,339 | 813,090 |
| Events in quadrant C | 7,993,651 | 678,980 |
| Events in quadrant D | 7,262,012 | 631,474 |
| Mode M0 | |||
|---|---|---|---|
| Quadrant | BADHDUFLAG | Total packets | Discarded packets |
| A | 0 | 67516 | 6 |
| B | 0 | 19856 | 1 |
| C | 0 | 29660 | 1 |
| D | 0 | 27492 | 1 |
| Mode SS | |||
|---|---|---|---|
| Quadrant | BADHDUFLAG | Total packets | Discarded packets |
| A | 0 | 170 | 0 |
| B | 0 | 170 | 0 |
| C | 0 | 170 | 0 |
| D | 0 | 170 | 0 |
| Mode M9 | |||
|---|---|---|---|
| Quadrant | BADHDUFLAG | Total packets | Discarded packets |
| A | 0 | 1 | 0 |
| B | 0 | 1 | 0 |
| C | 0 | 1 | 0 |
| D | 0 | 1 | 0 |
| Quadrant | Total seconds | Saturated seconds | Saturation percentage |
|---|---|---|---|
| A | 8356 | 8036 | 96.170416% |
| B | 8357 | 227 | 2.716286% |
| C | 8357 | 922 | 11.032667% |
| D | 8357 | 994 | 11.894220% |
Noise dominated data is calculated using 1-second bins in cleaned event files. If a bin has >2000 counts, and if more than 50% of those come from <1% of pixels, then it is considered to be noise-dominated and hence unusable.
| Quadrant | # 1 sec bins | Bins with >0 counts | Bins with >2000 counts | High rate bins dominated by noise | Noise dominated (total time) | Noise dominated (detector-on time) | Marked lightcurve |
|---|---|---|---|---|---|---|---|
| A | 8445 | 8355 | 7826 | 7826 | 92.67% | 93.67% | 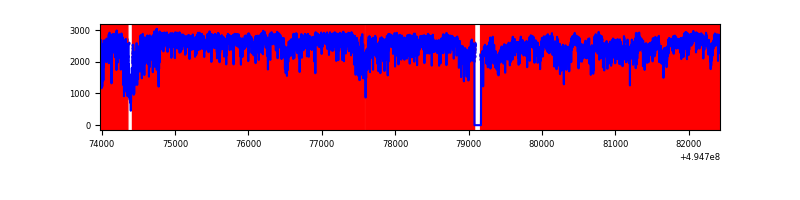 |
| B | 8447 | 8357 | 168 | 168 | 1.99% | 2.01% | 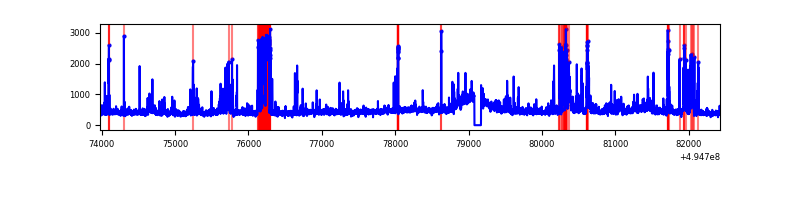 |
| C | 8447 | 8358 | 843 | 843 | 9.98% | 10.09% | 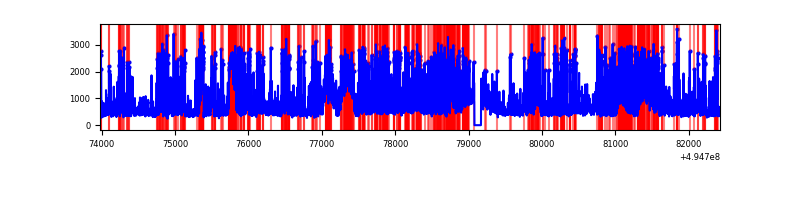 |
| D | 8447 | 8358 | 938 | 938 | 11.10% | 11.22% | 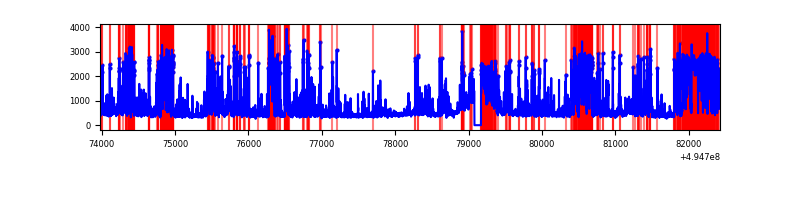 |
Top three noisy pixels from each quadrant. If the there are fewer than three noisy pixels in the level2.evt file, extra rows are filled as -1
| Pixel properties | Quadrant properties | ||||||
|---|---|---|---|---|---|---|---|
| Quadrant | DetID | PixID | Counts | Sigma | Mean | Median | Sigma |
| A | 3 | 63 | 17520513 | 320898.67 | 211 | 206 | 54.6 |
| A | 3 | 78 | 1591956 | 29154.2 | 211 | 206 | 54.6 |
| A | 15 | 174 | 438558 | 8028.77 | 211 | 206 | 54.6 |
| B | 5 | 185 | 371789 | 2019.04 | 854 | 825 | 183.7 |
| B | 6 | 255 | 184855 | 1001.62 | 854 | 825 | 183.7 |
| B | 4 | 81 | 147142 | 796.36 | 854 | 825 | 183.7 |
| C | 15 | 224 | 3290062 | 14508.51 | 815 | 805 | 226.7 |
| C | 15 | 158 | 460756 | 2028.79 | 815 | 805 | 226.7 |
| C | 1 | 241 | 328249 | 1444.32 | 815 | 805 | 226.7 |
| D | 1 | 241 | 2683365 | 11611.64 | 807 | 773 | 231.0 |
| D | 8 | 176 | 280053 | 1208.87 | 807 | 773 | 231.0 |
| D | 13 | 153 | 208461 | 898.98 | 807 | 773 | 231.0 |
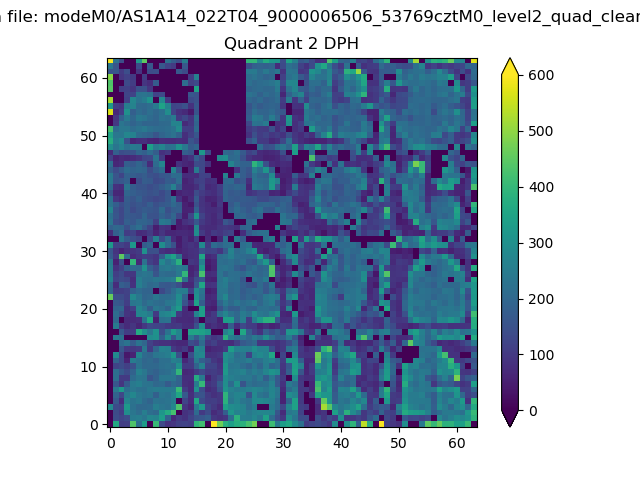
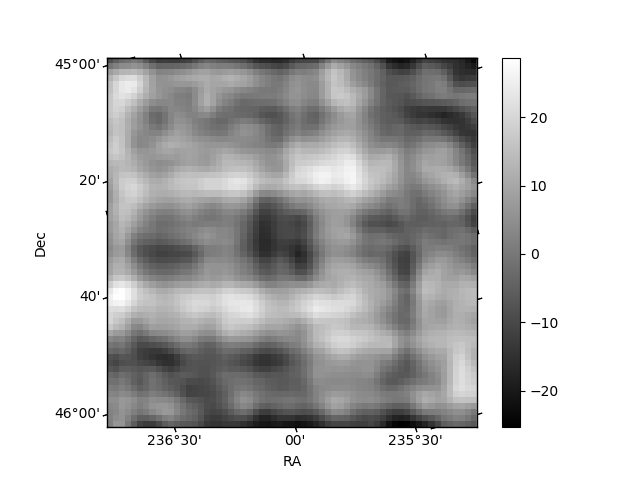
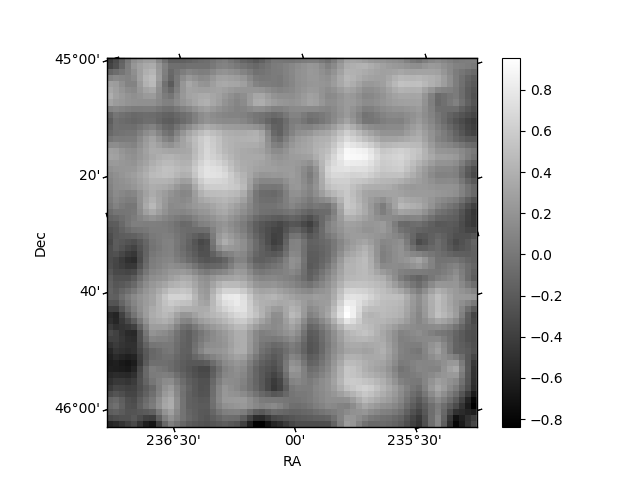
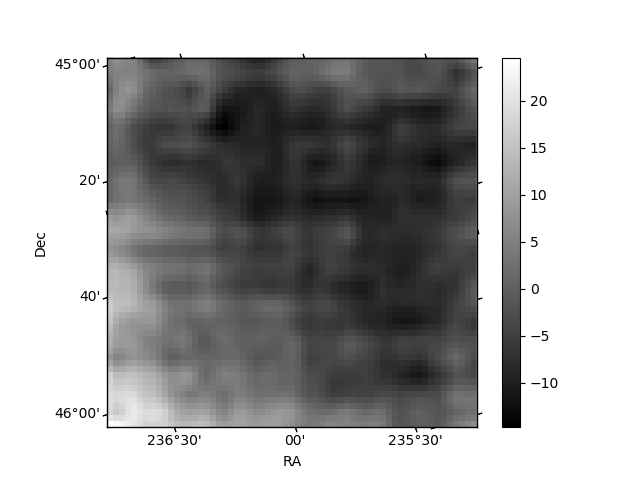
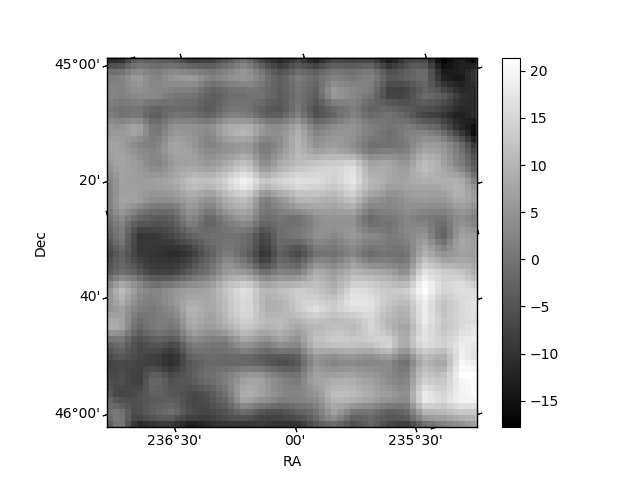
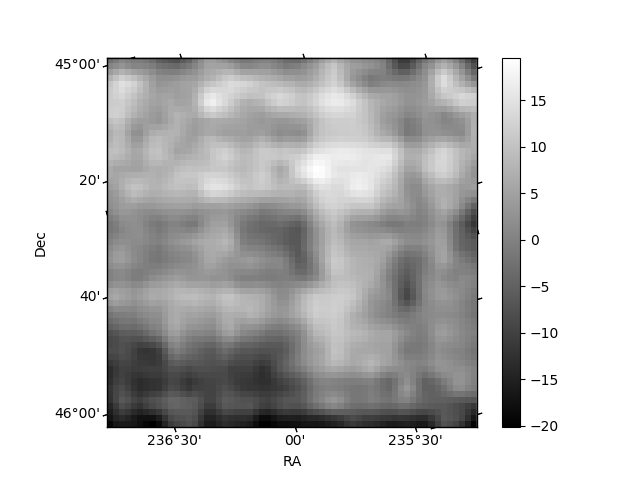
Histogram calculated using DETX and DETY for each event in the final _common_clean file
| Quadrant A | 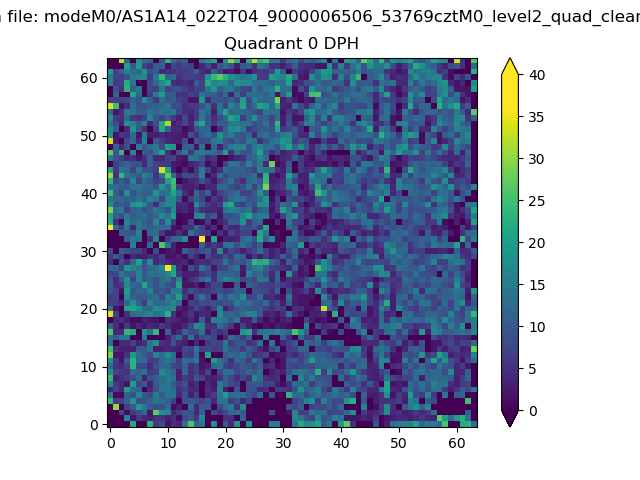 |
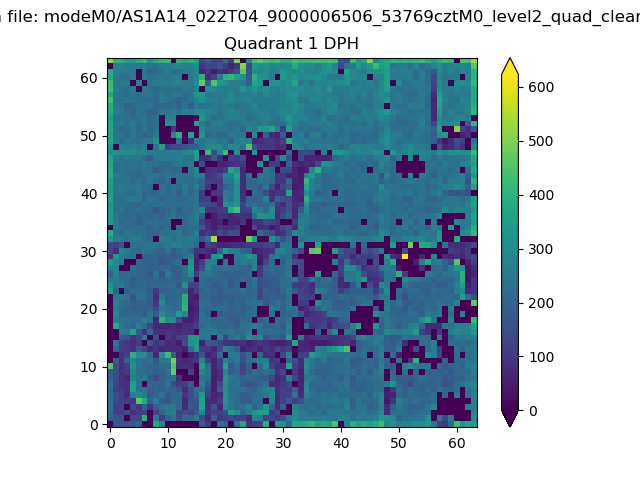 |
Quadrant B |
|---|---|---|---|
| Quadrant D | 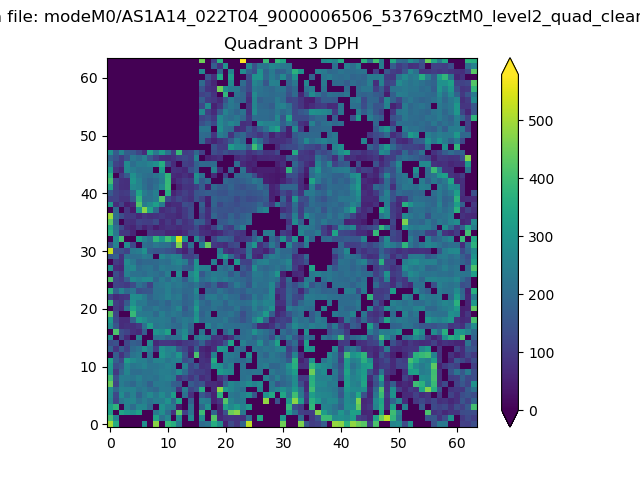 |
 |
Quadrant C |
| Plot type | Count rate plots | Images |
|---|---|---|
| Comparison with Poisson distribution Blue bars denote a histogram of data divided into 1 sec bins. Red curve is a Poisson curve with rate = median count rate of data. |
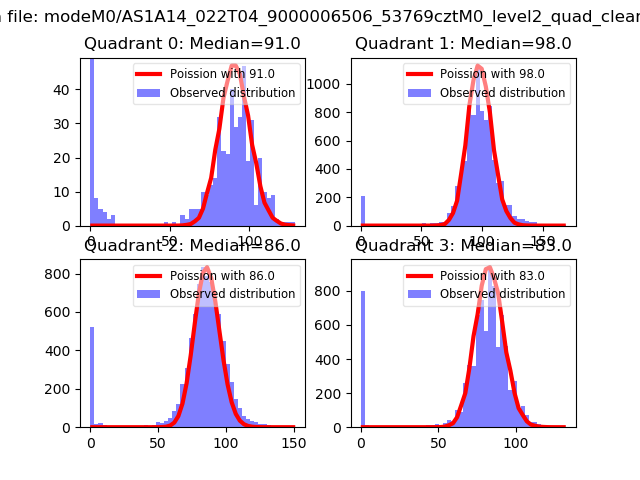 |
 |
| Quadrant-wise count rates Data is divided into 100 sec bins |
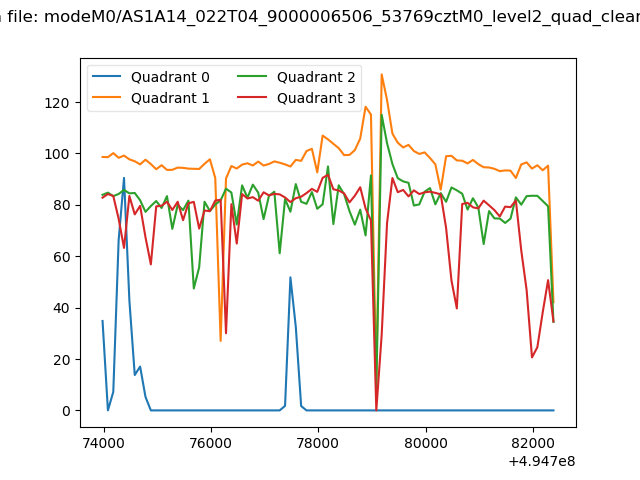 |
|
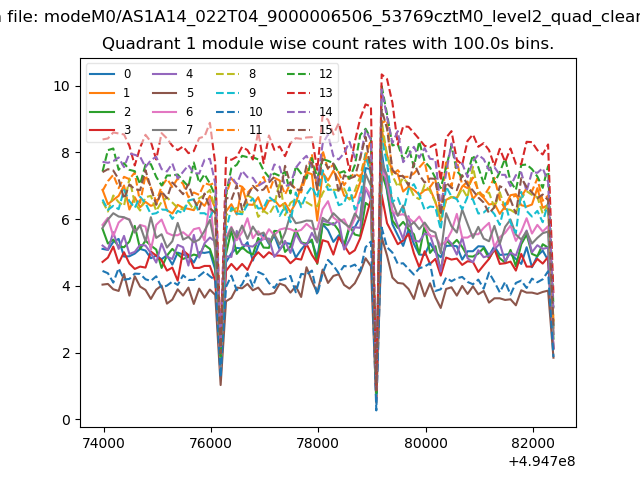
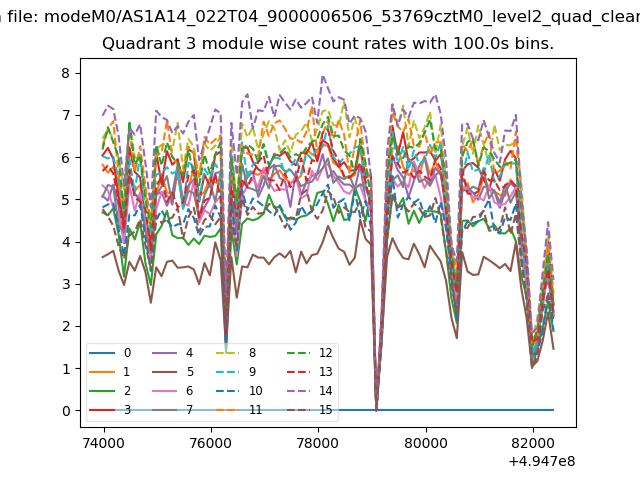
| Module-wise count rates for Quadrant A Data is divided into 100 sec bins |
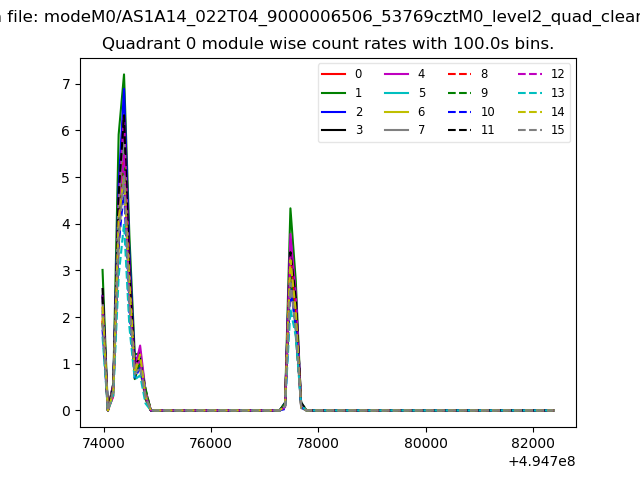 |
 |
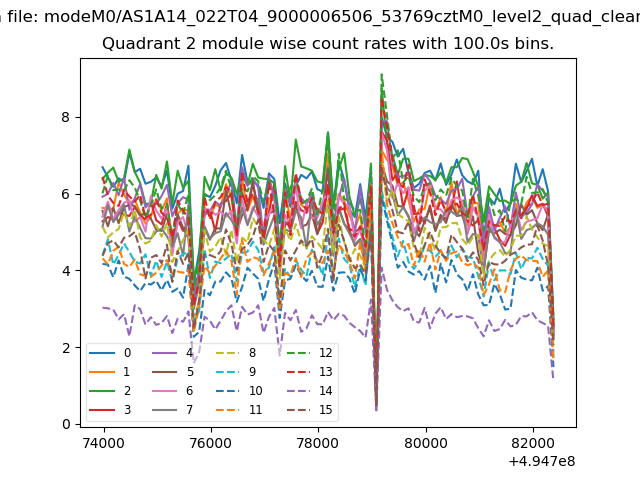
| Module-wise count rates for Quadrant B Data is divided into 100 sec bins |
 |
 |
| Module-wise count rates for Quadrant C Data is divided into 100 sec bins |
 |
 |
| Module-wise count rates for Quadrant D Data is divided into 100 sec bins |
 |
 |
| Parameter | Plot |
|---|---|
| CZT HV Monitor | 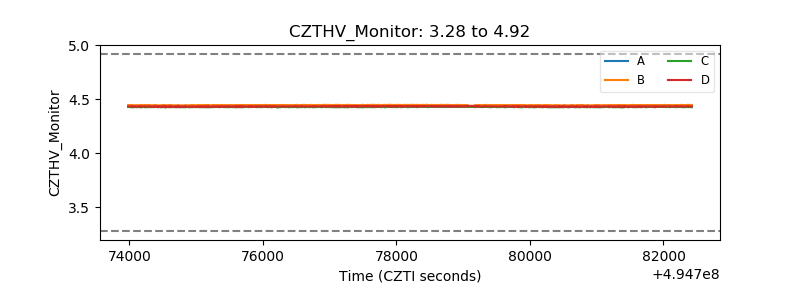 |
| D_VDD | 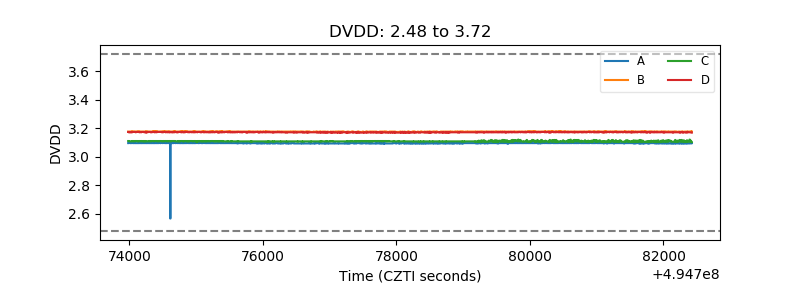 |
| Temperature 1 | 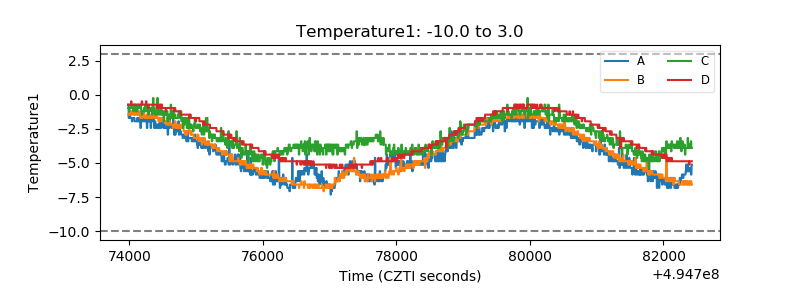 |
| Veto HV Monitor | 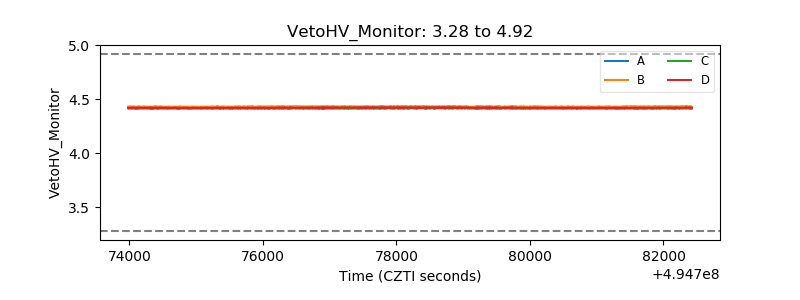 |
| Veto LLD | 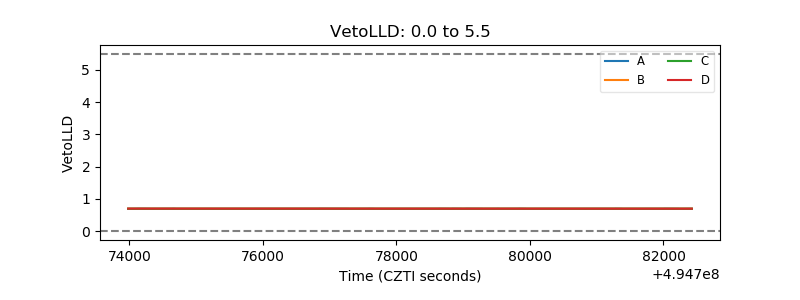 |
| Alpha Counter | 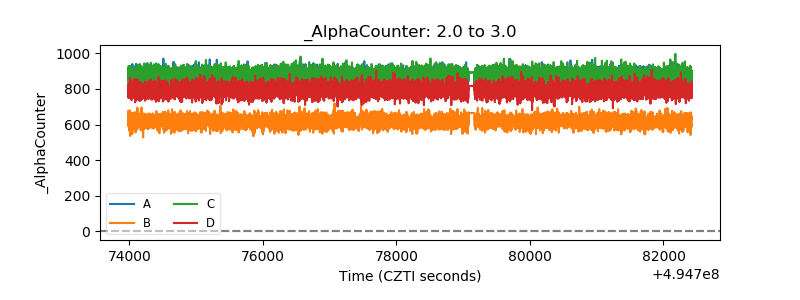 |
| _CPM_Rate | 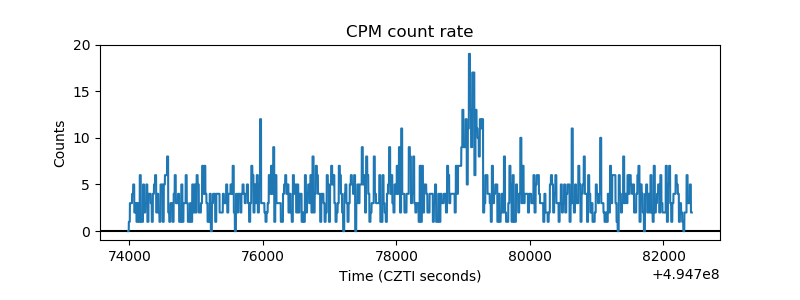 |
| CZT Counter | 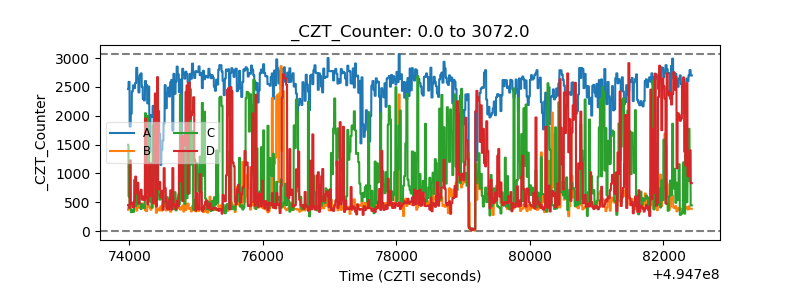 |
| +2.5 Volts monitor |  |
| +5 Volts monitor |  |
| _ROLL_ROT | 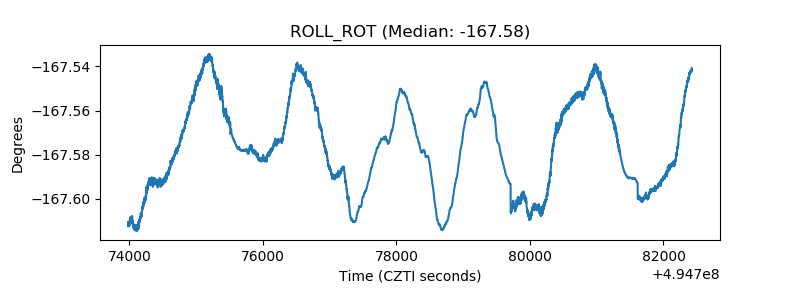 |
| _Roll_DEC | 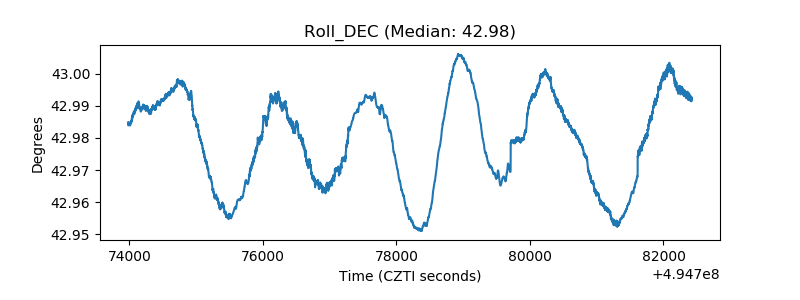 |
| _Roll_RA | 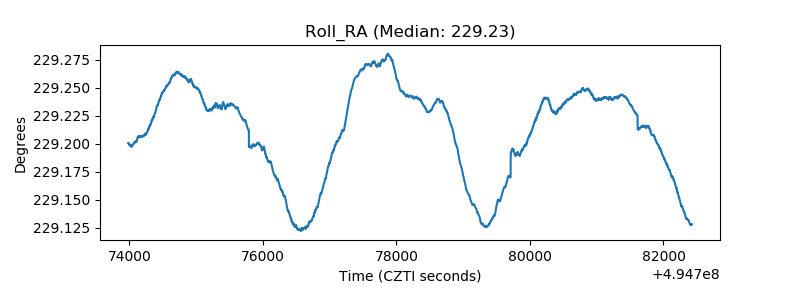 |
| Veto Counter | 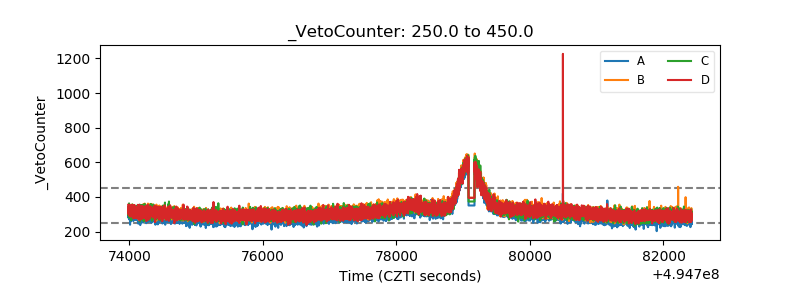 |