| Param | Original file | Final file |
|---|---|---|
| Filename | modeM0/AS1A14_022T04_9000006506_53770cztM0_level2.fits | modeM0/AS1A14_022T04_9000006506_53770cztM0_level2_quad_clean.evt |
| Size (bytes) | 1,980,910,080 | 165,594,240 |
| Size | 1.8 GB | 157.9 MB |
| Events in quadrant A | 38,367,395 | 49,111 |
| Events in quadrant B | 8,874,879 | 1,479,862 |
| Events in quadrant C | 11,771,086 | 1,285,882 |
| Events in quadrant D | 13,130,192 | 1,141,424 |
| Mode M0 | |||
|---|---|---|---|
| Quadrant | BADHDUFLAG | Total packets | Discarded packets |
| A | 0 | 124522 | 3 |
| B | 0 | 37351 | 3 |
| C | 0 | 45700 | 3 |
| D | 0 | 49946 | 3 |
| Mode SS | |||
|---|---|---|---|
| Quadrant | BADHDUFLAG | Total packets | Discarded packets |
| A | 0 | 314 | 0 |
| B | 0 | 314 | 0 |
| C | 0 | 314 | 0 |
| D | 0 | 314 | 0 |
| Mode M9 | |||
|---|---|---|---|
| Quadrant | BADHDUFLAG | Total packets | Discarded packets |
| A | 0 | 18 | 0 |
| B | 0 | 18 | 0 |
| C | 0 | 18 | 0 |
| D | 0 | 18 | 0 |
| Quadrant | Total seconds | Saturated seconds | Saturation percentage |
|---|---|---|---|
| A | 15312 | 14859 | 97.041536% |
| B | 15312 | 515 | 3.363375% |
| C | 15312 | 1021 | 6.667973% |
| D | 15311 | 1892 | 12.357129% |
Noise dominated data is calculated using 1-second bins in cleaned event files. If a bin has >2000 counts, and if more than 50% of those come from <1% of pixels, then it is considered to be noise-dominated and hence unusable.
| Quadrant | # 1 sec bins | Bins with >0 counts | Bins with >2000 counts | High rate bins dominated by noise | Noise dominated (total time) | Noise dominated (detector-on time) | Marked lightcurve |
|---|---|---|---|---|---|---|---|
| A | 17191 | 15311 | 14341 | 14341 | 83.42% | 93.66% | 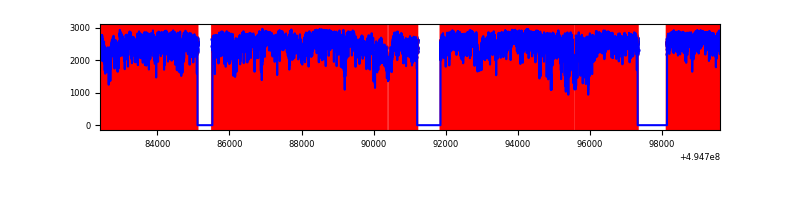 |
| B | 17192 | 15314 | 328 | 328 | 1.91% | 2.14% | 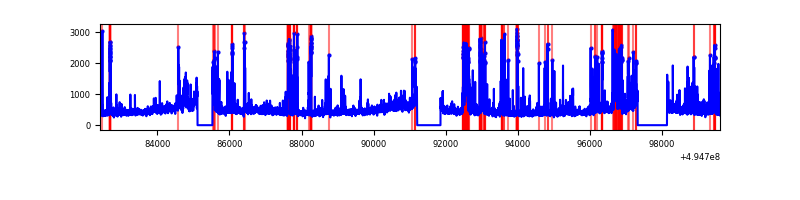 |
| C | 17192 | 15315 | 943 | 943 | 5.49% | 6.16% | 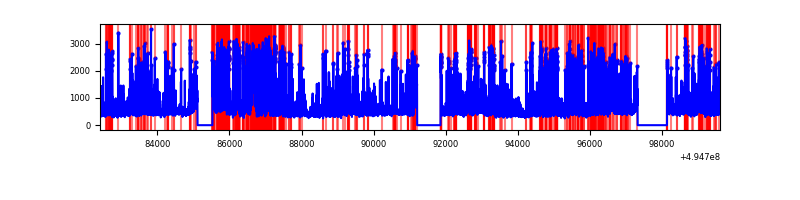 |
| D | 17191 | 15313 | 1854 | 1854 | 10.78% | 12.11% | 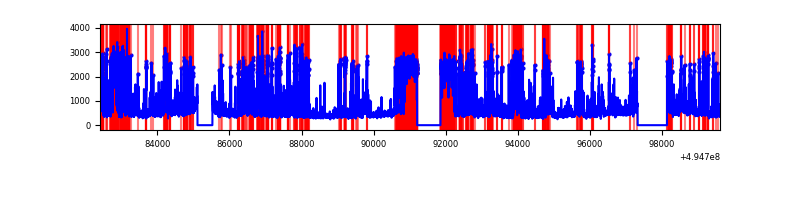 |
Top three noisy pixels from each quadrant. If the there are fewer than three noisy pixels in the level2.evt file, extra rows are filled as -1
| Pixel properties | Quadrant properties | ||||||
|---|---|---|---|---|---|---|---|
| Quadrant | DetID | PixID | Counts | Sigma | Mean | Median | Sigma |
| A | 3 | 63 | 35924289 | 336788.46 | 419 | 407 | 106.7 |
| A | 3 | 78 | 466484 | 4369.5 | 419 | 407 | 106.7 |
| A | 0 | 8 | 65666 | 611.81 | 419 | 407 | 106.7 |
| B | 6 | 255 | 556206 | 1656.88 | 1572 | 1511 | 334.8 |
| B | 7 | 0 | 473305 | 1409.25 | 1572 | 1511 | 334.8 |
| B | 5 | 185 | 359217 | 1068.47 | 1572 | 1511 | 334.8 |
| C | 15 | 224 | 3964368 | 9318.59 | 1526 | 1512 | 425.3 |
| C | 12 | 2 | 619241 | 1452.58 | 1526 | 1512 | 425.3 |
| C | 1 | 241 | 253535 | 592.63 | 1526 | 1512 | 425.3 |
| D | 1 | 241 | 5275007 | 12666.86 | 1454 | 1389 | 416.3 |
| D | 7 | 70 | 324576 | 776.27 | 1454 | 1389 | 416.3 |
| D | 2 | 172 | 261242 | 624.15 | 1454 | 1389 | 416.3 |
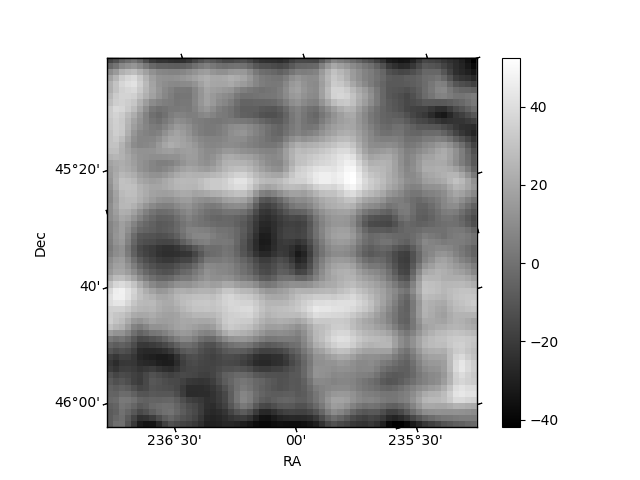
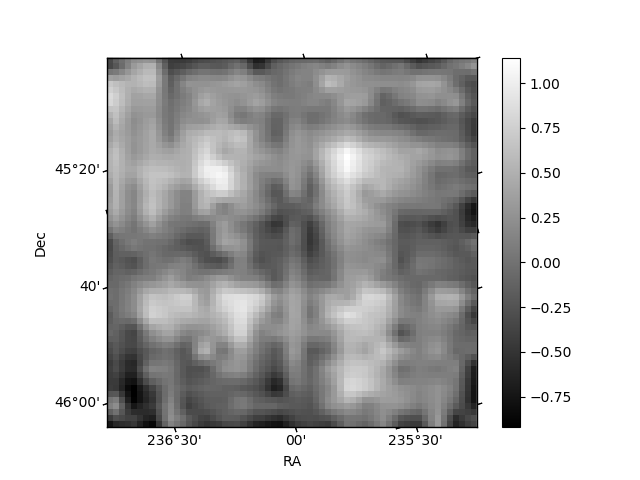
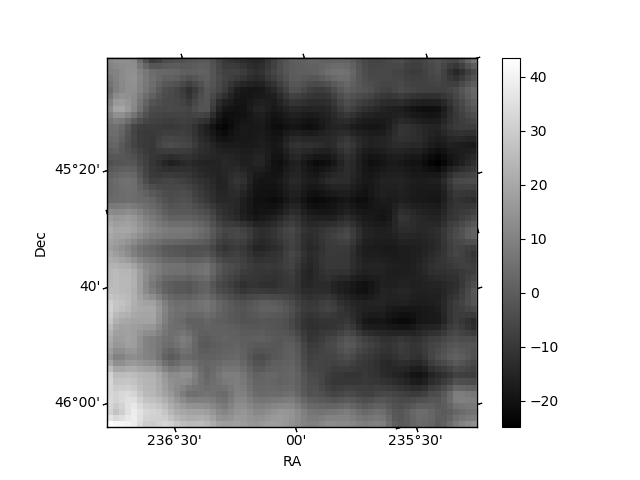
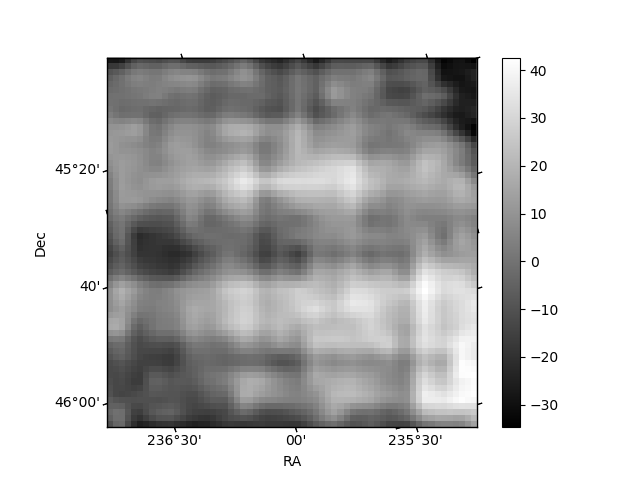
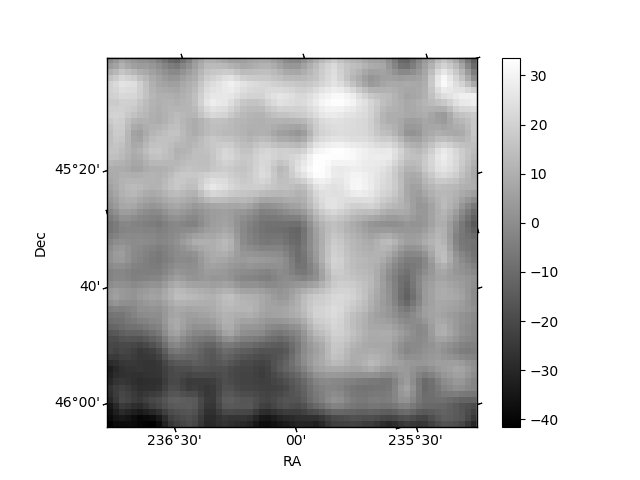
Histogram calculated using DETX and DETY for each event in the final _common_clean file
| Quadrant A | 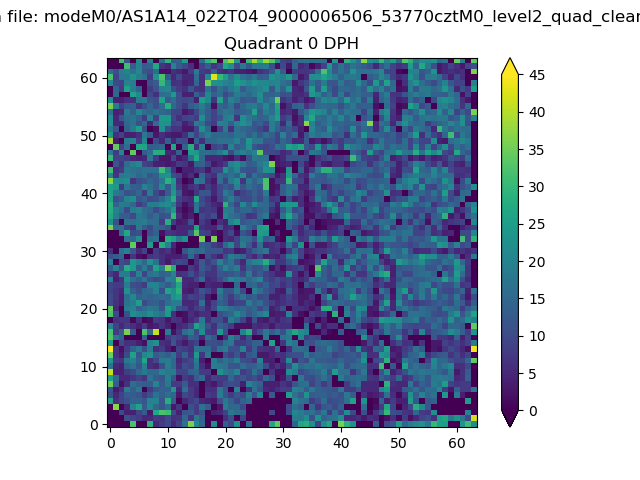 |
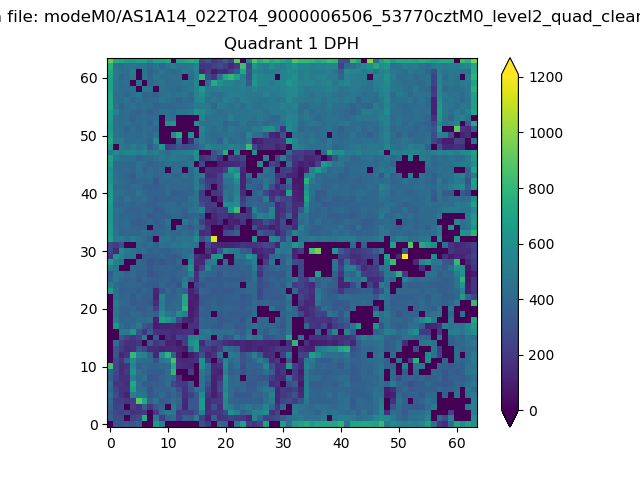 |
Quadrant B |
|---|---|---|---|
| Quadrant D | 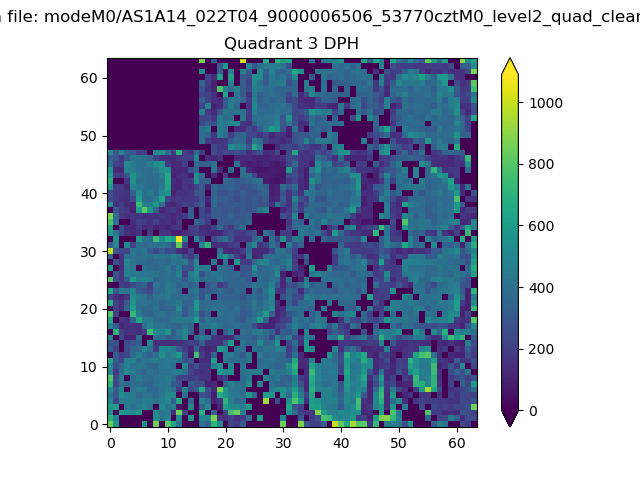 |
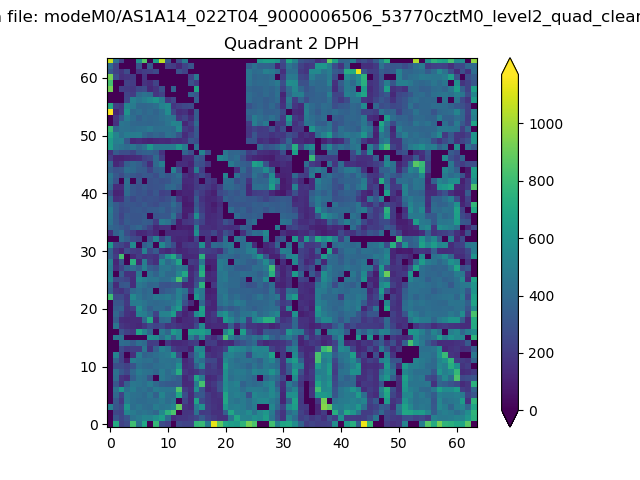 |
Quadrant C |
| Plot type | Count rate plots | Images |
|---|---|---|
| Comparison with Poisson distribution Blue bars denote a histogram of data divided into 1 sec bins. Red curve is a Poisson curve with rate = median count rate of data. |
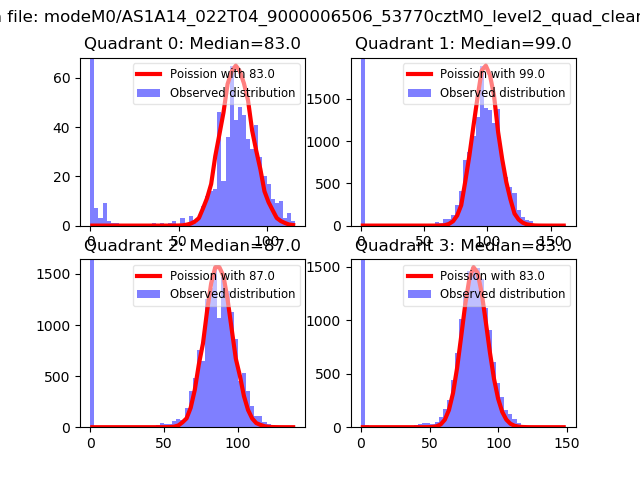 |
 |
| Quadrant-wise count rates Data is divided into 100 sec bins |
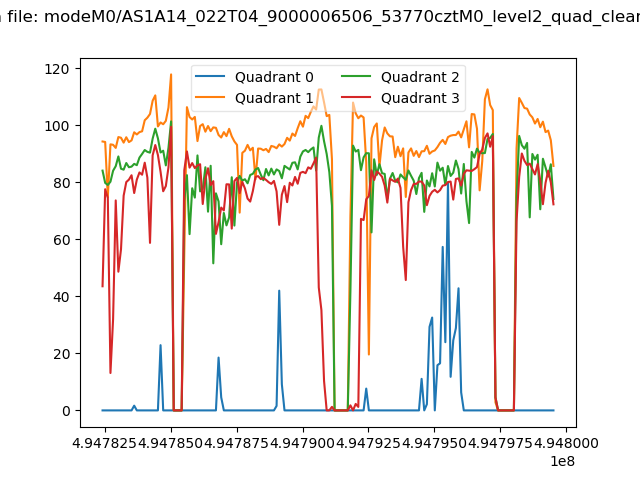 |
|
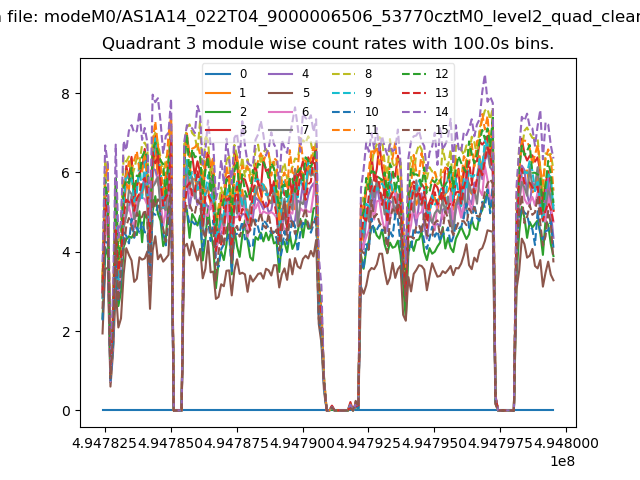
| Module-wise count rates for Quadrant A Data is divided into 100 sec bins |
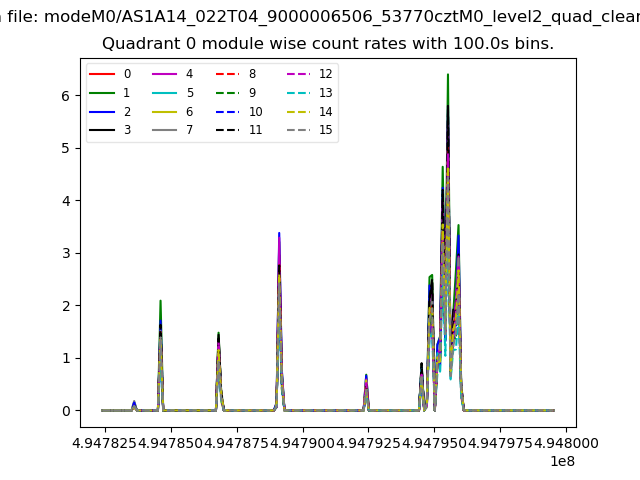 |
 |
| Module-wise count rates for Quadrant B Data is divided into 100 sec bins |
 |
 |
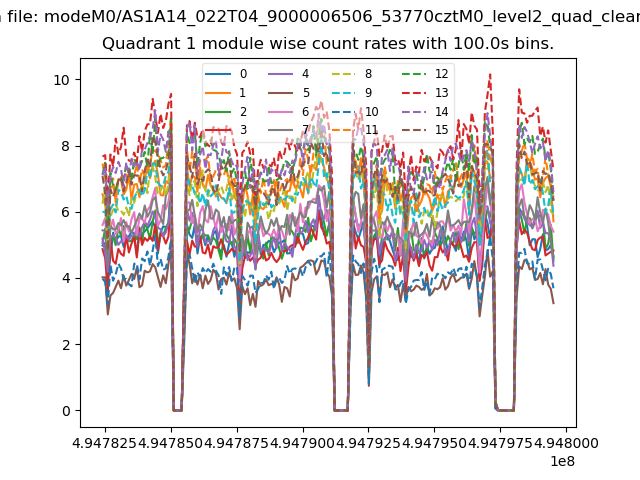
| Module-wise count rates for Quadrant C Data is divided into 100 sec bins |
 |
 |
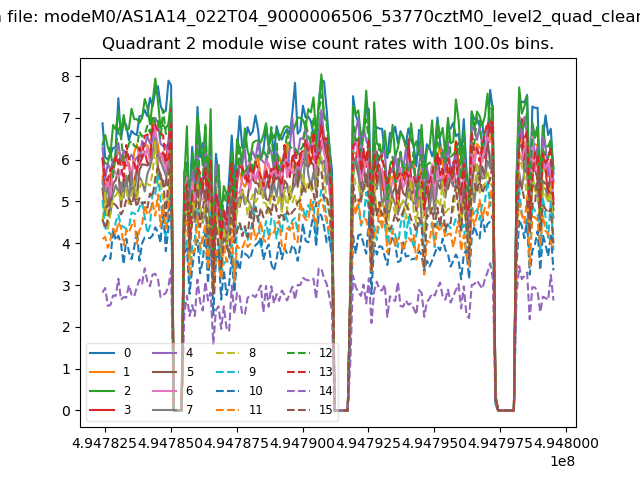
| Module-wise count rates for Quadrant D Data is divided into 100 sec bins |
 |
 |
| Parameter | Plot |
|---|---|
| CZT HV Monitor | 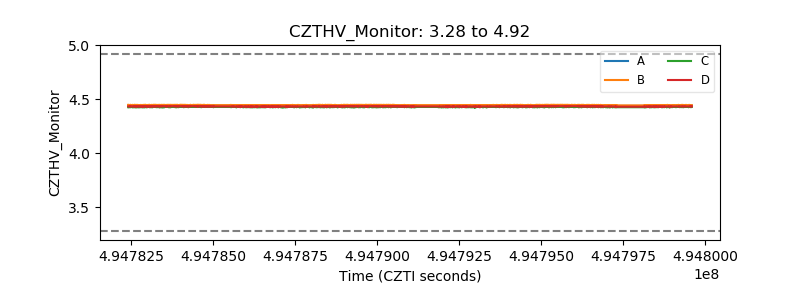 |
| D_VDD | 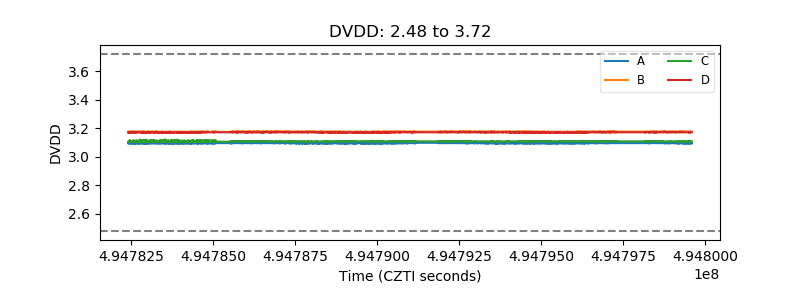 |
| Temperature 1 | 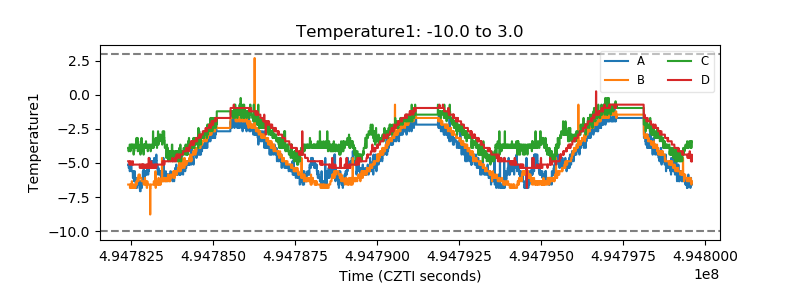 |
| Veto HV Monitor |  |
| Veto LLD | 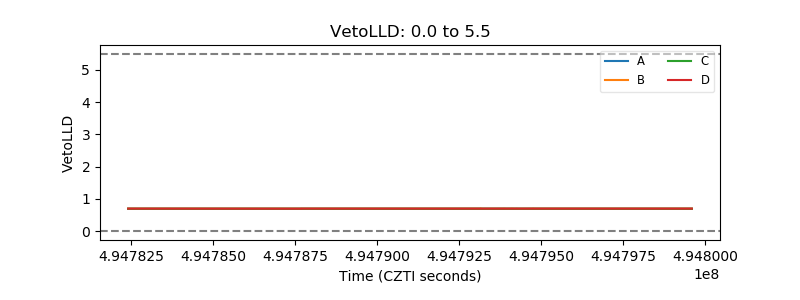 |
| Alpha Counter | 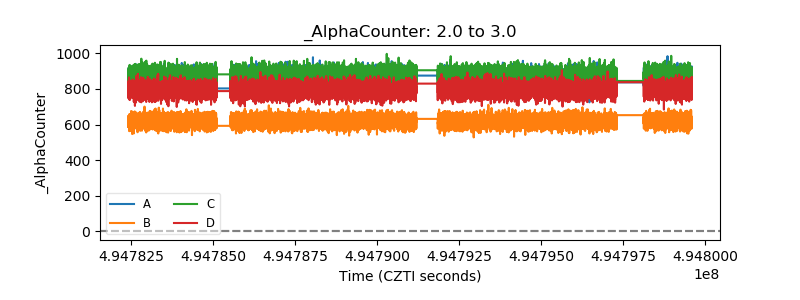 |
| _CPM_Rate | 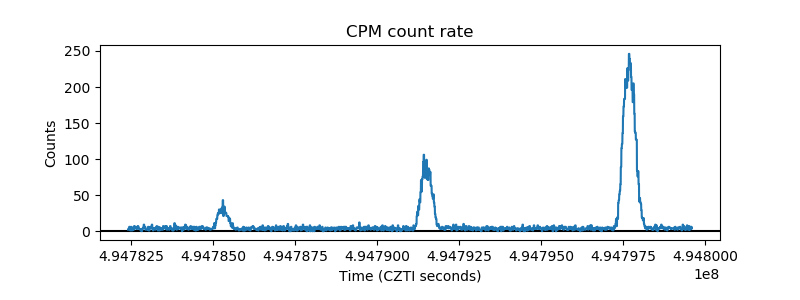 |
| CZT Counter | 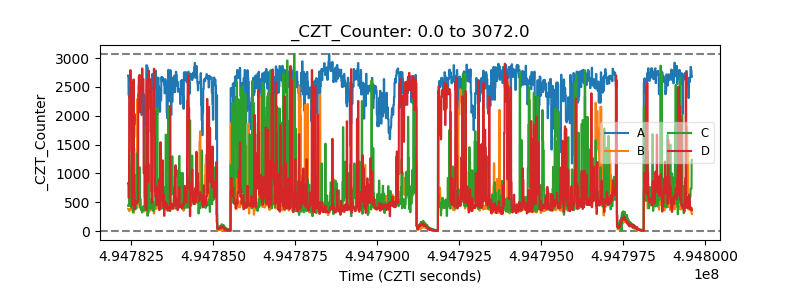 |
| +2.5 Volts monitor | 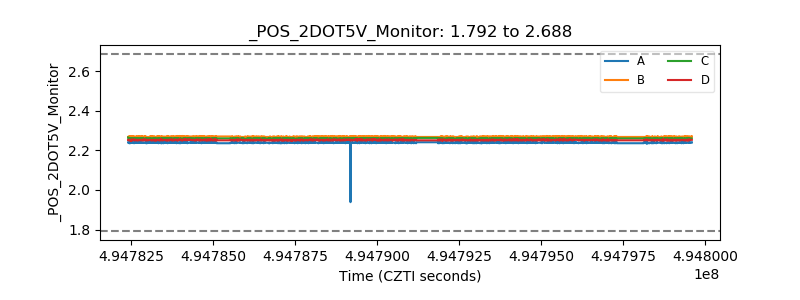 |
| +5 Volts monitor | 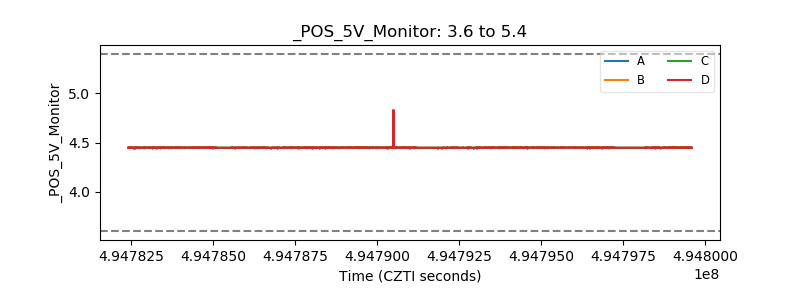 |
| _ROLL_ROT | 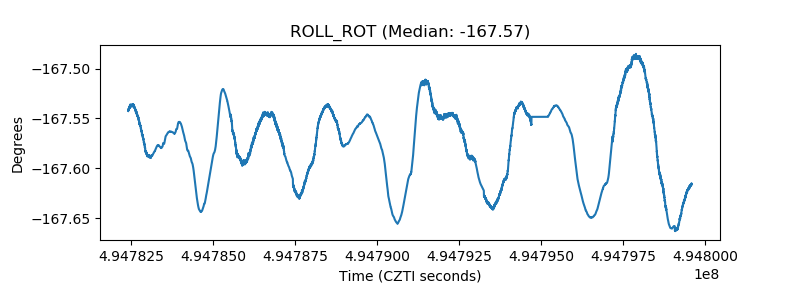 |
| _Roll_DEC | 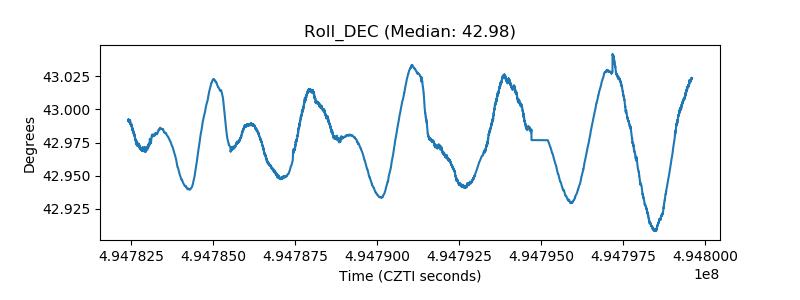 |
| _Roll_RA | 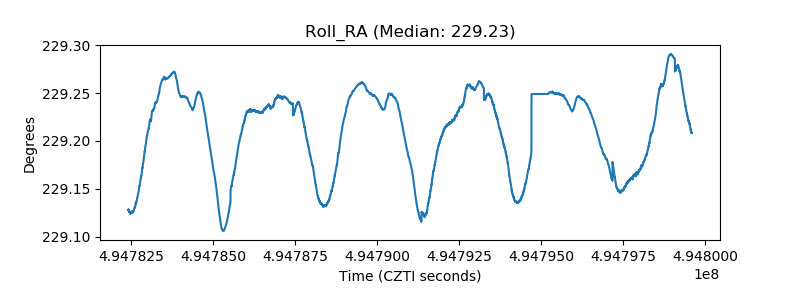 |
| Veto Counter | 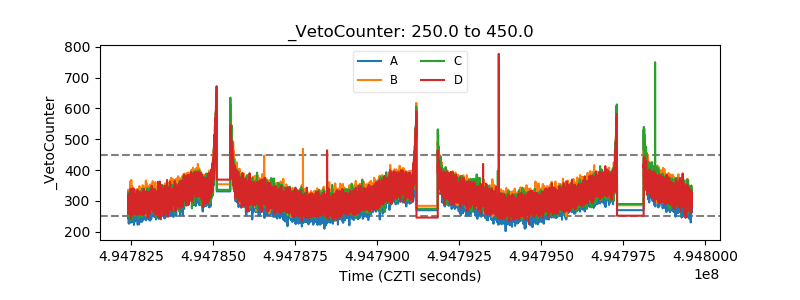 |