| Param | Original file | Final file |
|---|---|---|
| Filename | modeM0/AS1A14_022T04_9000006506_53771cztM0_level2.fits | modeM0/AS1A14_022T04_9000006506_53771cztM0_level2_quad_clean.evt |
| Size (bytes) | 863,922,240 | 78,307,200 |
| Size | 823.9 MB | 74.7 MB |
| Events in quadrant A | 17,820,974 | 29,978 |
| Events in quadrant B | 3,571,120 | 689,052 |
| Events in quadrant C | 6,041,849 | 585,099 |
| Events in quadrant D | 4,009,258 | 585,165 |
| Mode M0 | |||
|---|---|---|---|
| Quadrant | BADHDUFLAG | Total packets | Discarded packets |
| A | 0 | 57725 | 2 |
| B | 0 | 15724 | 2 |
| C | 0 | 22791 | 2 |
| D | 0 | 17017 | 2 |
| Mode SS | |||
|---|---|---|---|
| Quadrant | BADHDUFLAG | Total packets | Discarded packets |
| A | 0 | 140 | 0 |
| B | 0 | 140 | 0 |
| C | 0 | 140 | 0 |
| D | 0 | 140 | 0 |
| Mode M9 | |||
|---|---|---|---|
| Quadrant | BADHDUFLAG | Total packets | Discarded packets |
| A | 0 | 13 | 0 |
| B | 0 | 14 | 0 |
| C | 0 | 14 | 0 |
| D | 0 | 14 | 0 |
| Quadrant | Total seconds | Saturated seconds | Saturation percentage |
|---|---|---|---|
| A | 6912 | 6648 | 96.180556% |
| B | 6912 | 106 | 1.533565% |
| C | 6912 | 590 | 8.535880% |
| D | 6912 | 138 | 1.996528% |
Noise dominated data is calculated using 1-second bins in cleaned event files. If a bin has >2000 counts, and if more than 50% of those come from <1% of pixels, then it is considered to be noise-dominated and hence unusable.
| Quadrant | # 1 sec bins | Bins with >0 counts | Bins with >2000 counts | High rate bins dominated by noise | Noise dominated (total time) | Noise dominated (detector-on time) | Marked lightcurve |
|---|---|---|---|---|---|---|---|
| A | 7876 | 6911 | 6614 | 6614 | 83.98% | 95.70% | 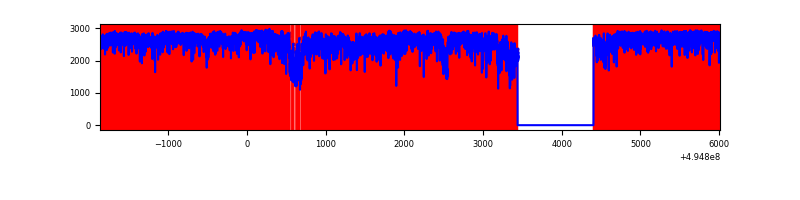 |
| B | 7877 | 6912 | 54 | 54 | 0.69% | 0.78% | 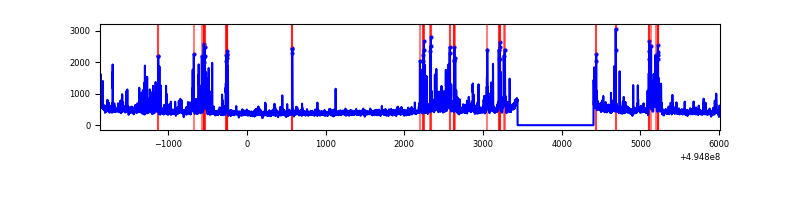 |
| C | 7876 | 6911 | 567 | 567 | 7.20% | 8.20% | 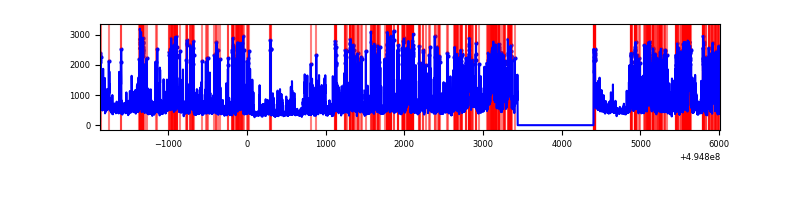 |
| D | 7877 | 6913 | 130 | 130 | 1.65% | 1.88% | 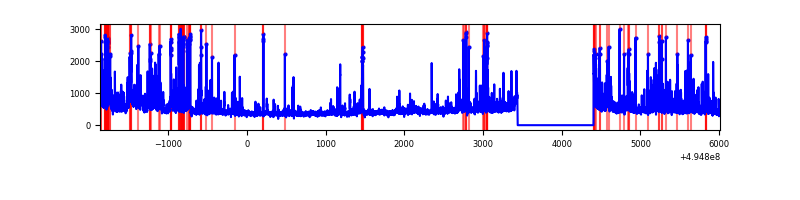 |
Top three noisy pixels from each quadrant. If the there are fewer than three noisy pixels in the level2.evt file, extra rows are filled as -1
| Pixel properties | Quadrant properties | ||||||
|---|---|---|---|---|---|---|---|
| Quadrant | DetID | PixID | Counts | Sigma | Mean | Median | Sigma |
| A | 3 | 63 | 16249145 | 220915.09 | 290 | 282 | 73.6 |
| A | 4 | 249 | 175873 | 2387.29 | 290 | 282 | 73.6 |
| A | 8 | 6 | 110386 | 1496.94 | 290 | 282 | 73.6 |
| B | 5 | 185 | 234803 | 1536.32 | 713 | 689 | 152.4 |
| B | 0 | 213 | 106279 | 692.91 | 713 | 689 | 152.4 |
| B | 4 | 81 | 101081 | 658.8 | 713 | 689 | 152.4 |
| C | 15 | 224 | 2815748 | 14889.96 | 681 | 675 | 189.1 |
| C | 12 | 2 | 83780 | 439.57 | 681 | 675 | 189.1 |
| C | 12 | 252 | 81277 | 426.33 | 681 | 675 | 189.1 |
| D | 1 | 241 | 383255 | 1935.73 | 698 | 669 | 197.6 |
| D | 3 | 12 | 166434 | 838.7 | 698 | 669 | 197.6 |
| D | 13 | 153 | 163286 | 822.78 | 698 | 669 | 197.6 |
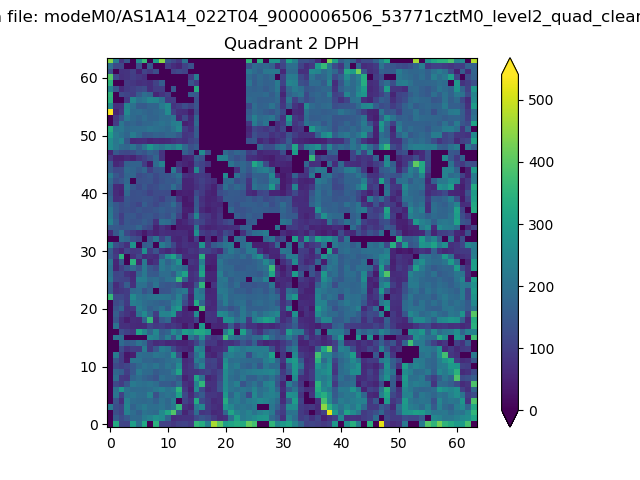
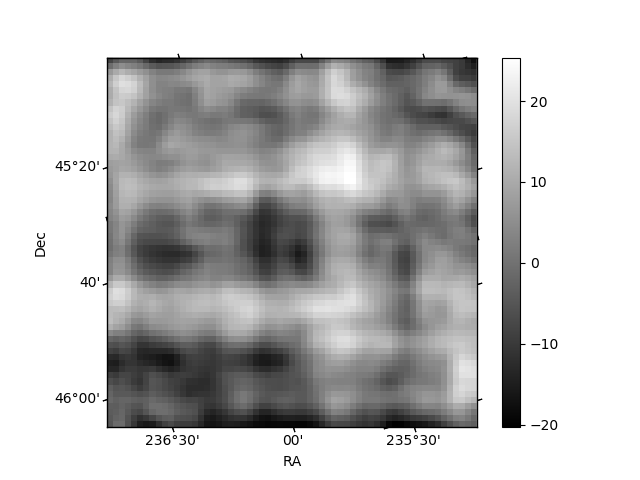
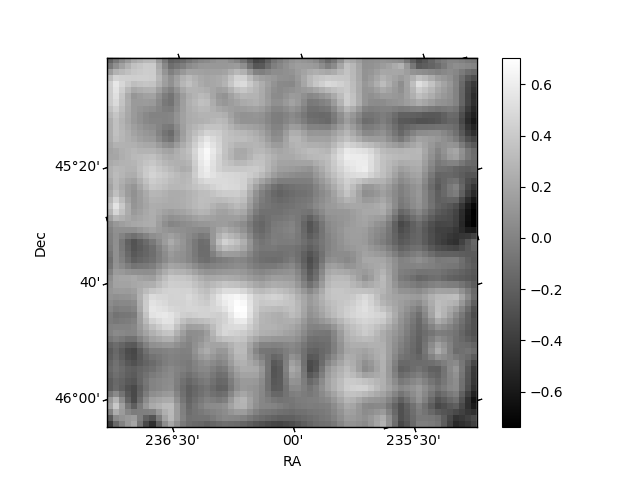
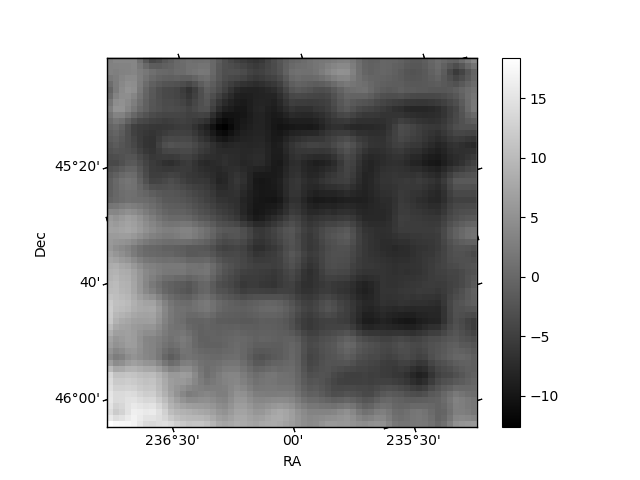
Histogram calculated using DETX and DETY for each event in the final _common_clean file
| Quadrant A | 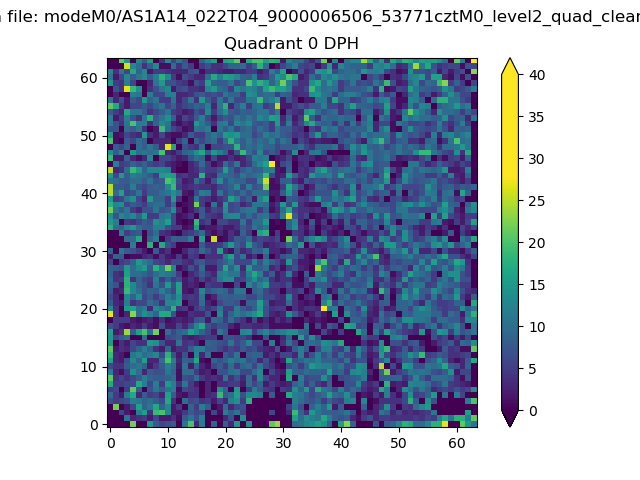 |
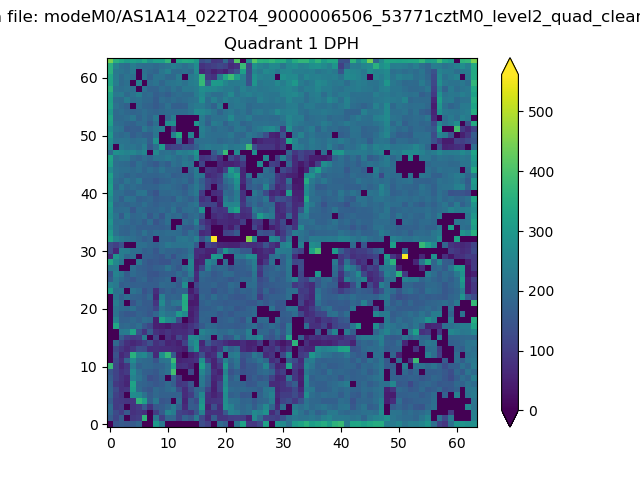 |
Quadrant B |
|---|---|---|---|
| Quadrant D | 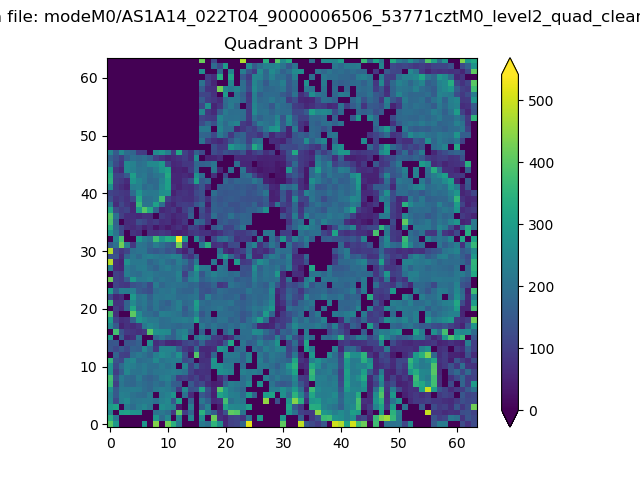 |
 |
Quadrant C |
| Plot type | Count rate plots | Images |
|---|---|---|
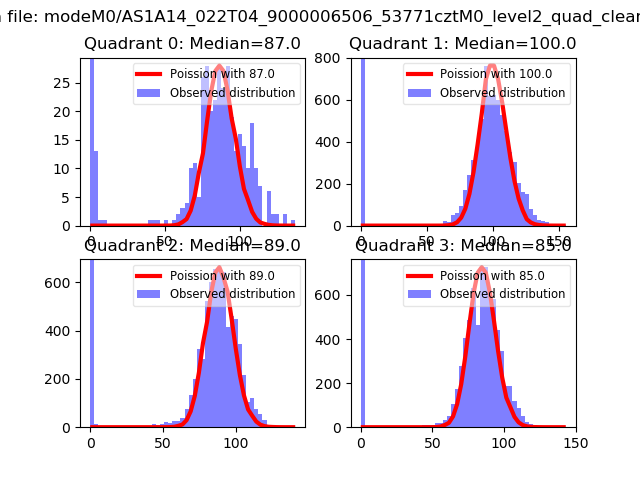
| Comparison with Poisson distribution Blue bars denote a histogram of data divided into 1 sec bins. Red curve is a Poisson curve with rate = median count rate of data. |
 |
 |
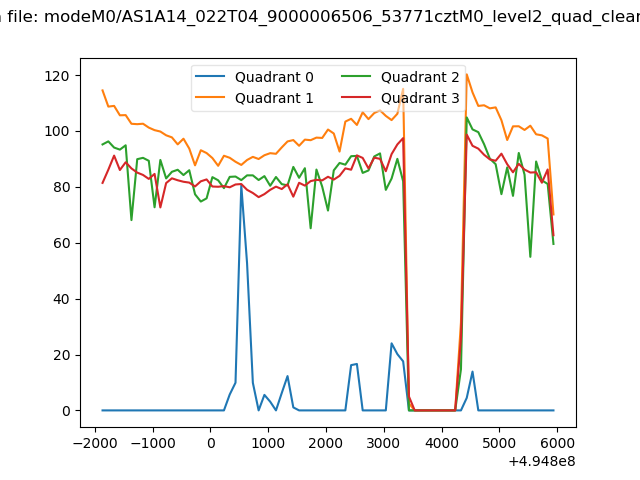
| Quadrant-wise count rates Data is divided into 100 sec bins |
 |
|
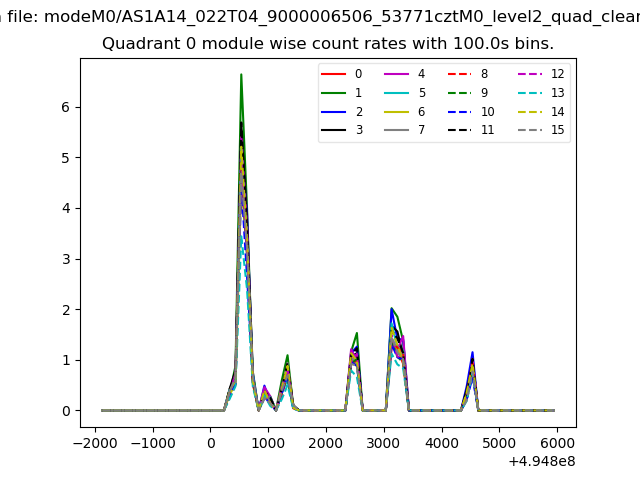
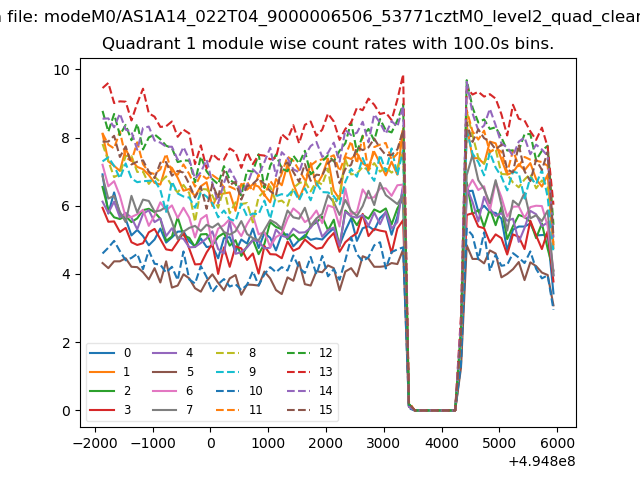
| Module-wise count rates for Quadrant A Data is divided into 100 sec bins |
 |
 |
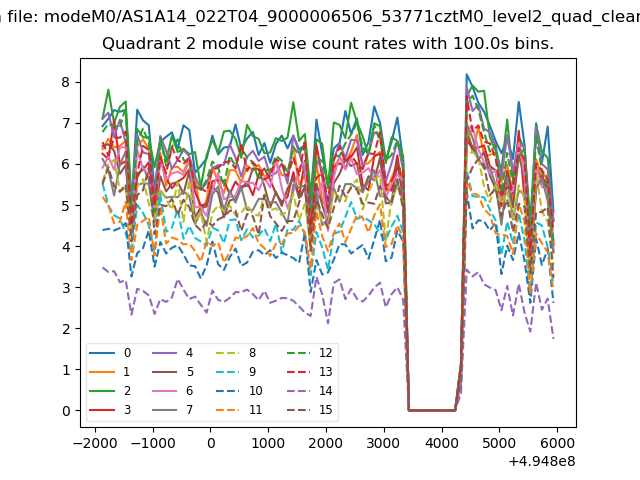
| Module-wise count rates for Quadrant B Data is divided into 100 sec bins |
 |
 |
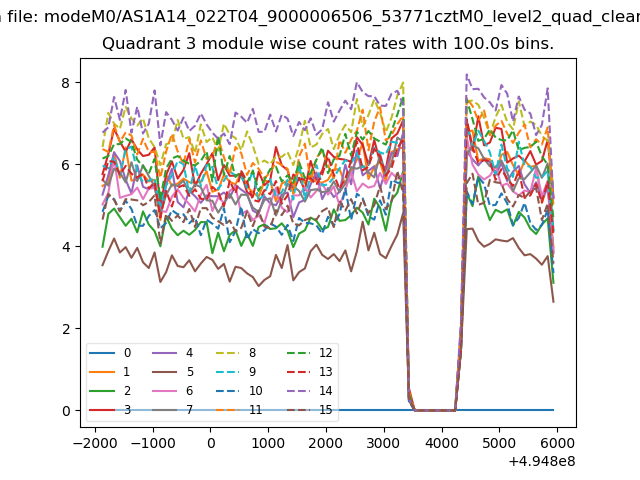
| Module-wise count rates for Quadrant C Data is divided into 100 sec bins |
 |
 |
| Module-wise count rates for Quadrant D Data is divided into 100 sec bins |
 |
 |
| Parameter | Plot |
|---|---|
| CZT HV Monitor | 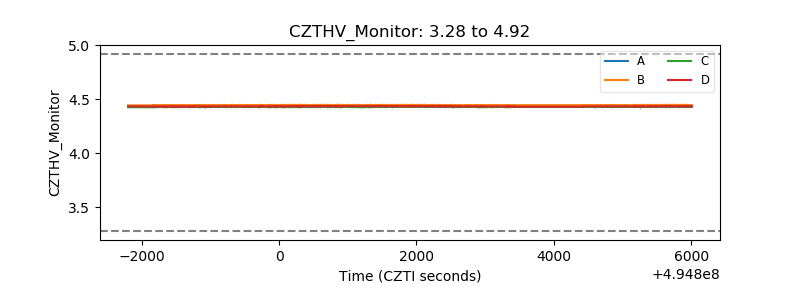 |
| D_VDD | 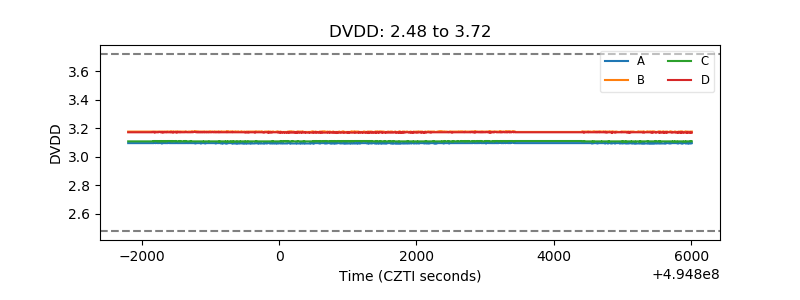 |
| Temperature 1 | 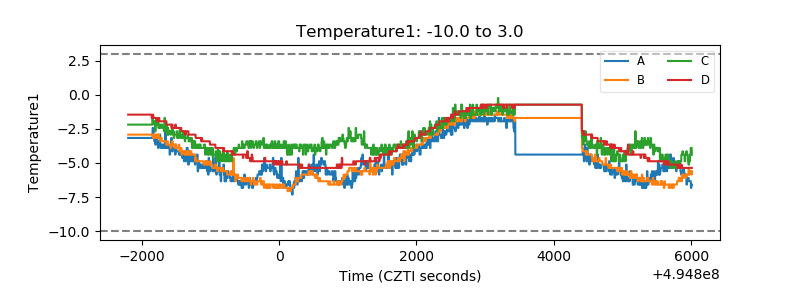 |
| Veto HV Monitor | 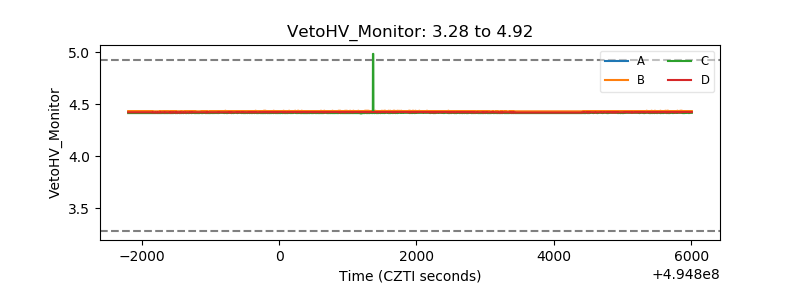 |
| Veto LLD | 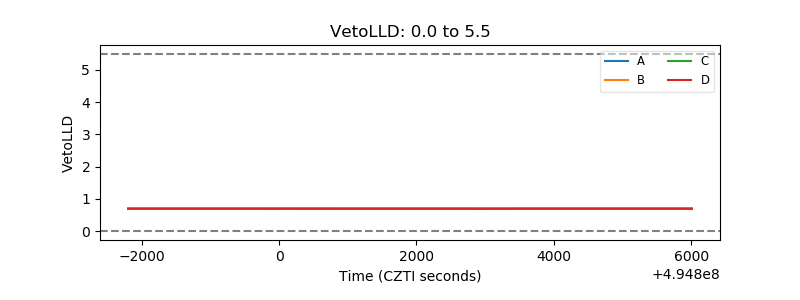 |
| Alpha Counter | 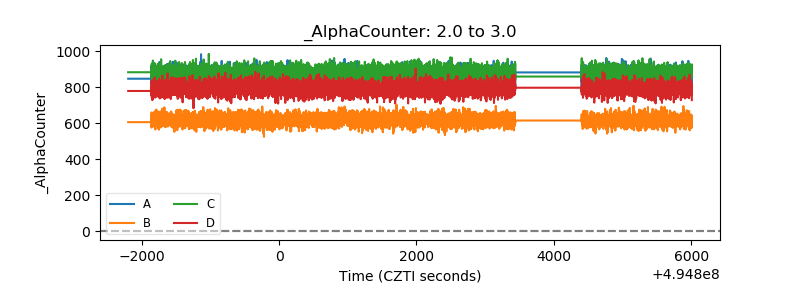 |
| _CPM_Rate | 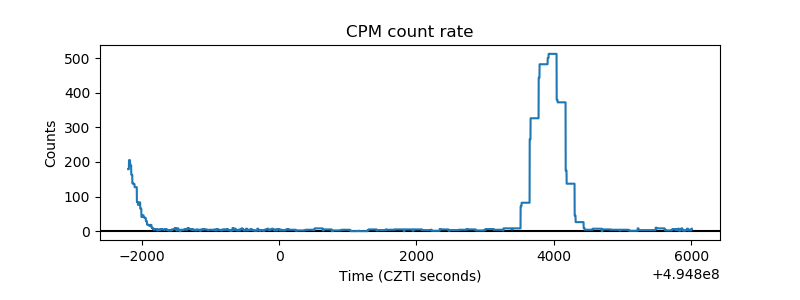 |
| CZT Counter | 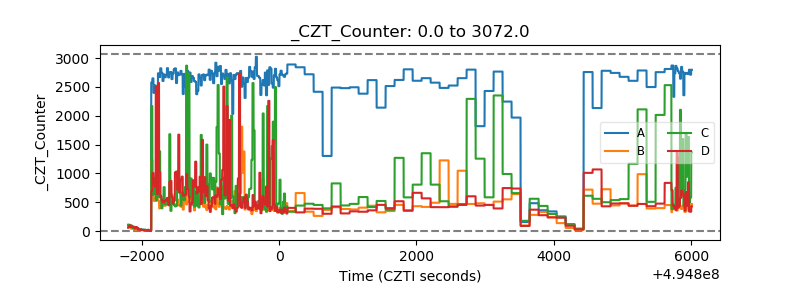 |
| +2.5 Volts monitor |  |
| +5 Volts monitor | 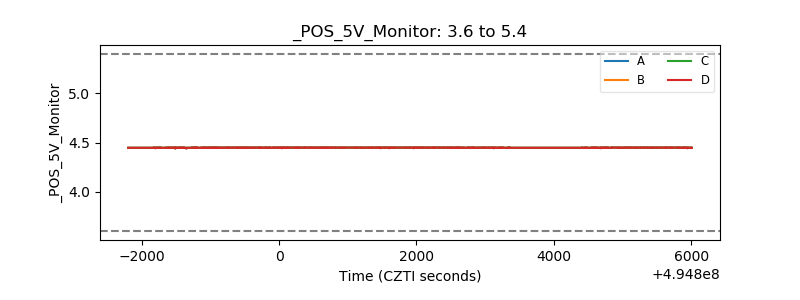 |
| _ROLL_ROT | 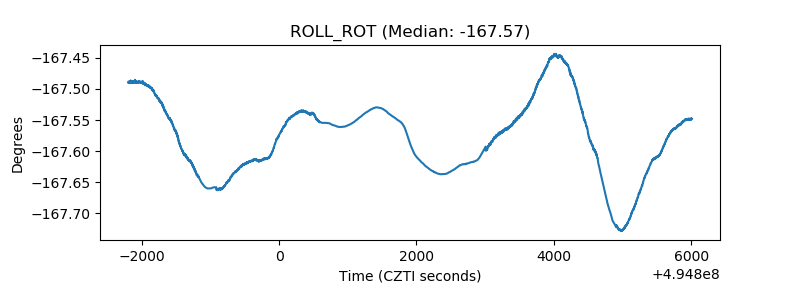 |
| _Roll_DEC | 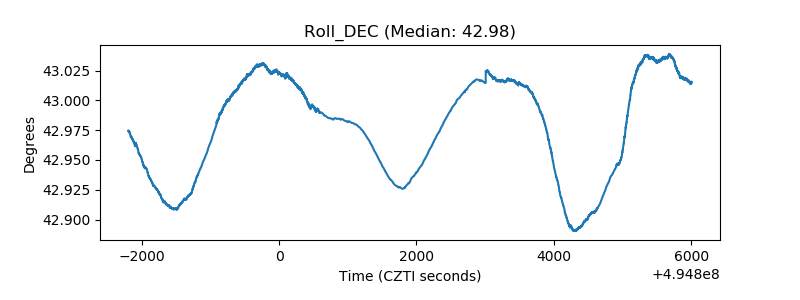 |
| _Roll_RA | 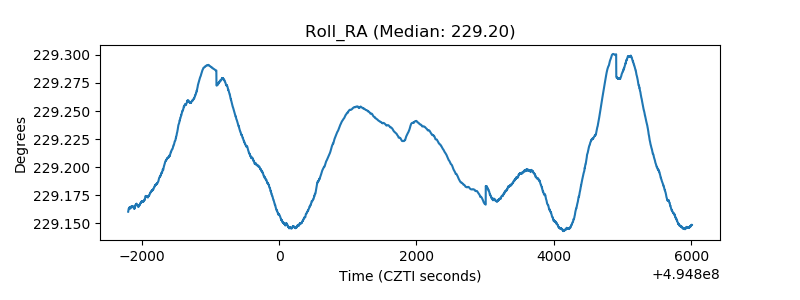 |
| Veto Counter | 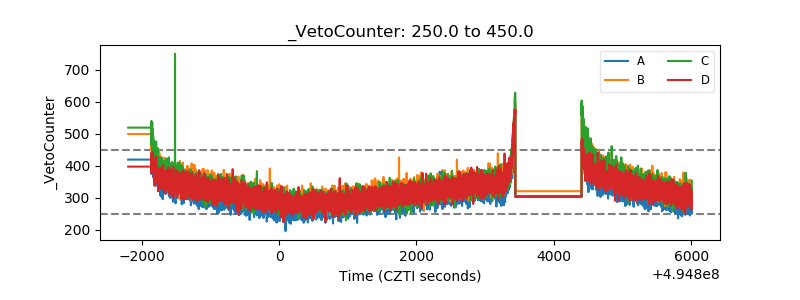 |