| Param | Original file | Final file |
|---|---|---|
| Filename | modeM0/AS1A14_022T04_9000006506_53773cztM0_level2.fits | modeM0/AS1A14_022T04_9000006506_53773cztM0_level2_quad_clean.evt |
| Size (bytes) | 822,695,040 | 80,824,320 |
| Size | 784.6 MB | 77.1 MB |
| Events in quadrant A | 16,134,896 | 116,203 |
| Events in quadrant B | 3,775,508 | 687,692 |
| Events in quadrant C | 5,802,991 | 583,723 |
| Events in quadrant D | 4,213,525 | 586,744 |
| Mode M0 | |||
|---|---|---|---|
| Quadrant | BADHDUFLAG | Total packets | Discarded packets |
| A | 0 | 52613 | 9 |
| B | 0 | 16088 | 2 |
| C | 0 | 21932 | 2 |
| D | 0 | 17341 | 2 |
| Mode SS | |||
|---|---|---|---|
| Quadrant | BADHDUFLAG | Total packets | Discarded packets |
| A | 0 | 136 | 0 |
| B | 0 | 136 | 0 |
| C | 0 | 136 | 0 |
| D | 0 | 136 | 0 |
| Mode M9 | |||
|---|---|---|---|
| Quadrant | BADHDUFLAG | Total packets | Discarded packets |
| A | 0 | 14 | 0 |
| B | 0 | 15 | 0 |
| C | 0 | 15 | 0 |
| D | 0 | 15 | 0 |
| Quadrant | Total seconds | Saturated seconds | Saturation percentage |
|---|---|---|---|
| A | 6789 | 5661 | 83.384887% |
| B | 6789 | 155 | 2.283105% |
| C | 6789 | 580 | 8.543232% |
| D | 6789 | 161 | 2.371483% |
Noise dominated data is calculated using 1-second bins in cleaned event files. If a bin has >2000 counts, and if more than 50% of those come from <1% of pixels, then it is considered to be noise-dominated and hence unusable.
| Quadrant | # 1 sec bins | Bins with >0 counts | Bins with >2000 counts | High rate bins dominated by noise | Noise dominated (total time) | Noise dominated (detector-on time) | Marked lightcurve |
|---|---|---|---|---|---|---|---|
| A | 7863 | 6788 | 5682 | 5682 | 72.26% | 83.71% | 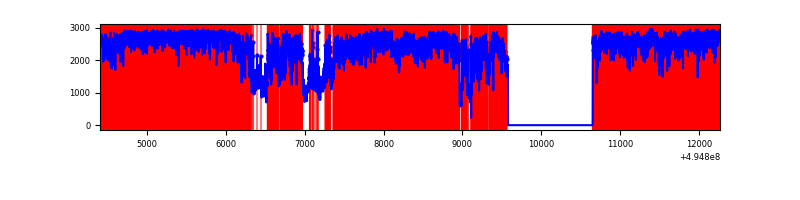 |
| B | 7864 | 6789 | 79 | 79 | 1.00% | 1.16% | 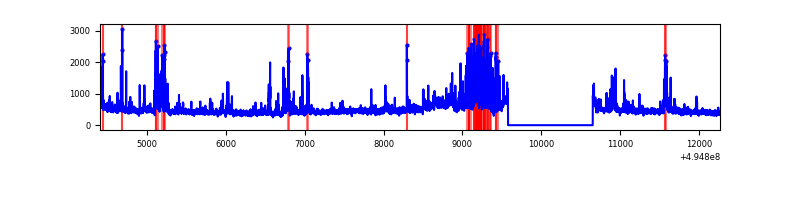 |
| C | 7864 | 6789 | 562 | 562 | 7.15% | 8.28% | 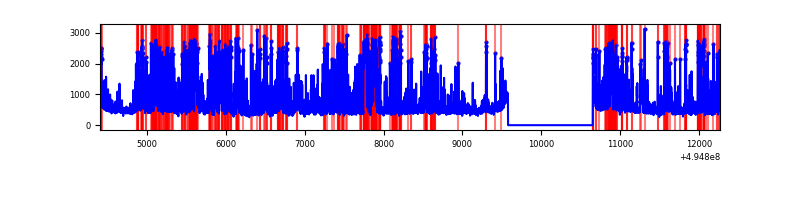 |
| D | 7864 | 6789 | 139 | 139 | 1.77% | 2.05% | 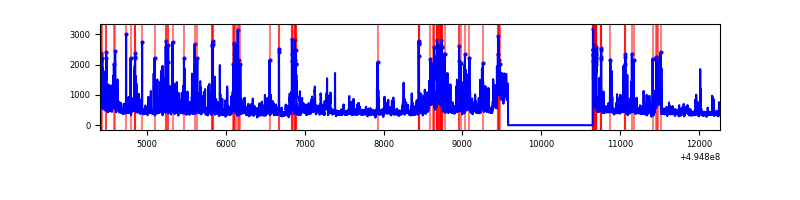 |
Top three noisy pixels from each quadrant. If the there are fewer than three noisy pixels in the level2.evt file, extra rows are filled as -1
| Pixel properties | Quadrant properties | ||||||
|---|---|---|---|---|---|---|---|
| Quadrant | DetID | PixID | Counts | Sigma | Mean | Median | Sigma |
| A | 3 | 63 | 13999963 | 128747.52 | 427 | 415 | 108.7 |
| A | 4 | 249 | 274355 | 2519.3 | 427 | 415 | 108.7 |
| A | 5 | 241 | 64100 | 585.68 | 427 | 415 | 108.7 |
| B | 6 | 255 | 391251 | 2567.94 | 712 | 688 | 152.1 |
| B | 5 | 185 | 177124 | 1160.06 | 712 | 688 | 152.1 |
| B | 7 | 0 | 175186 | 1147.32 | 712 | 688 | 152.1 |
| C | 15 | 224 | 2601301 | 13751.21 | 683 | 677 | 189.1 |
| C | 15 | 208 | 90312 | 473.96 | 683 | 677 | 189.1 |
| C | 1 | 3 | 80248 | 420.74 | 683 | 677 | 189.1 |
| D | 1 | 241 | 666986 | 3422.46 | 691 | 660 | 194.7 |
| D | 3 | 224 | 169602 | 867.74 | 691 | 660 | 194.7 |
| D | 3 | 12 | 128113 | 654.64 | 691 | 660 | 194.7 |
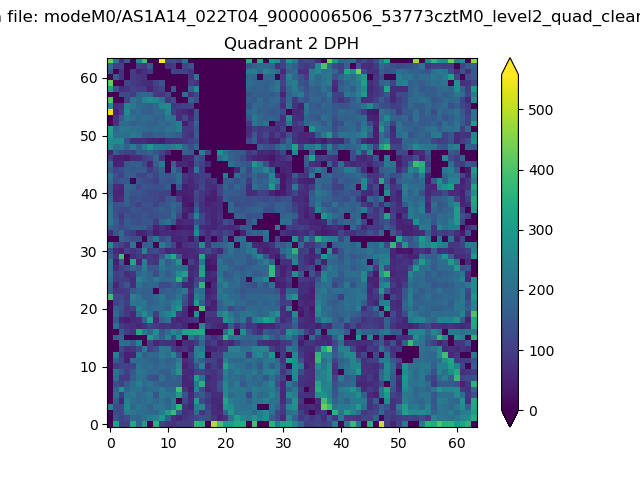
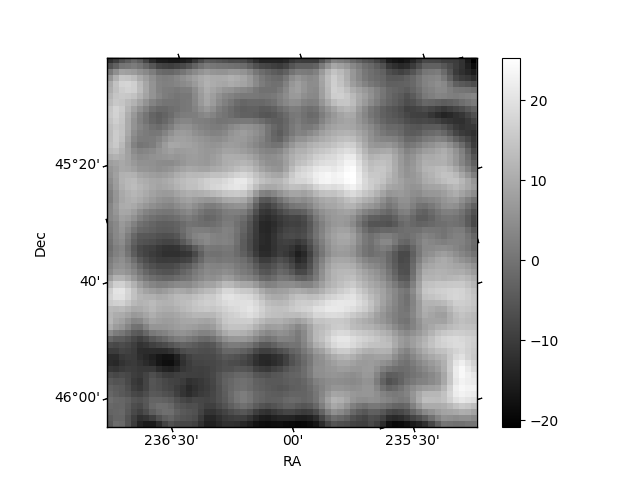
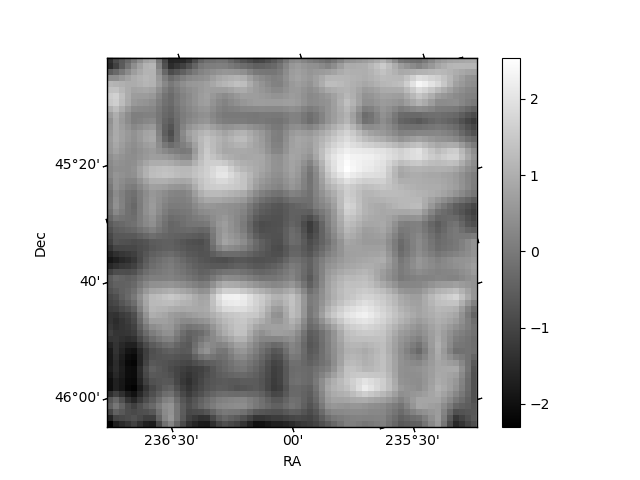
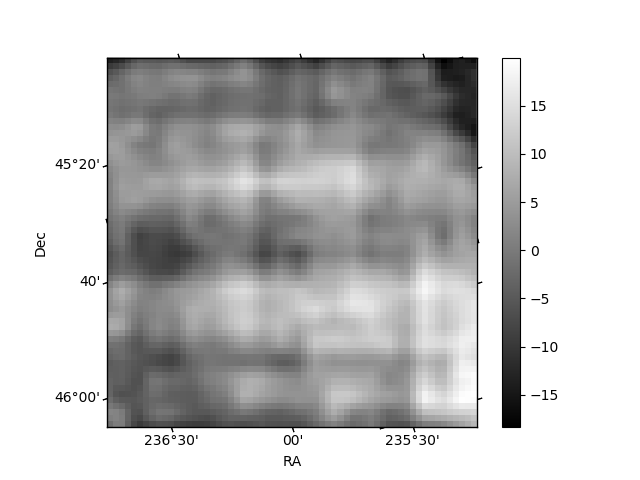
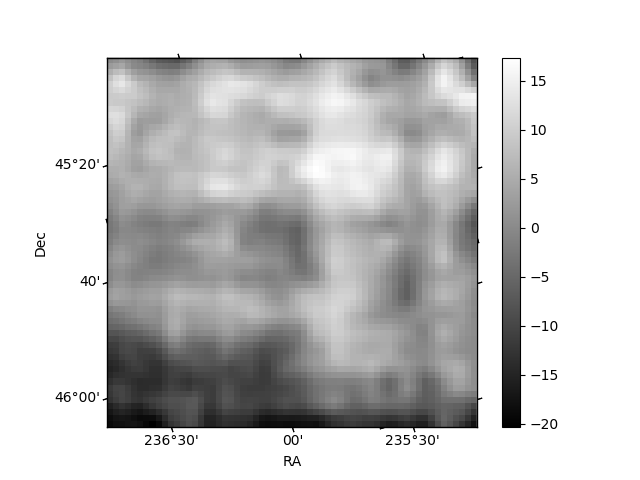
Histogram calculated using DETX and DETY for each event in the final _common_clean file
| Quadrant A | 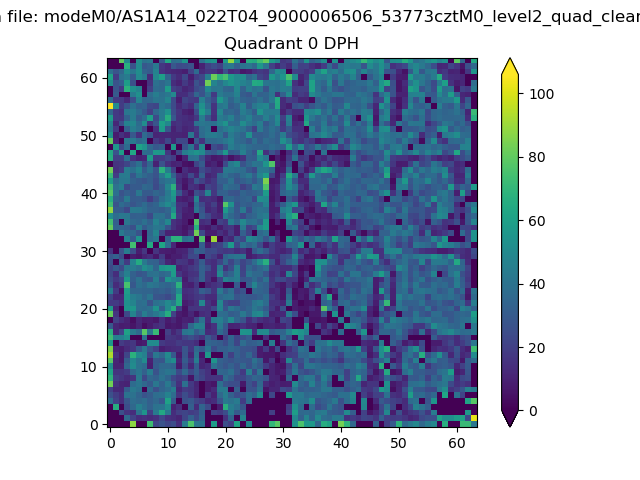 |
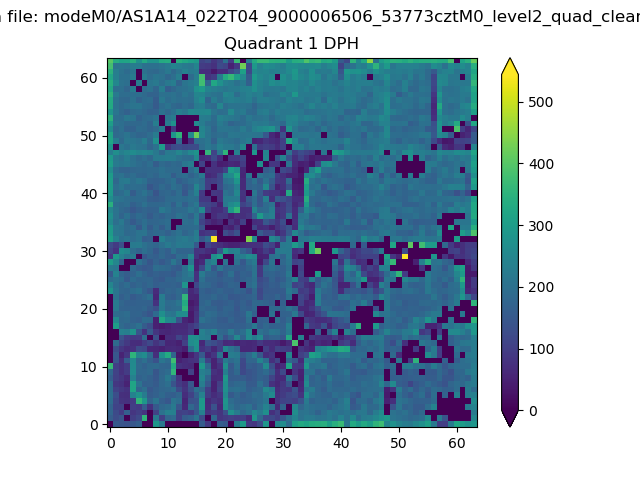 |
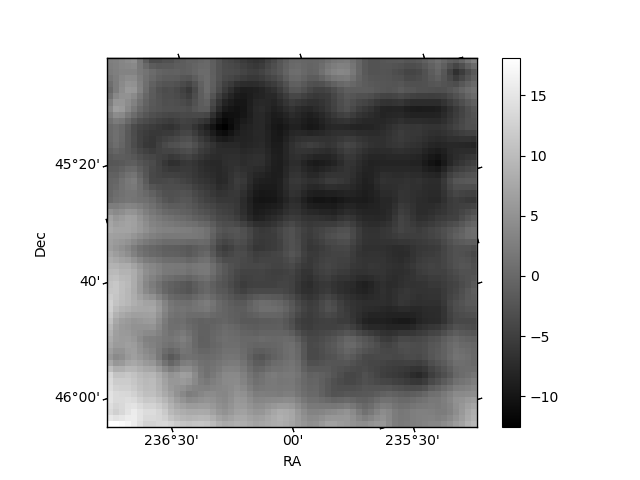
Quadrant B |
|---|---|---|---|
| Quadrant D | 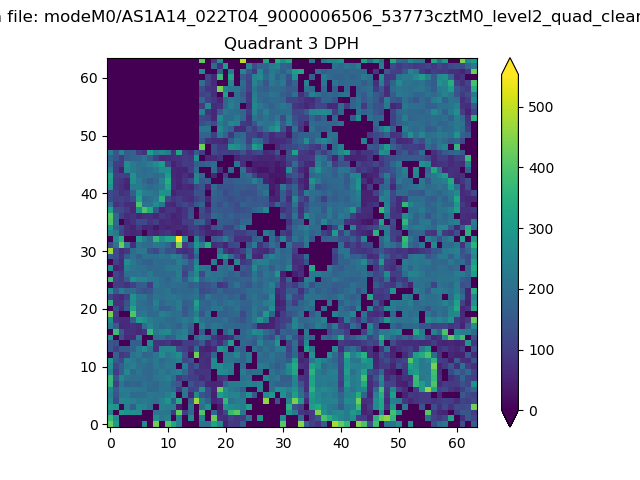 |
 |
Quadrant C |
| Plot type | Count rate plots | Images |
|---|---|---|
| Comparison with Poisson distribution Blue bars denote a histogram of data divided into 1 sec bins. Red curve is a Poisson curve with rate = median count rate of data. |
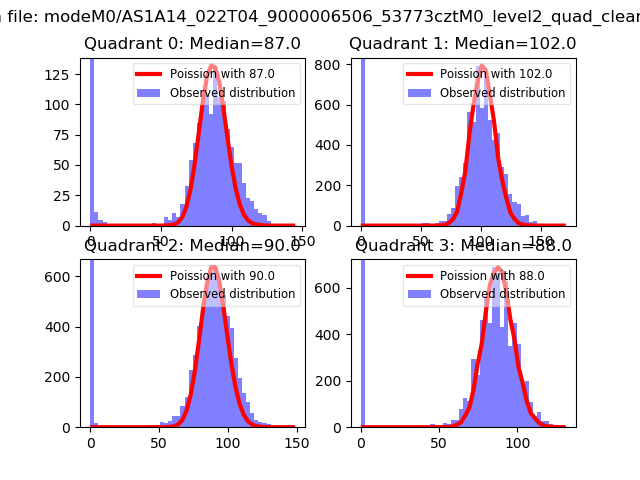 |
 |
| Quadrant-wise count rates Data is divided into 100 sec bins |
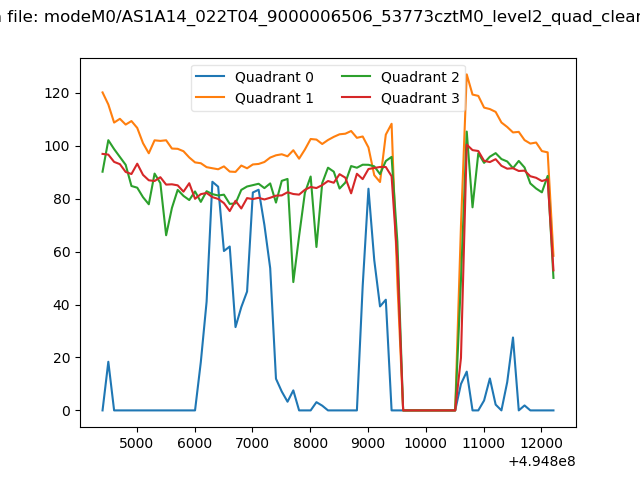 |
|
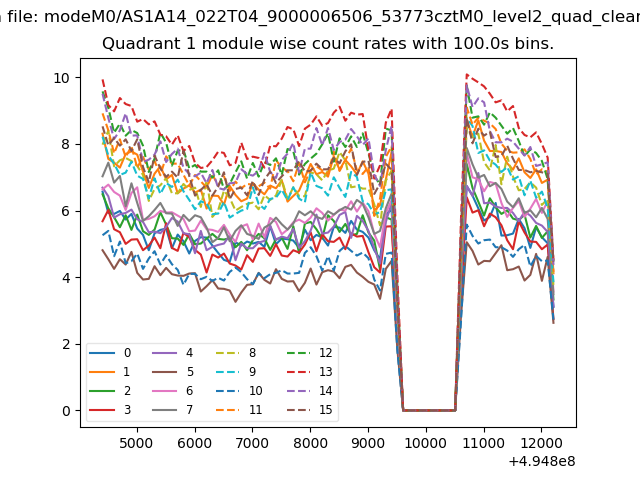
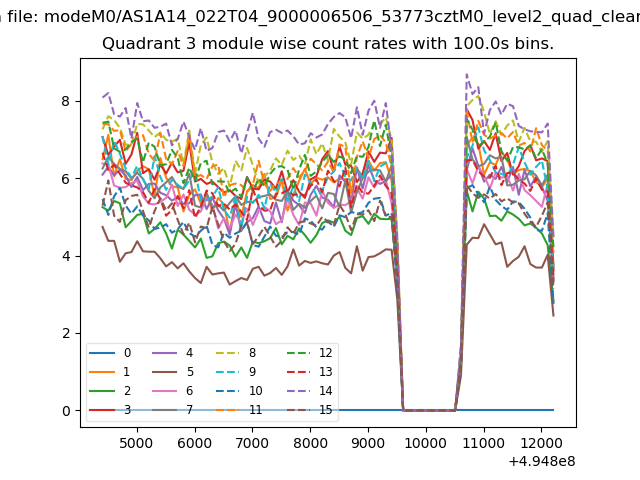
| Module-wise count rates for Quadrant A Data is divided into 100 sec bins |
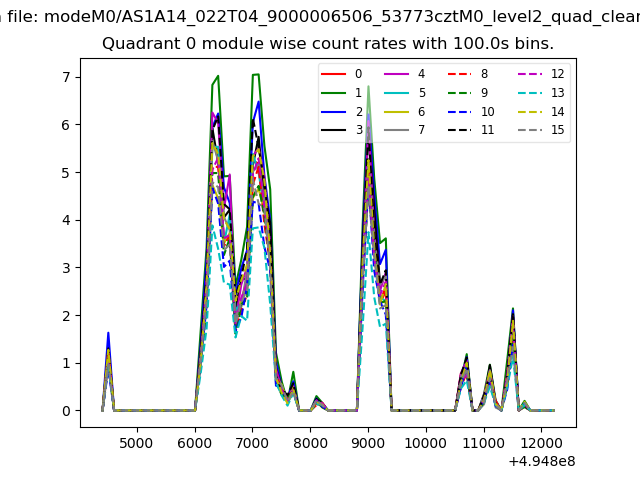 |
 |
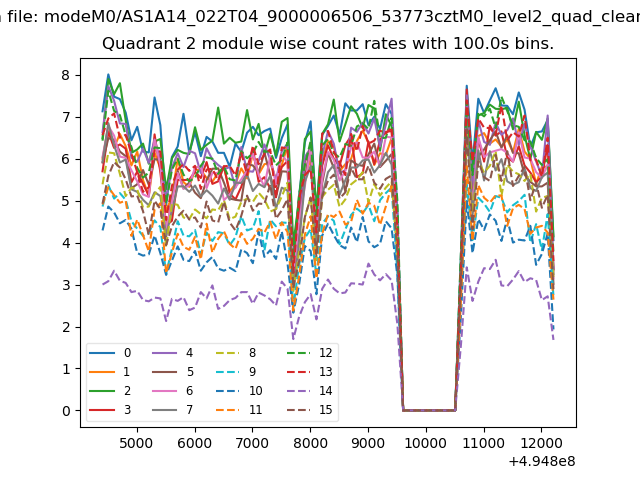
| Module-wise count rates for Quadrant B Data is divided into 100 sec bins |
 |
 |
| Module-wise count rates for Quadrant C Data is divided into 100 sec bins |
 |
 |
| Module-wise count rates for Quadrant D Data is divided into 100 sec bins |
 |
 |
| Parameter | Plot |
|---|---|
| CZT HV Monitor | 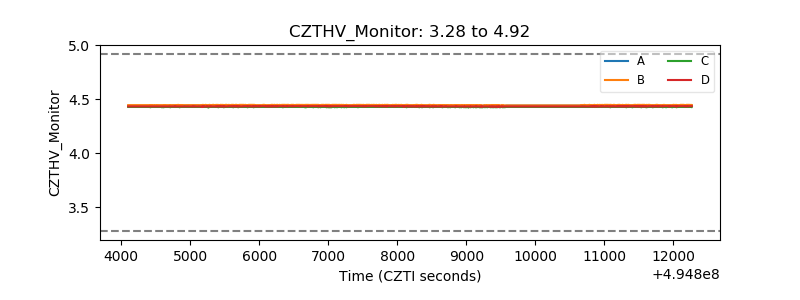 |
| D_VDD | 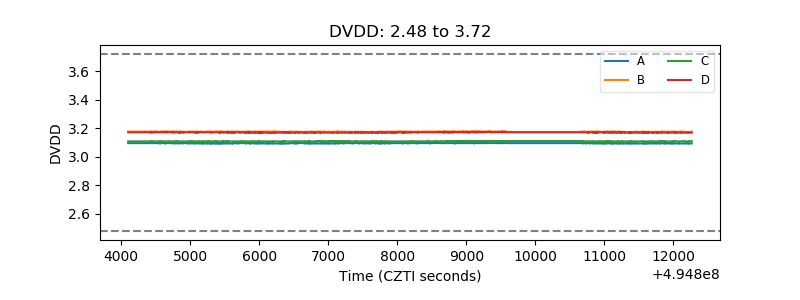 |
| Temperature 1 | 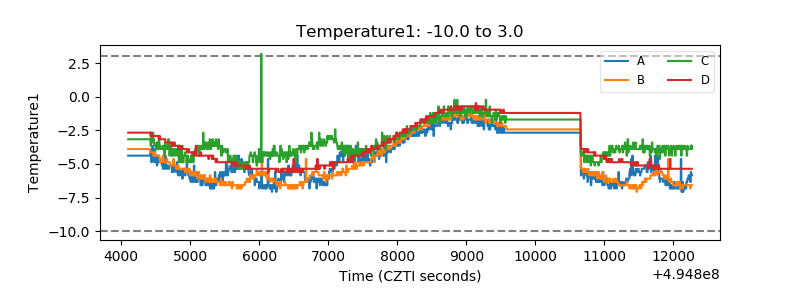 |
| Veto HV Monitor | 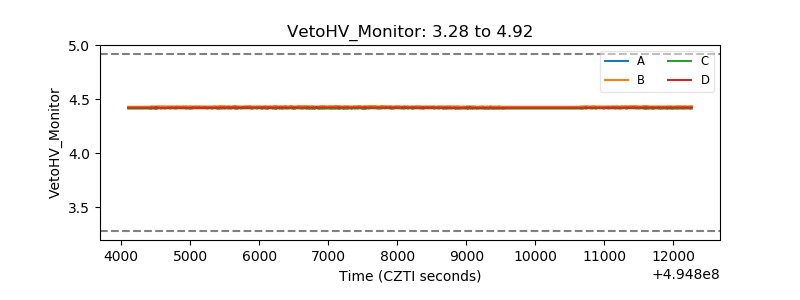 |
| Veto LLD | 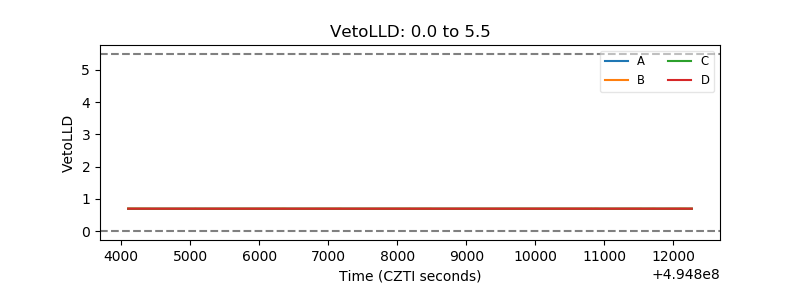 |
| Alpha Counter | 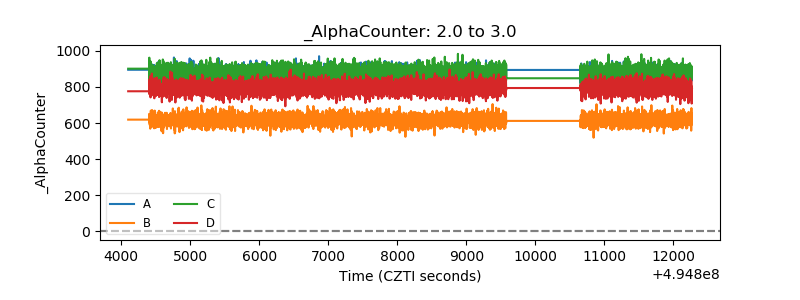 |
| _CPM_Rate | 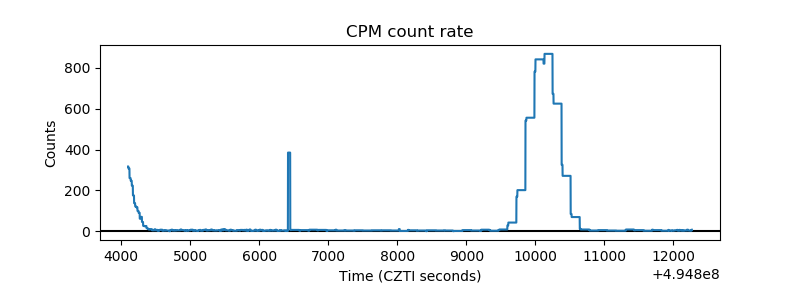 |
| CZT Counter | 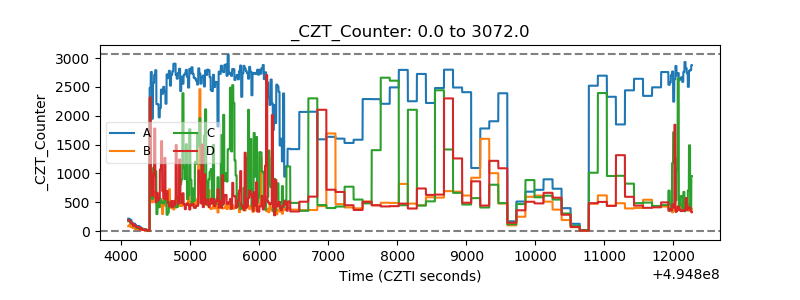 |
| +2.5 Volts monitor |  |
| +5 Volts monitor |  |
| _ROLL_ROT | 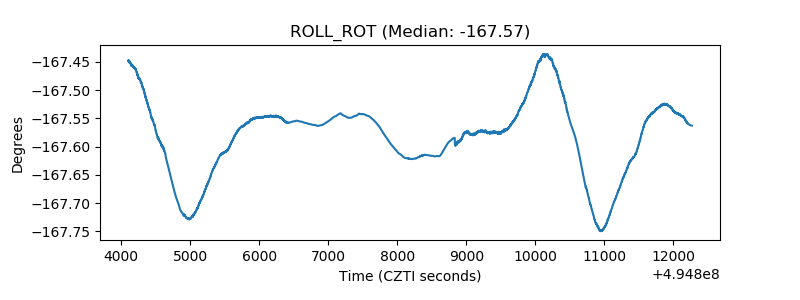 |
| _Roll_DEC | 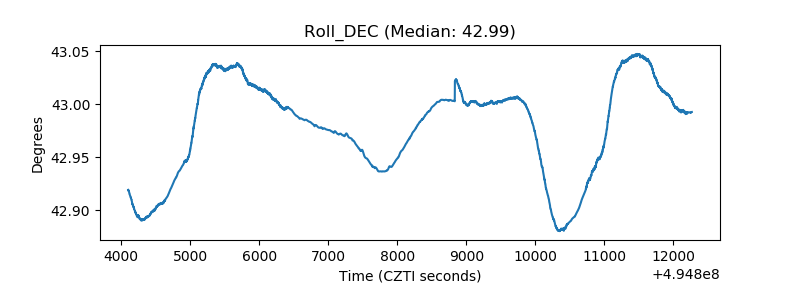 |
| _Roll_RA | 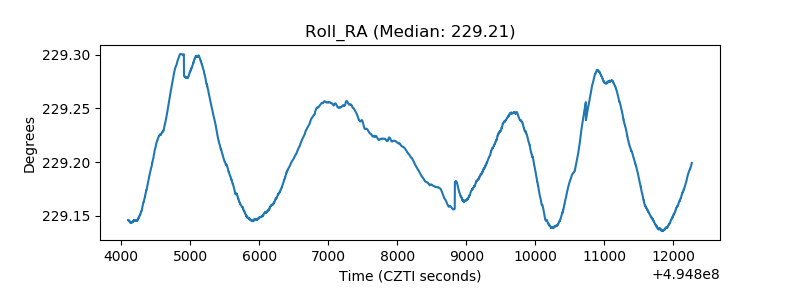 |
| Veto Counter | 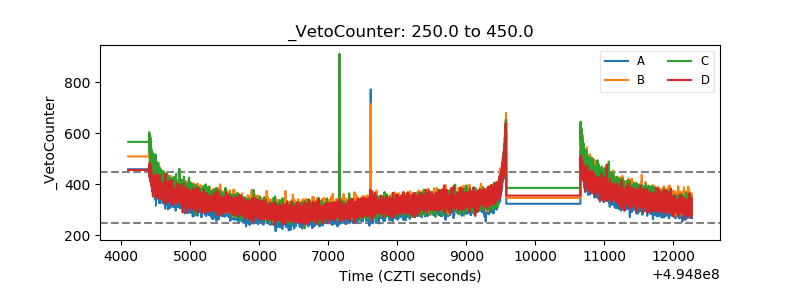 |