| Param | Original file | Final file |
|---|---|---|
| Filename | modeM0/AS1A14_022T04_9000006506_53774cztM0_level2.fits | modeM0/AS1A14_022T04_9000006506_53774cztM0_level2_quad_clean.evt |
| Size (bytes) | 810,475,200 | 75,899,520 |
| Size | 772.9 MB | 72.4 MB |
| Events in quadrant A | 16,485,903 | 33,132 |
| Events in quadrant B | 3,550,409 | 671,389 |
| Events in quadrant C | 6,267,845 | 564,859 |
| Events in quadrant D | 3,194,581 | 577,334 |
| Mode M0 | |||
|---|---|---|---|
| Quadrant | BADHDUFLAG | Total packets | Discarded packets |
| A | 0 | 53500 | 5 |
| B | 0 | 15123 | 1 |
| C | 0 | 23089 | 1 |
| D | 0 | 14295 | 1 |
| Mode SS | |||
|---|---|---|---|
| Quadrant | BADHDUFLAG | Total packets | Discarded packets |
| A | 0 | 132 | 0 |
| B | 0 | 132 | 0 |
| C | 0 | 132 | 0 |
| D | 0 | 132 | 0 |
| Mode M9 | |||
|---|---|---|---|
| Quadrant | BADHDUFLAG | Total packets | Discarded packets |
| A | 0 | 11 | 0 |
| B | 0 | 11 | 0 |
| C | 0 | 11 | 0 |
| D | 0 | 11 | 0 |
| Quadrant | Total seconds | Saturated seconds | Saturation percentage |
|---|---|---|---|
| A | 6468 | 6168 | 95.361781% |
| B | 6469 | 177 | 2.736126% |
| C | 6469 | 687 | 10.619879% |
| D | 6469 | 56 | 0.865667% |
Noise dominated data is calculated using 1-second bins in cleaned event files. If a bin has >2000 counts, and if more than 50% of those come from <1% of pixels, then it is considered to be noise-dominated and hence unusable.
| Quadrant | # 1 sec bins | Bins with >0 counts | Bins with >2000 counts | High rate bins dominated by noise | Noise dominated (total time) | Noise dominated (detector-on time) | Marked lightcurve |
|---|---|---|---|---|---|---|---|
| A | 7587 | 6467 | 6123 | 6123 | 80.70% | 94.68% | 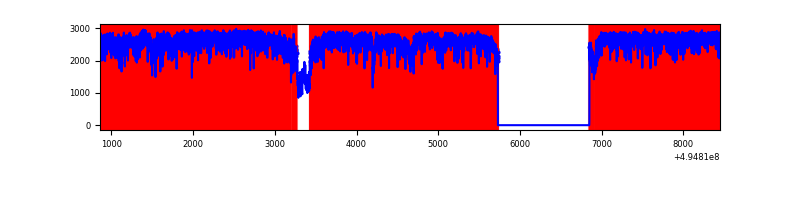 |
| B | 7589 | 6469 | 72 | 72 | 0.95% | 1.11% | 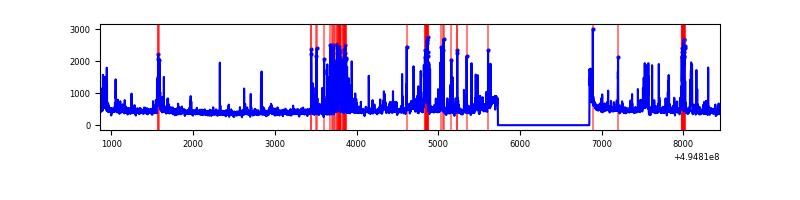 |
| C | 7589 | 6469 | 700 | 700 | 9.22% | 10.82% | 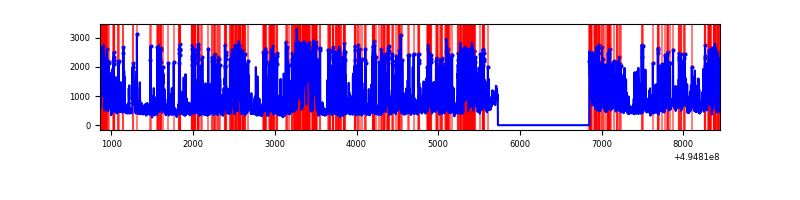 |
| D | 7589 | 6469 | 27 | 27 | 0.36% | 0.42% | 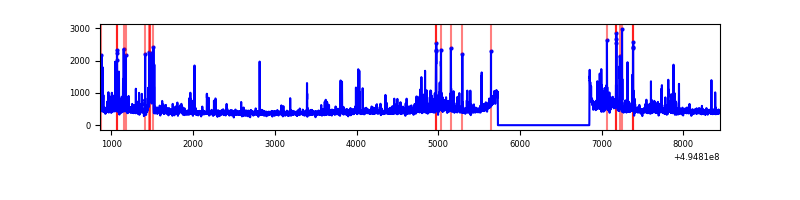 |
Top three noisy pixels from each quadrant. If the there are fewer than three noisy pixels in the level2.evt file, extra rows are filled as -1
| Pixel properties | Quadrant properties | ||||||
|---|---|---|---|---|---|---|---|
| Quadrant | DetID | PixID | Counts | Sigma | Mean | Median | Sigma |
| A | 3 | 63 | 15176787 | 203872.46 | 297 | 289 | 74.4 |
| A | 4 | 249 | 101714 | 1362.48 | 297 | 289 | 74.4 |
| A | 4 | 3 | 10774 | 140.84 | 297 | 289 | 74.4 |
| B | 0 | 213 | 245068 | 1648.09 | 691 | 667 | 148.3 |
| B | 6 | 255 | 221026 | 1485.97 | 691 | 667 | 148.3 |
| B | 5 | 185 | 59126 | 394.21 | 691 | 667 | 148.3 |
| C | 15 | 224 | 3035346 | 16822.23 | 654 | 645 | 180.4 |
| C | 7 | 64 | 183858 | 1015.6 | 654 | 645 | 180.4 |
| C | 15 | 208 | 127140 | 701.2 | 654 | 645 | 180.4 |
| D | 1 | 241 | 119334 | 614.61 | 676 | 646 | 193.1 |
| D | 2 | 172 | 71305 | 365.9 | 676 | 646 | 193.1 |
| D | 13 | 153 | 70403 | 361.23 | 676 | 646 | 193.1 |
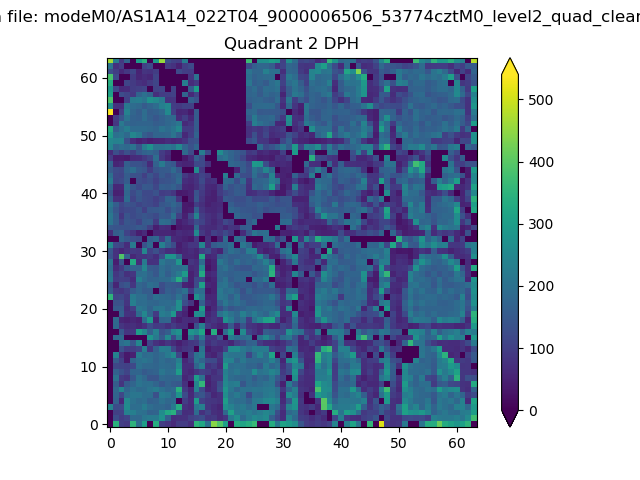
Histogram calculated using DETX and DETY for each event in the final _common_clean file
| Quadrant A | 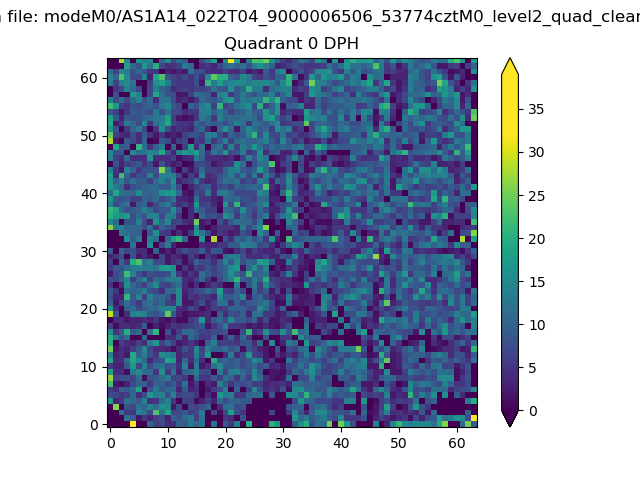 |
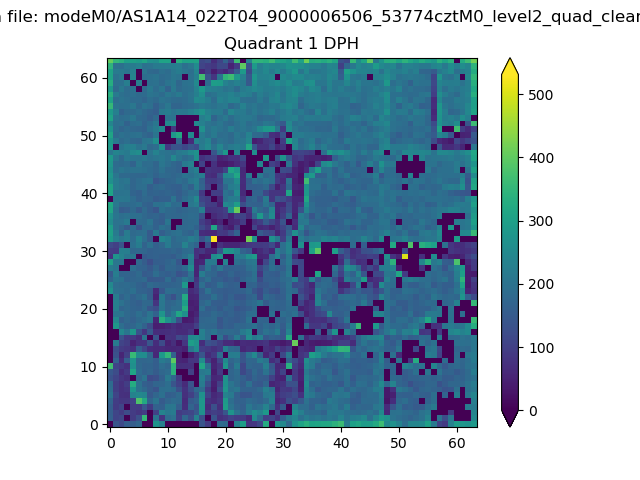 |
Quadrant B |
|---|---|---|---|
| Quadrant D | 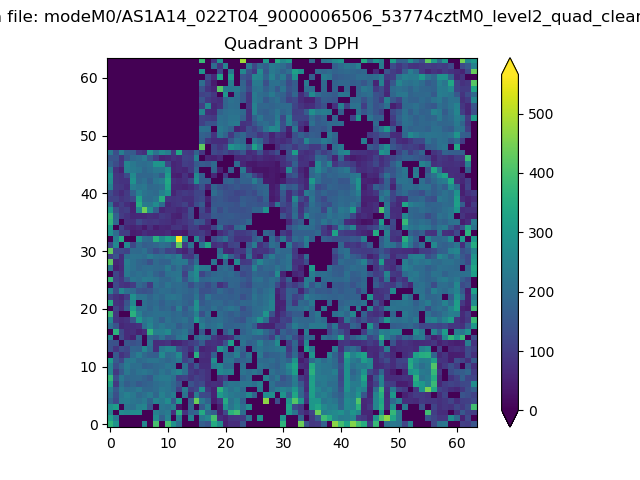 |
 |
Quadrant C |
| Plot type | Count rate plots | Images |
|---|---|---|
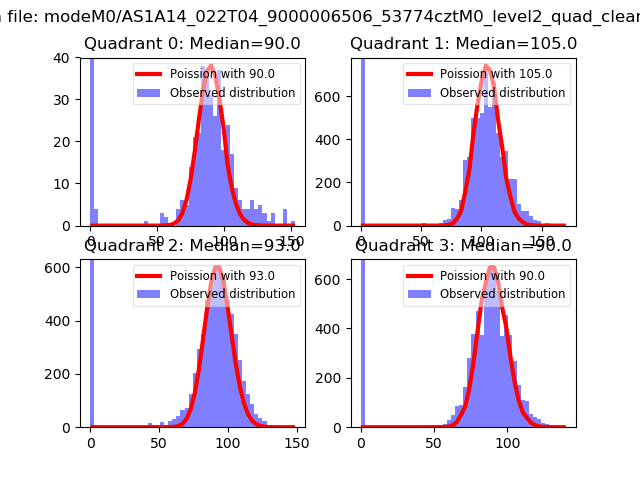
| Comparison with Poisson distribution Blue bars denote a histogram of data divided into 1 sec bins. Red curve is a Poisson curve with rate = median count rate of data. |
 |
 |
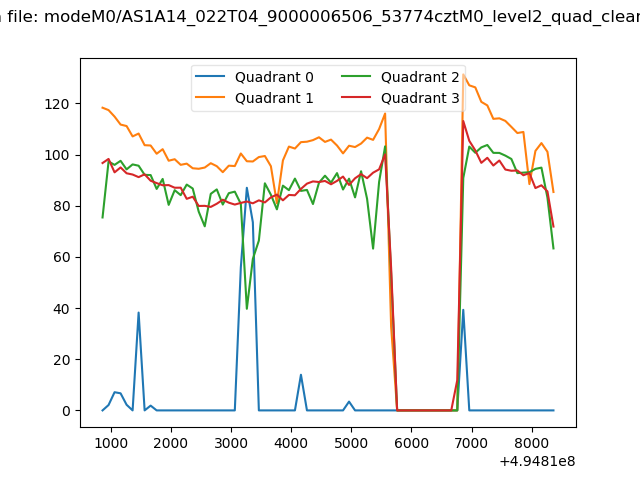
| Quadrant-wise count rates Data is divided into 100 sec bins |
 |
|
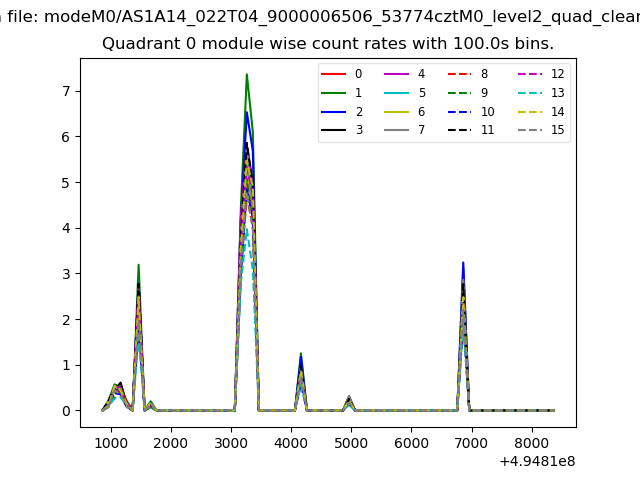
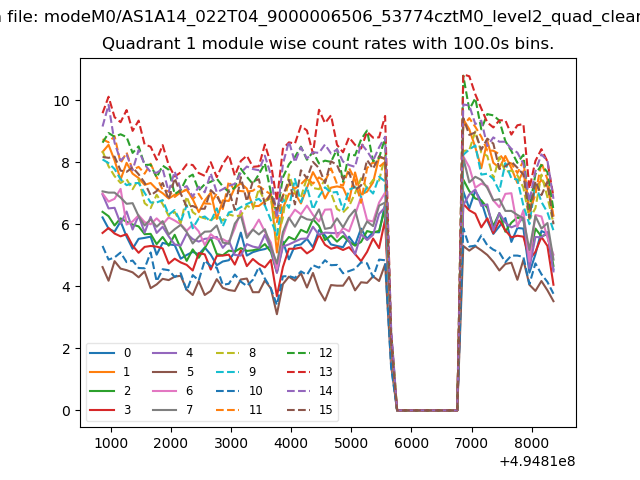
| Module-wise count rates for Quadrant A Data is divided into 100 sec bins |
 |
 |
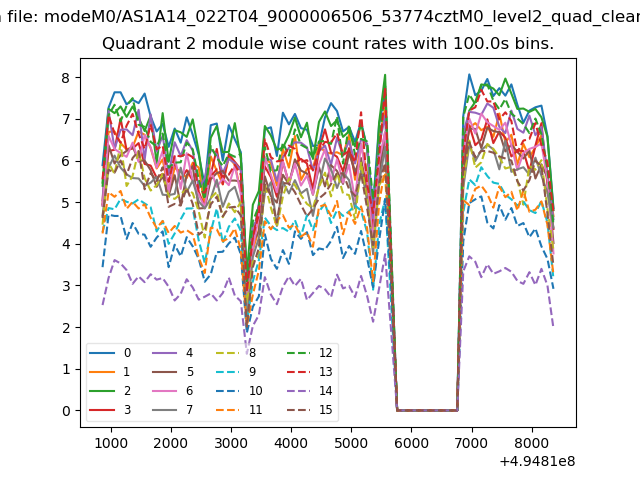
| Module-wise count rates for Quadrant B Data is divided into 100 sec bins |
 |
 |
| Module-wise count rates for Quadrant C Data is divided into 100 sec bins |
 |
 |
| Module-wise count rates for Quadrant D Data is divided into 100 sec bins |
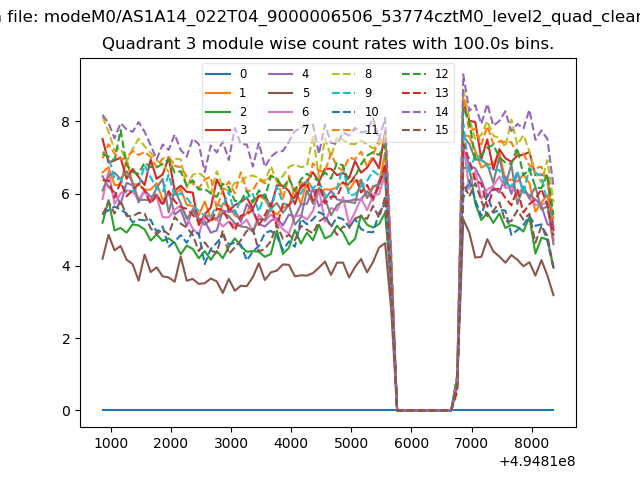 |
 |
| Parameter | Plot |
|---|---|
| CZT HV Monitor | 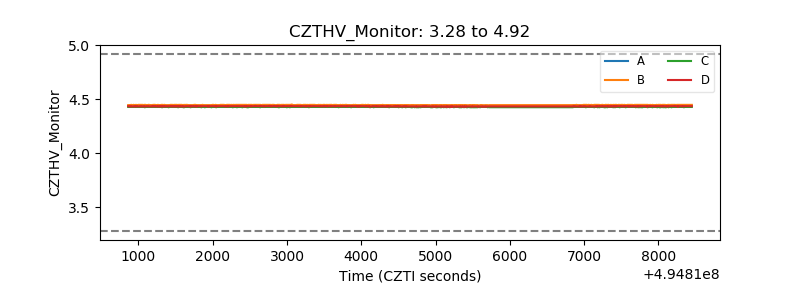 |
| D_VDD | 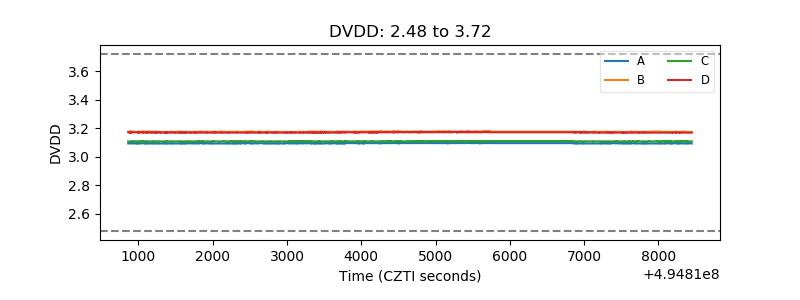 |
| Temperature 1 |  |
| Veto HV Monitor | 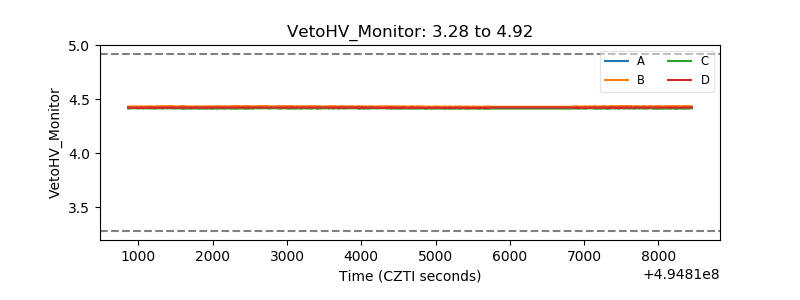 |
| Veto LLD | 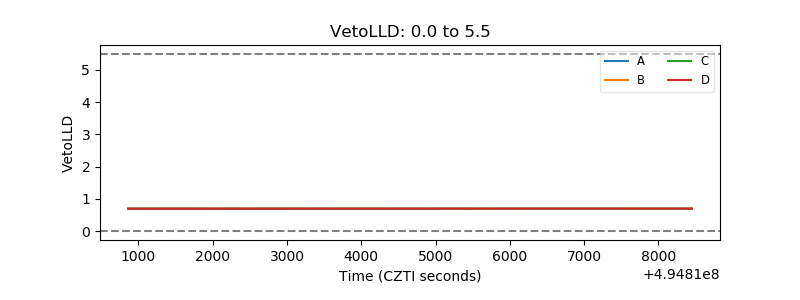 |
| Alpha Counter | 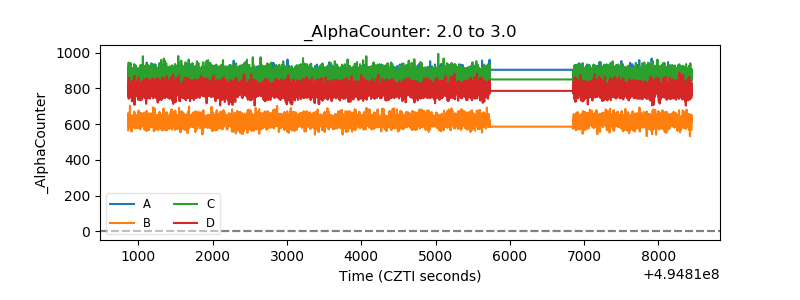 |
| _CPM_Rate | 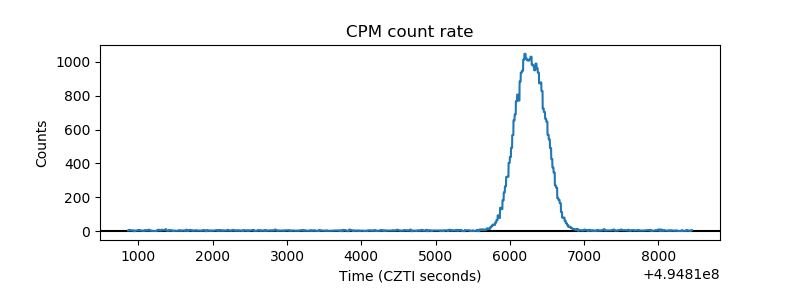 |
| CZT Counter | 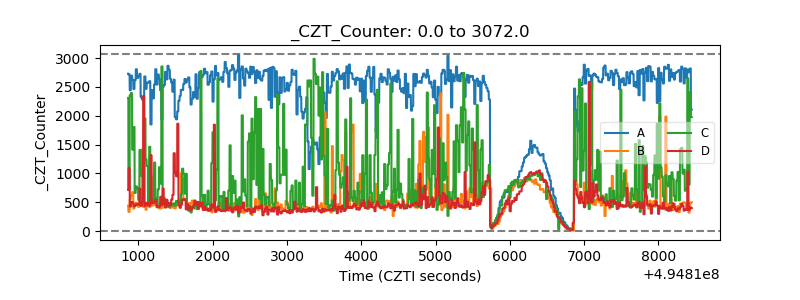 |
| +2.5 Volts monitor |  |
| +5 Volts monitor |  |
| _ROLL_ROT | 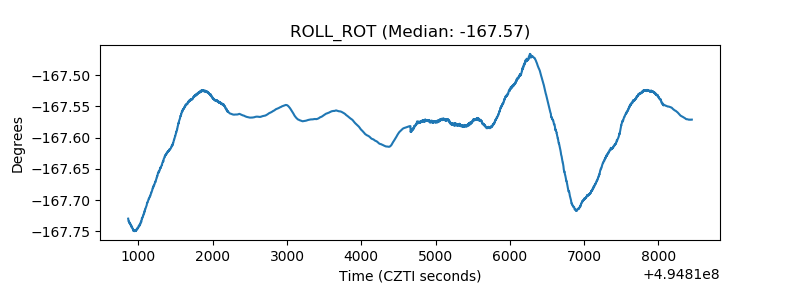 |
| _Roll_DEC | 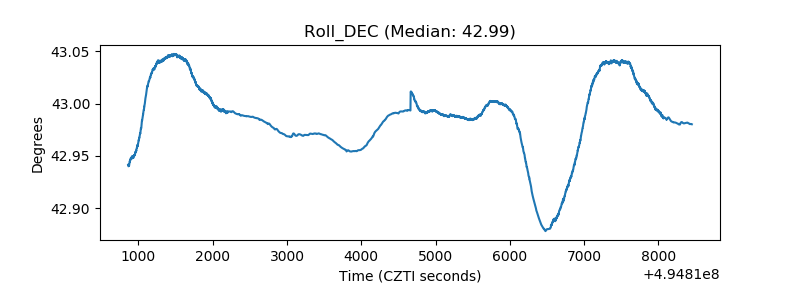 |
| _Roll_RA | 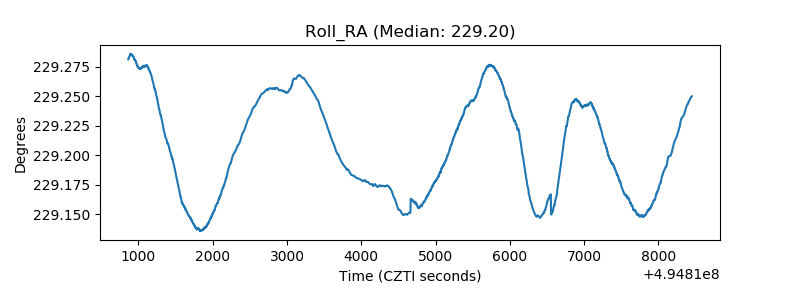 |
| Veto Counter | 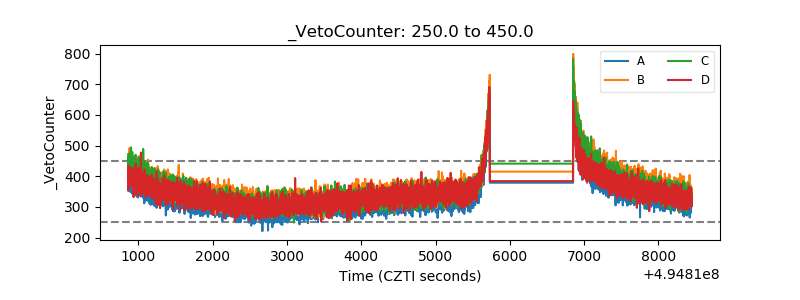 |