| Param | Original file | Final file |
|---|---|---|
| Filename | modeM0/AS1A14_022T04_9000006506_53778cztM0_level2.fits | modeM0/AS1A14_022T04_9000006506_53778cztM0_level2_quad_clean.evt |
| Size (bytes) | 862,824,960 | 68,011,200 |
| Size | 822.9 MB | 64.9 MB |
| Events in quadrant A | 15,949,225 | 4,097 |
| Events in quadrant B | 3,716,435 | 606,244 |
| Events in quadrant C | 4,978,035 | 540,788 |
| Events in quadrant D | 6,808,518 | 469,631 |
| Mode M0 | |||
|---|---|---|---|
| Quadrant | BADHDUFLAG | Total packets | Discarded packets |
| A | 0 | 51685 | 1 |
| B | 0 | 15603 | 1 |
| C | 0 | 19247 | 1 |
| D | 0 | 24559 | 1 |
| Mode SS | |||
|---|---|---|---|
| Quadrant | BADHDUFLAG | Total packets | Discarded packets |
| A | 0 | 128 | 0 |
| B | 0 | 128 | 0 |
| C | 0 | 128 | 0 |
| D | 0 | 128 | 0 |
| Mode M9 | |||
|---|---|---|---|
| Quadrant | BADHDUFLAG | Total packets | Discarded packets |
| A | 0 | 7 | 0 |
| B | 0 | 7 | 0 |
| C | 0 | 7 | 0 |
| D | 0 | 7 | 0 |
| Quadrant | Total seconds | Saturated seconds | Saturation percentage |
|---|---|---|---|
| A | 6277 | 6243 | 99.458340% |
| B | 6277 | 395 | 6.292815% |
| C | 6278 | 485 | 7.725390% |
| D | 6278 | 1016 | 16.183498% |
Noise dominated data is calculated using 1-second bins in cleaned event files. If a bin has >2000 counts, and if more than 50% of those come from <1% of pixels, then it is considered to be noise-dominated and hence unusable.
| Quadrant | # 1 sec bins | Bins with >0 counts | Bins with >2000 counts | High rate bins dominated by noise | Noise dominated (total time) | Noise dominated (detector-on time) | Marked lightcurve |
|---|---|---|---|---|---|---|---|
| A | 6932 | 6278 | 6056 | 6056 | 87.36% | 96.46% | 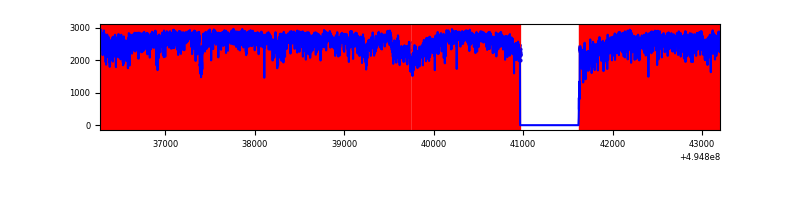 |
| B | 6931 | 6277 | 170 | 170 | 2.45% | 2.71% | 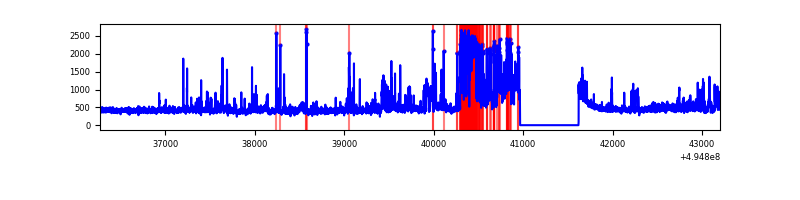 |
| C | 6933 | 6279 | 448 | 448 | 6.46% | 7.13% | 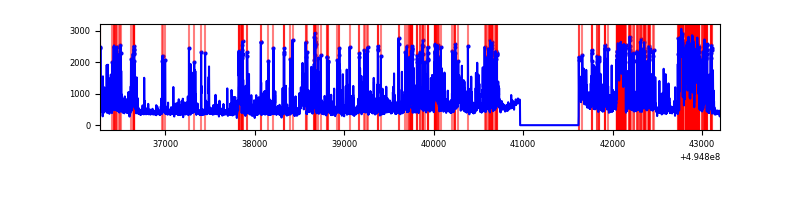 |
| D | 6933 | 6279 | 1062 | 1062 | 15.32% | 16.91% | 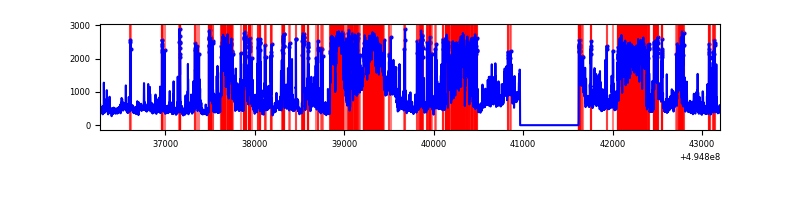 |
Top three noisy pixels from each quadrant. If the there are fewer than three noisy pixels in the level2.evt file, extra rows are filled as -1
| Pixel properties | Quadrant properties | ||||||
|---|---|---|---|---|---|---|---|
| Quadrant | DetID | PixID | Counts | Sigma | Mean | Median | Sigma |
| A | 3 | 63 | 14989619 | 264749.39 | 222 | 216 | 56.6 |
| A | 0 | 8 | 21998 | 384.72 | 222 | 216 | 56.6 |
| A | 4 | 249 | 16861 | 293.99 | 222 | 216 | 56.6 |
| B | 5 | 185 | 698156 | 4953.38 | 650 | 627 | 140.8 |
| B | 5 | 250 | 208552 | 1476.54 | 650 | 627 | 140.8 |
| B | 0 | 213 | 69380 | 488.24 | 650 | 627 | 140.8 |
| C | 15 | 224 | 1653937 | 9481.13 | 632 | 628 | 174.4 |
| C | 15 | 147 | 303431 | 1736.47 | 632 | 628 | 174.4 |
| C | 15 | 208 | 81365 | 463.0 | 632 | 628 | 174.4 |
| D | 6 | 127 | 1517795 | 8808.58 | 614 | 587 | 172.2 |
| D | 10 | 172 | 1510286 | 8764.99 | 614 | 587 | 172.2 |
| D | 1 | 241 | 287774 | 1667.35 | 614 | 587 | 172.2 |
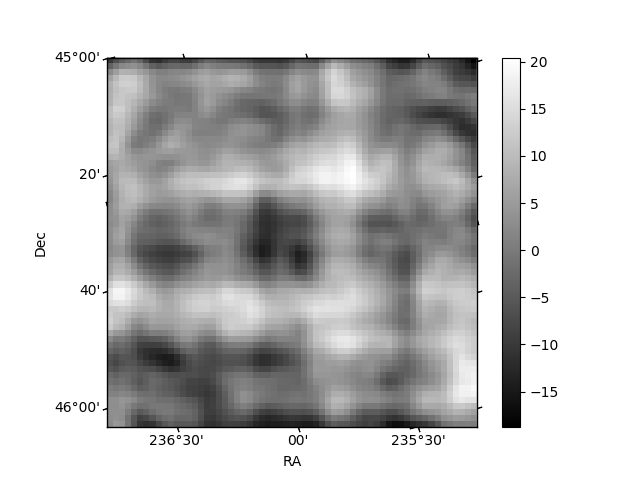
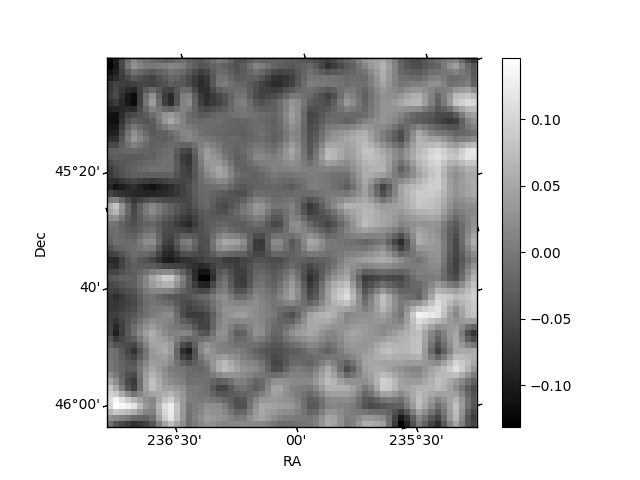
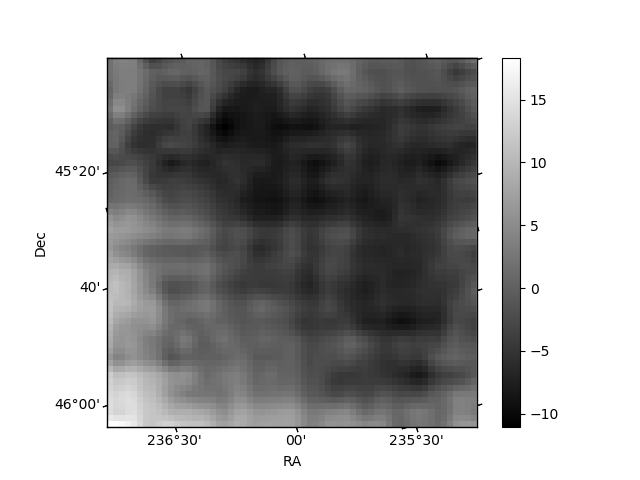
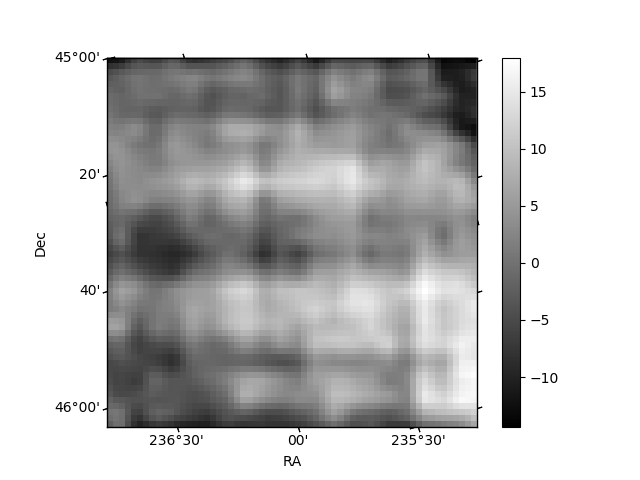
Histogram calculated using DETX and DETY for each event in the final _common_clean file
| Quadrant A | 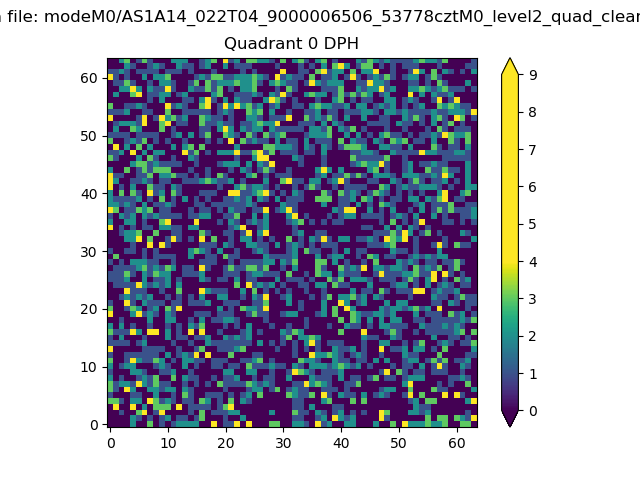 |
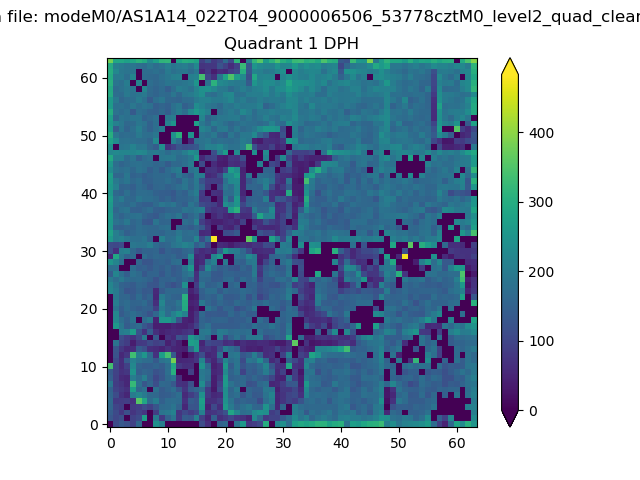 |
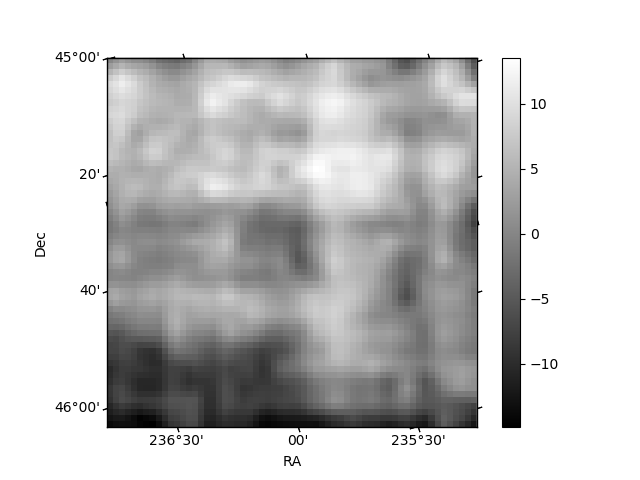
Quadrant B |
|---|---|---|---|
| Quadrant D | 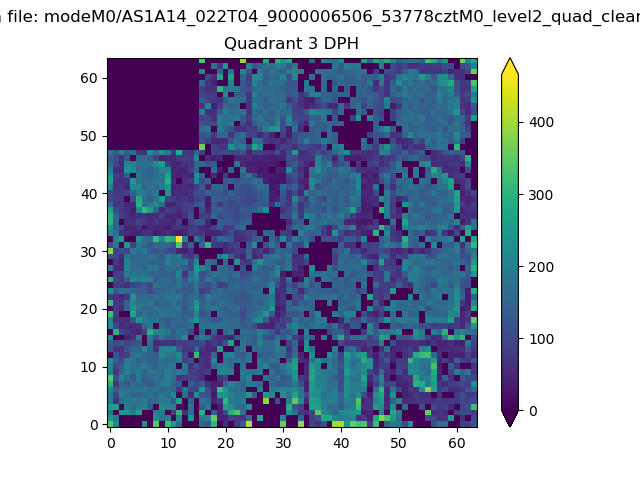 |
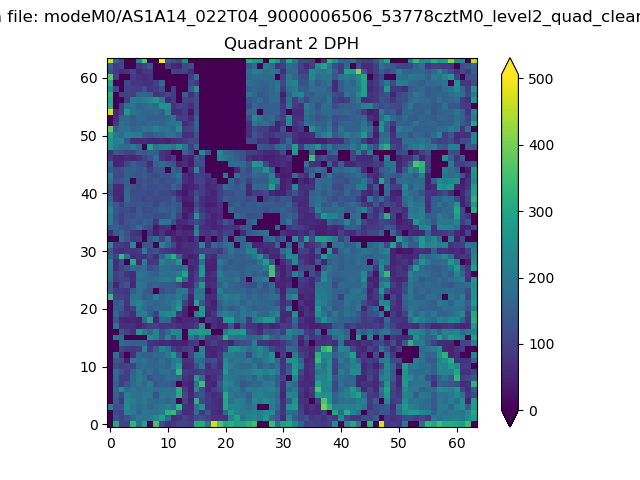 |
Quadrant C |
| Plot type | Count rate plots | Images |
|---|---|---|
| Comparison with Poisson distribution Blue bars denote a histogram of data divided into 1 sec bins. Red curve is a Poisson curve with rate = median count rate of data. |
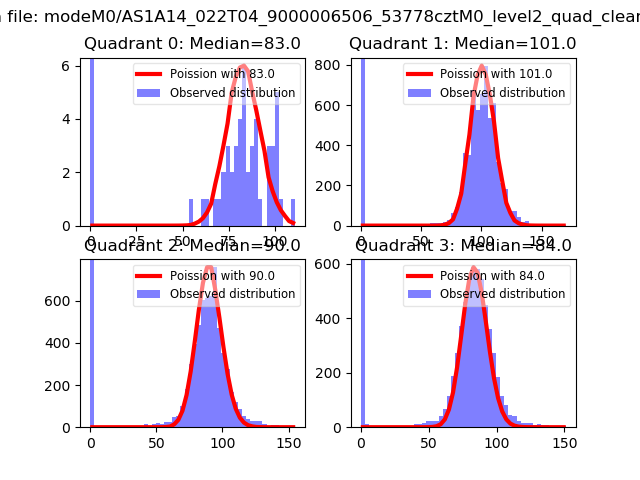 |
 |
| Quadrant-wise count rates Data is divided into 100 sec bins |
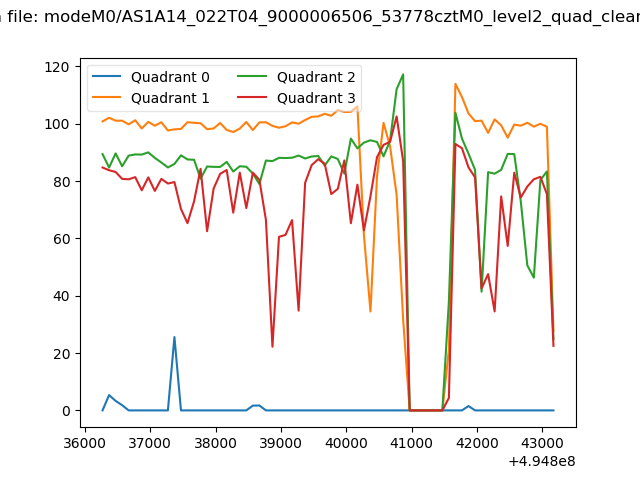 |
|
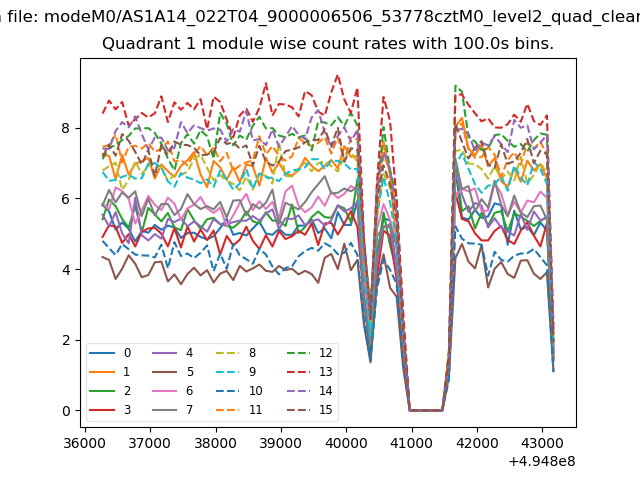
| Module-wise count rates for Quadrant A Data is divided into 100 sec bins |
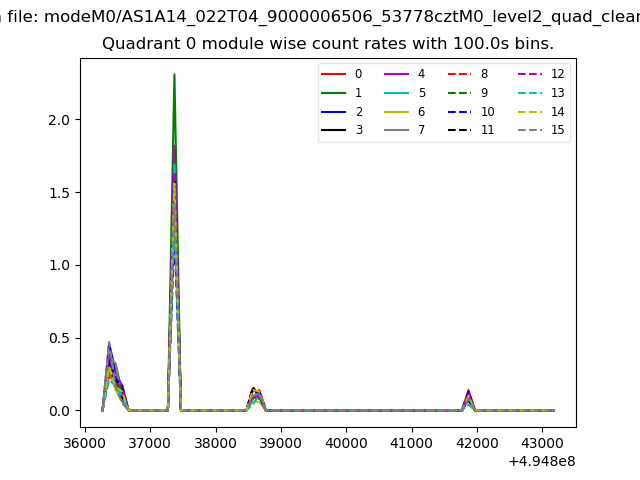 |
 |
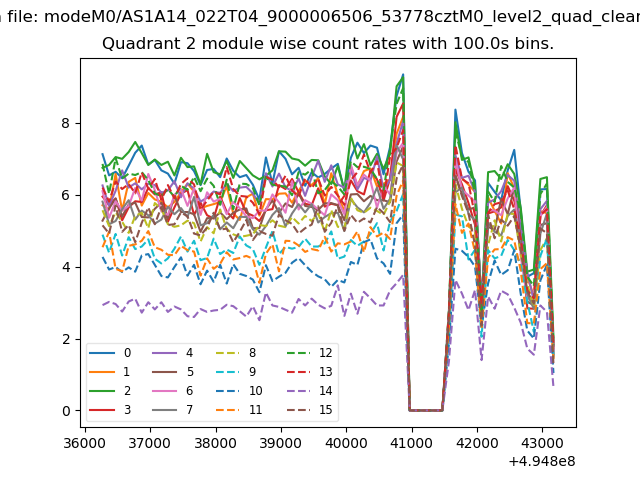
| Module-wise count rates for Quadrant B Data is divided into 100 sec bins |
 |
 |
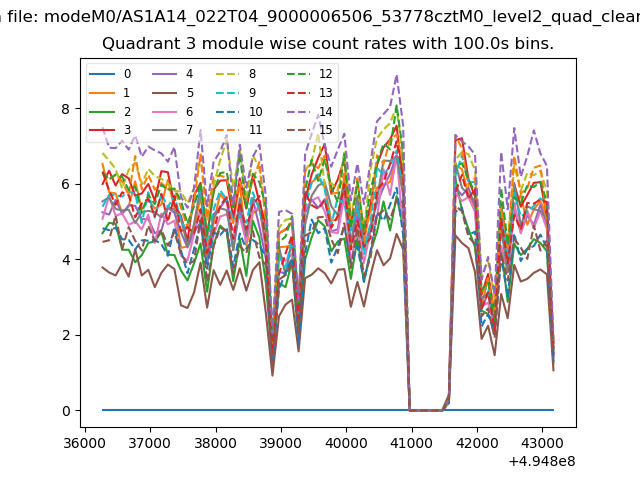
| Module-wise count rates for Quadrant C Data is divided into 100 sec bins |
 |
 |
| Module-wise count rates for Quadrant D Data is divided into 100 sec bins |
 |
 |
| Parameter | Plot |
|---|---|
| CZT HV Monitor | 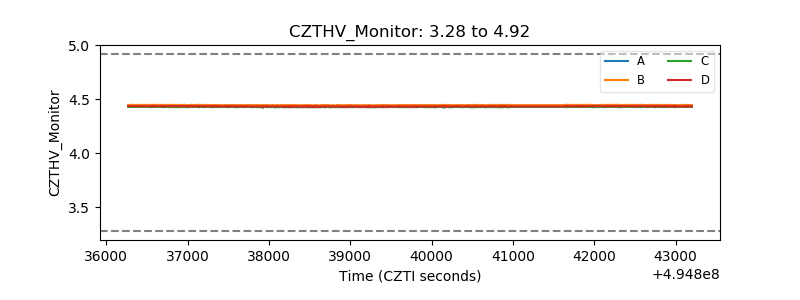 |
| D_VDD | 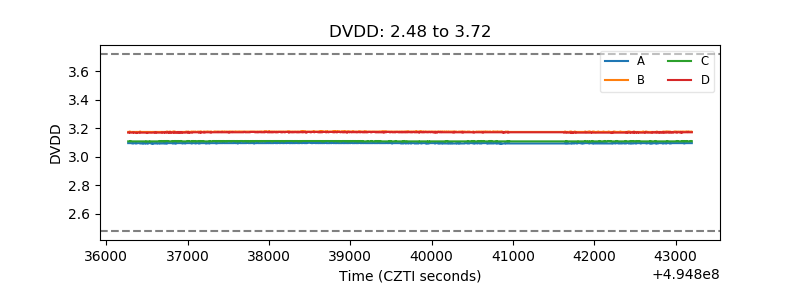 |
| Temperature 1 | 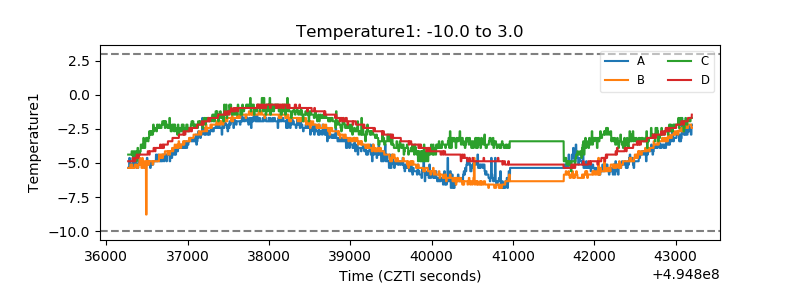 |
| Veto HV Monitor | 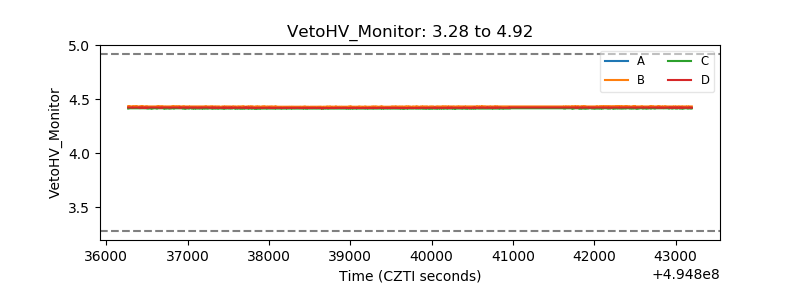 |
| Veto LLD | 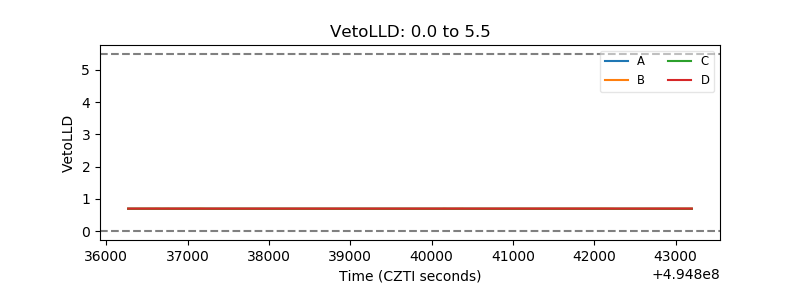 |
| Alpha Counter | 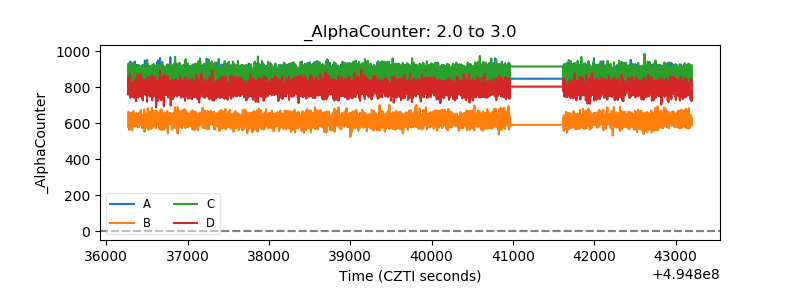 |
| _CPM_Rate | 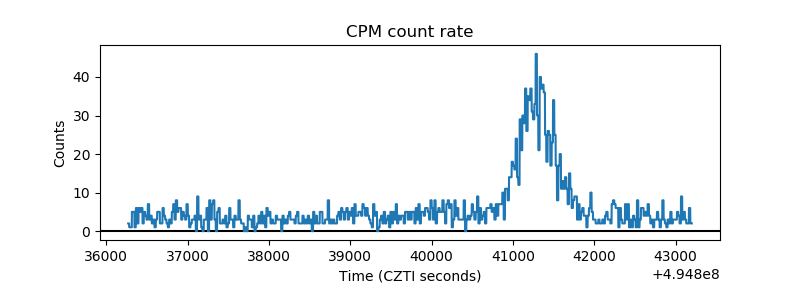 |
| CZT Counter | 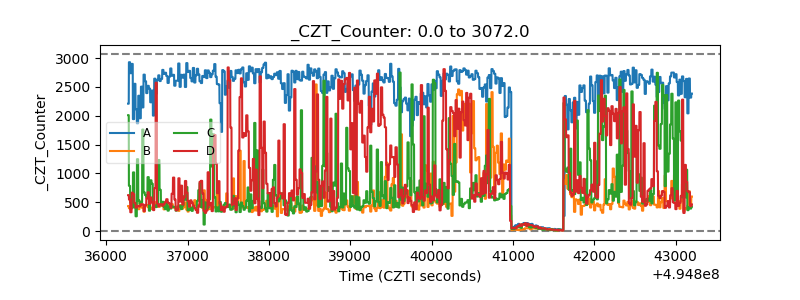 |
| +2.5 Volts monitor |  |
| +5 Volts monitor | 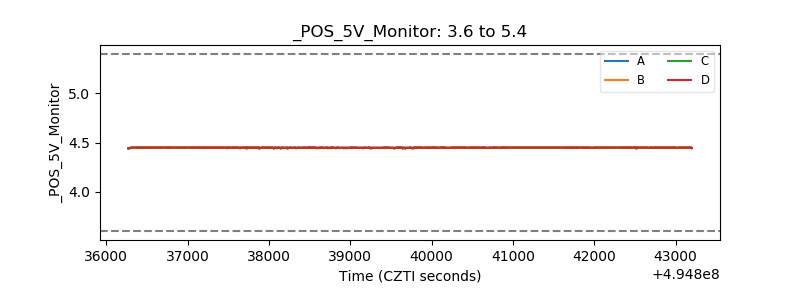 |
| _ROLL_ROT | 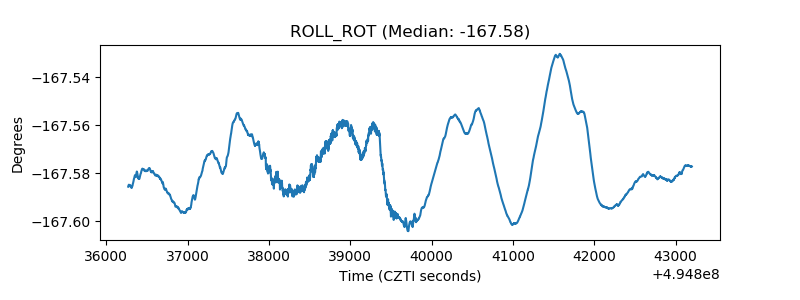 |
| _Roll_DEC | 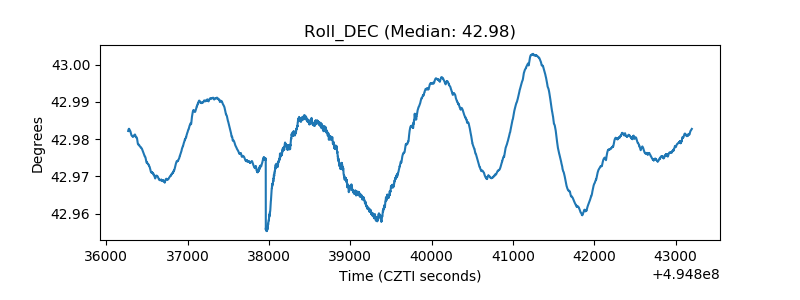 |
| _Roll_RA | 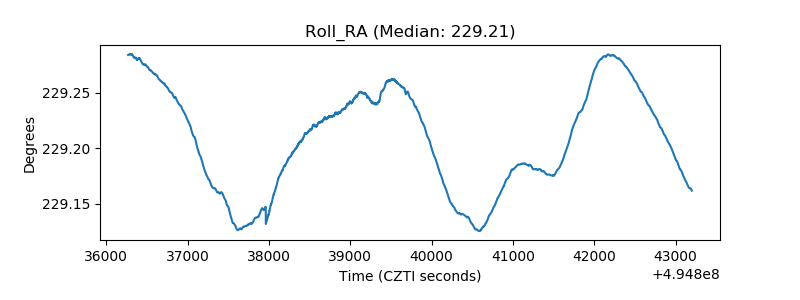 |
| Veto Counter | 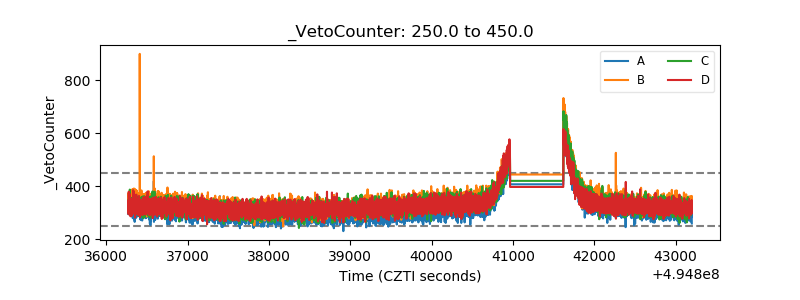 |