| Param | Original file | Final file |
|---|---|---|
| Filename | modeM0/AS1A14_022T04_9000006506_53779cztM0_level2.fits | modeM0/AS1A14_022T04_9000006506_53779cztM0_level2_quad_clean.evt |
| Size (bytes) | 1,049,299,200 | 82,333,440 |
| Size | 1000.7 MB | 78.5 MB |
| Events in quadrant A | 19,137,003 | 7,065 |
| Events in quadrant B | 5,052,176 | 745,710 |
| Events in quadrant C | 7,633,163 | 605,140 |
| Events in quadrant D | 6,442,097 | 615,500 |
| Mode M0 | |||
|---|---|---|---|
| Quadrant | BADHDUFLAG | Total packets | Discarded packets |
| A | 0 | 62114 | 183 |
| B | 0 | 20194 | 52 |
| C | 0 | 27977 | 69 |
| D | 0 | 24410 | 72 |
| Mode SS | |||
|---|---|---|---|
| Quadrant | BADHDUFLAG | Total packets | Discarded packets |
| A | 0 | 150 | 0 |
| B | 0 | 150 | 0 |
| C | 0 | 150 | 0 |
| D | 0 | 150 | 0 |
| Quadrant | Total seconds | Saturated seconds | Saturation percentage |
|---|---|---|---|
| A | 7458 | 7404 | 99.275945% |
| B | 7461 | 317 | 4.248760% |
| C | 7462 | 1072 | 14.366122% |
| D | 7463 | 557 | 7.463487% |
Noise dominated data is calculated using 1-second bins in cleaned event files. If a bin has >2000 counts, and if more than 50% of those come from <1% of pixels, then it is considered to be noise-dominated and hence unusable.
| Quadrant | # 1 sec bins | Bins with >0 counts | Bins with >2000 counts | High rate bins dominated by noise | Noise dominated (total time) | Noise dominated (detector-on time) | Marked lightcurve |
|---|---|---|---|---|---|---|---|
| A | 7482 | 7478 | 7327 | 7327 | 97.93% | 97.98% | 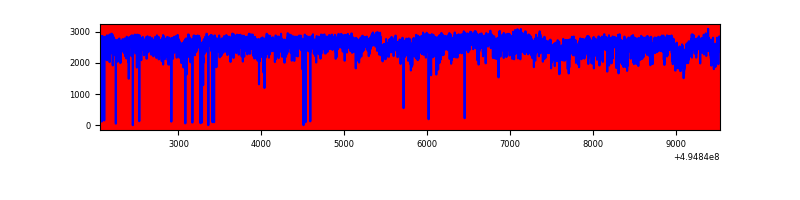 |
| B | 7482 | 7476 | 197 | 197 | 2.63% | 2.64% | 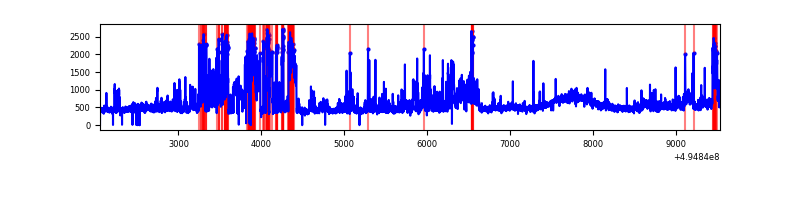 |
| C | 7483 | 7475 | 982 | 982 | 13.12% | 13.14% | 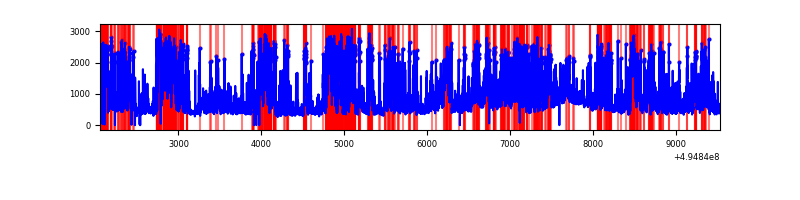 |
| D | 7483 | 7478 | 565 | 565 | 7.55% | 7.56% | 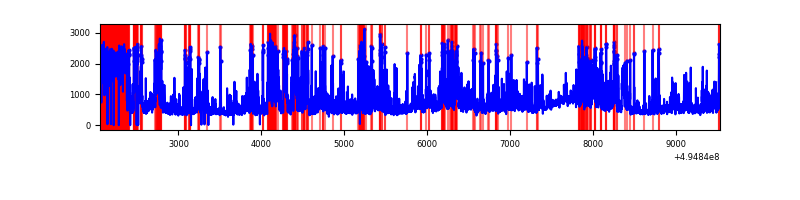 |
Top three noisy pixels from each quadrant. If the there are fewer than three noisy pixels in the level2.evt file, extra rows are filled as -1
| Pixel properties | Quadrant properties | ||||||
|---|---|---|---|---|---|---|---|
| Quadrant | DetID | PixID | Counts | Sigma | Mean | Median | Sigma |
| A | 3 | 63 | 17885501 | 250754.25 | 282 | 274 | 71.3 |
| A | 15 | 174 | 54976 | 766.93 | 282 | 274 | 71.3 |
| A | 4 | 249 | 17977 | 248.2 | 282 | 274 | 71.3 |
| B | 5 | 250 | 1151832 | 6650.81 | 800 | 769 | 173.1 |
| B | 4 | 171 | 193383 | 1112.92 | 800 | 769 | 173.1 |
| B | 8 | 234 | 145571 | 836.66 | 800 | 769 | 173.1 |
| C | 15 | 224 | 2687509 | 13126.73 | 746 | 740 | 204.7 |
| C | 15 | 147 | 774461 | 3780.16 | 746 | 740 | 204.7 |
| C | 15 | 158 | 388481 | 1894.38 | 746 | 740 | 204.7 |
| D | 10 | 172 | 1072748 | 4836.28 | 780 | 746 | 221.7 |
| D | 1 | 241 | 925969 | 4174.1 | 780 | 746 | 221.7 |
| D | 2 | 249 | 489510 | 2205.03 | 780 | 746 | 221.7 |
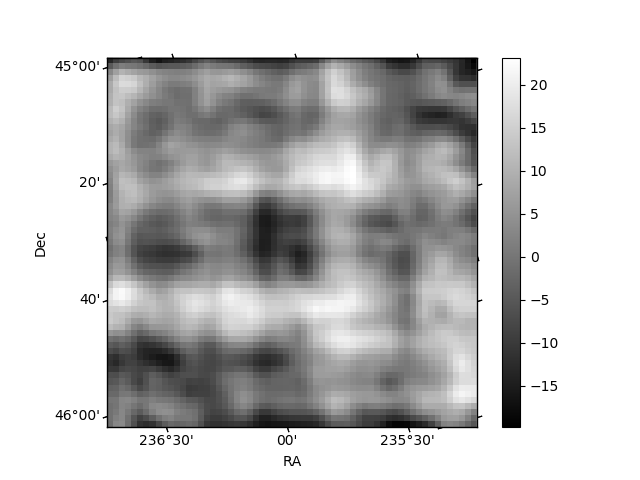
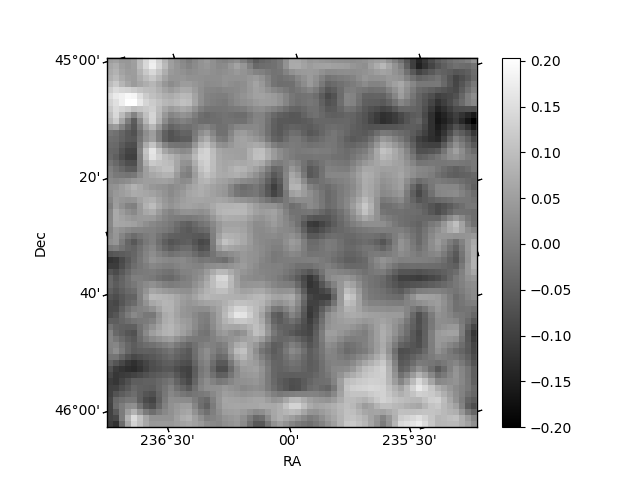
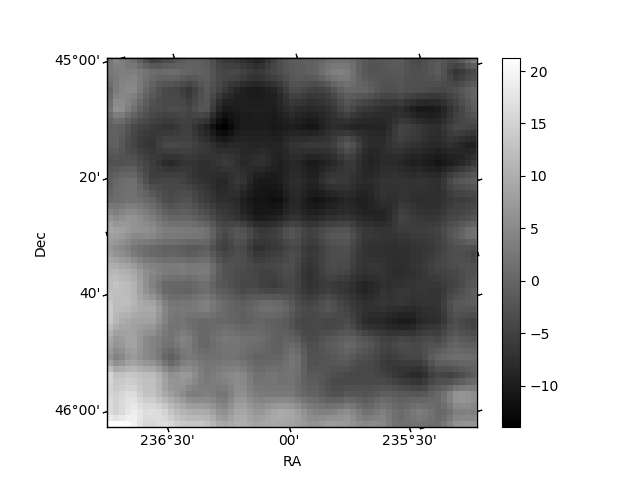
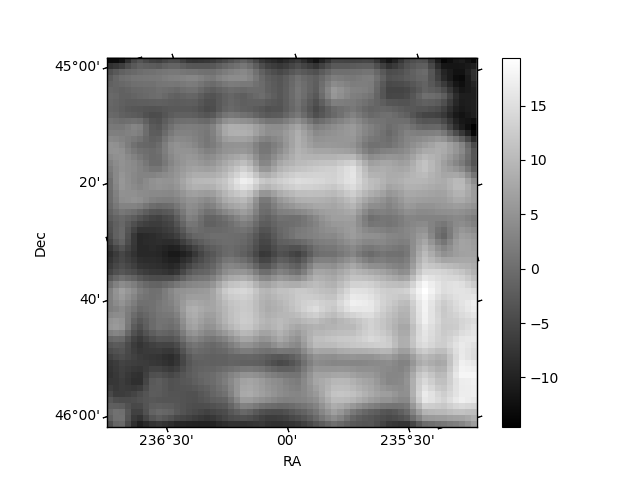
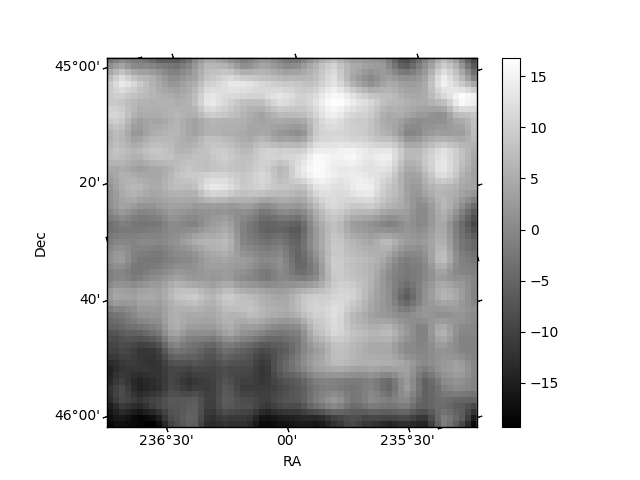
Histogram calculated using DETX and DETY for each event in the final _common_clean file
| Quadrant A | 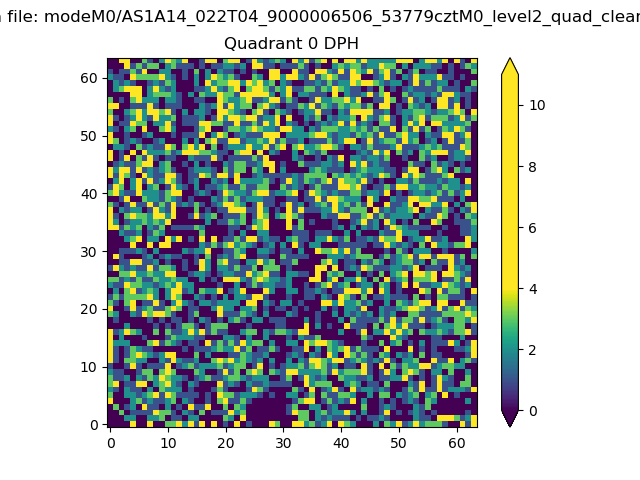 |
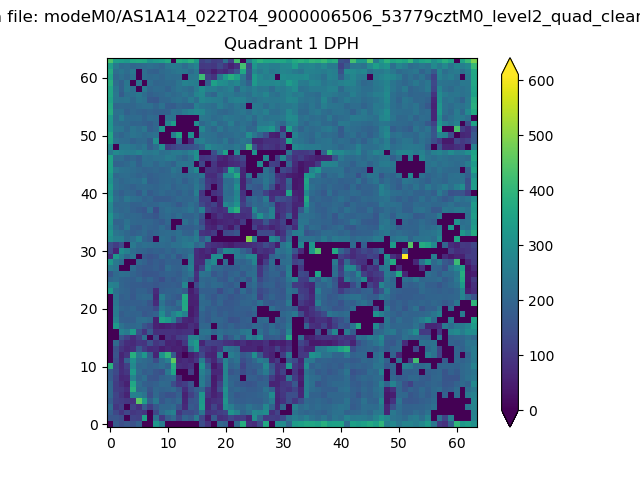 |
Quadrant B |
|---|---|---|---|
| Quadrant D | 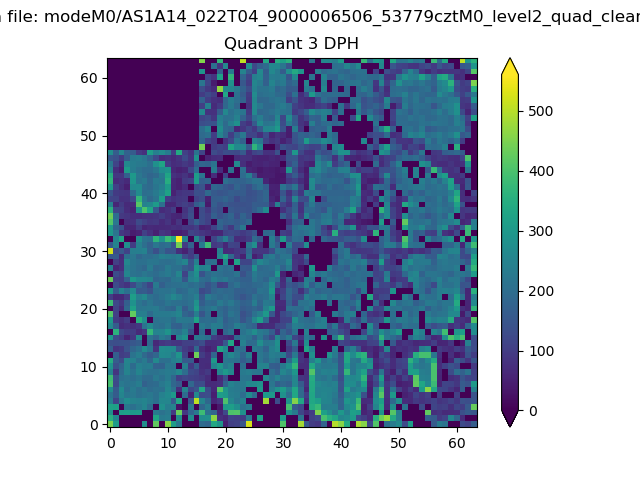 |
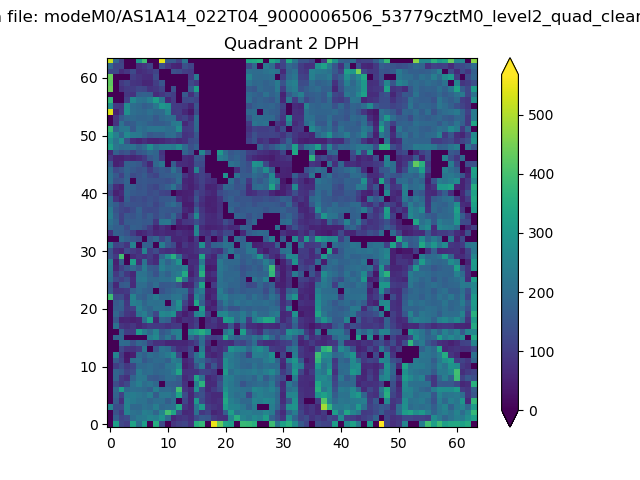 |
Quadrant C |
| Plot type | Count rate plots | Images |
|---|---|---|
| Comparison with Poisson distribution Blue bars denote a histogram of data divided into 1 sec bins. Red curve is a Poisson curve with rate = median count rate of data. |
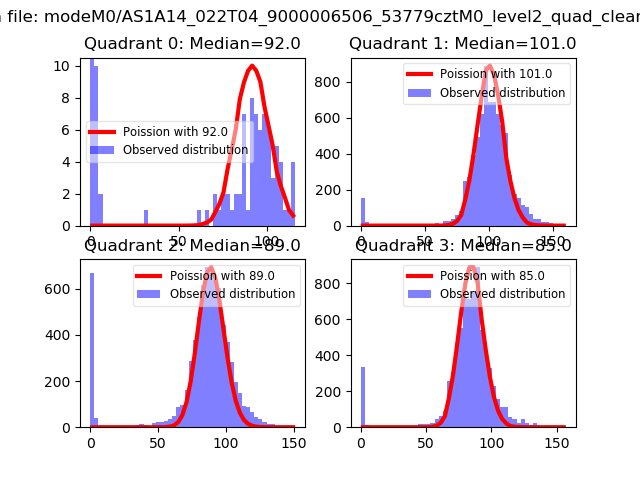 |
 |
| Quadrant-wise count rates Data is divided into 100 sec bins |
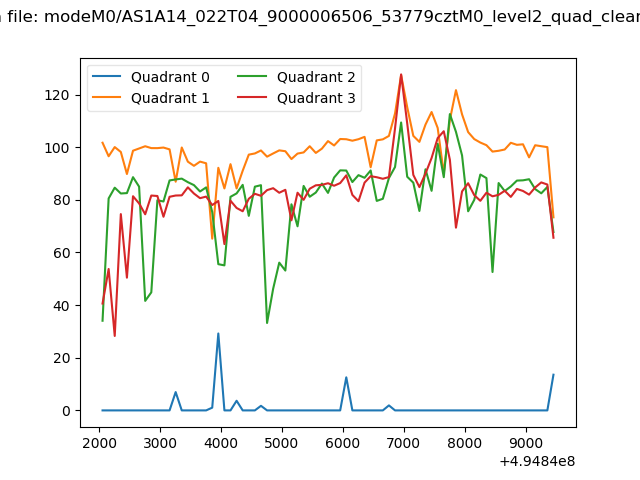 |
|
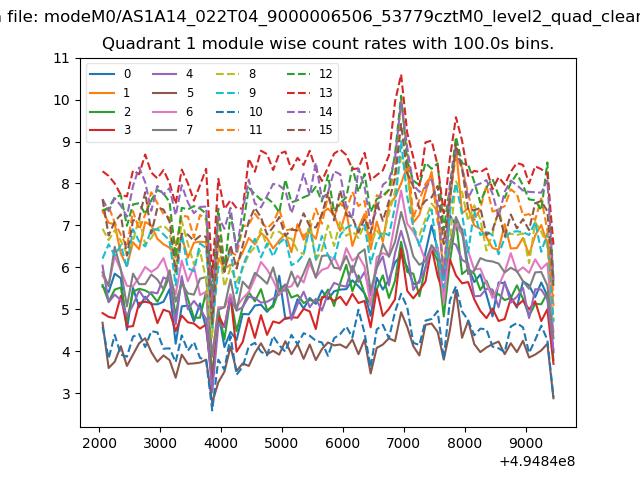
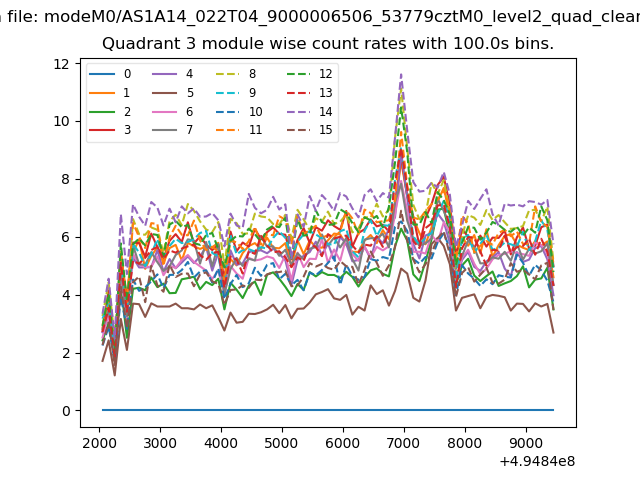
| Module-wise count rates for Quadrant A Data is divided into 100 sec bins |
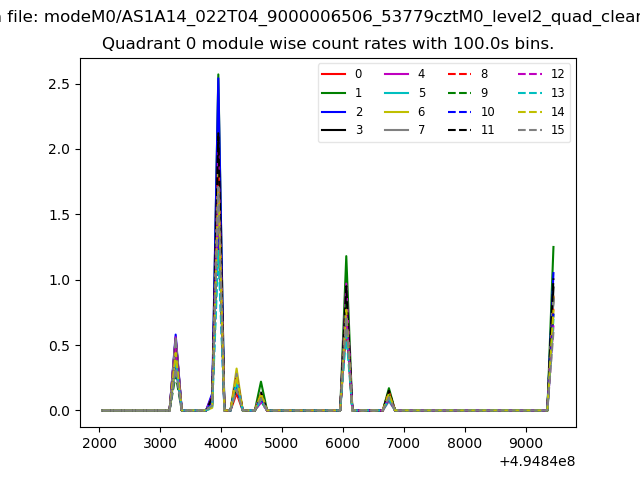 |
 |
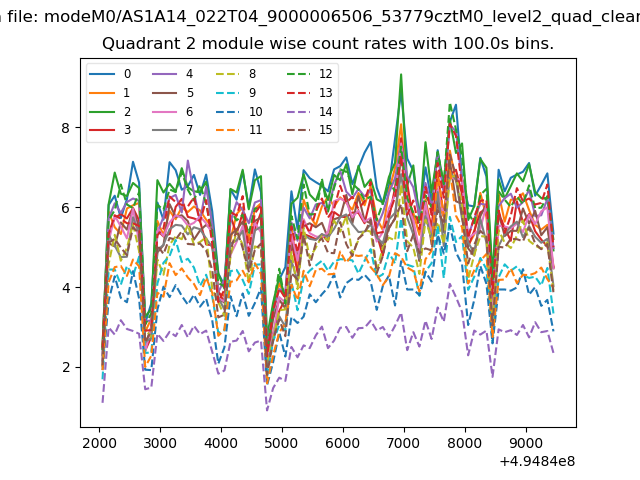
| Module-wise count rates for Quadrant B Data is divided into 100 sec bins |
 |
 |
| Module-wise count rates for Quadrant C Data is divided into 100 sec bins |
 |
 |
| Module-wise count rates for Quadrant D Data is divided into 100 sec bins |
 |
 |
| Parameter | Plot |
|---|---|
| CZT HV Monitor | 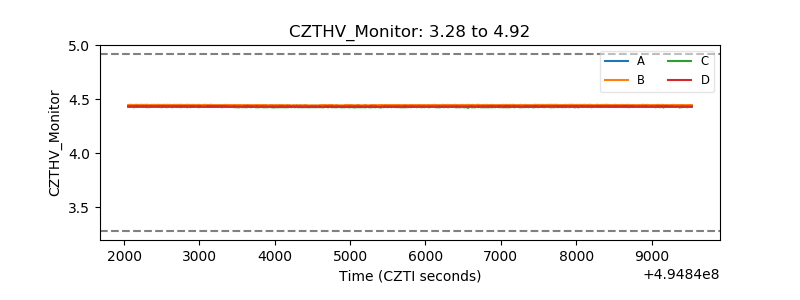 |
| D_VDD | 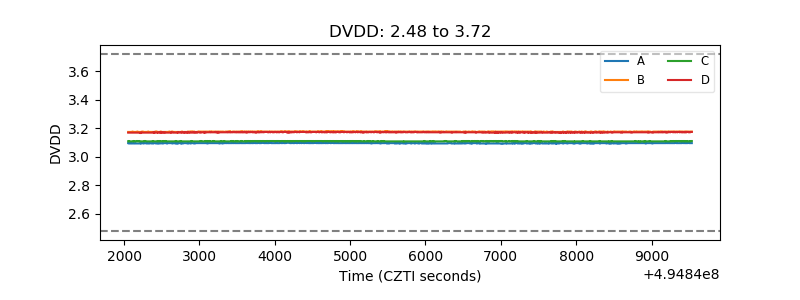 |
| Temperature 1 | 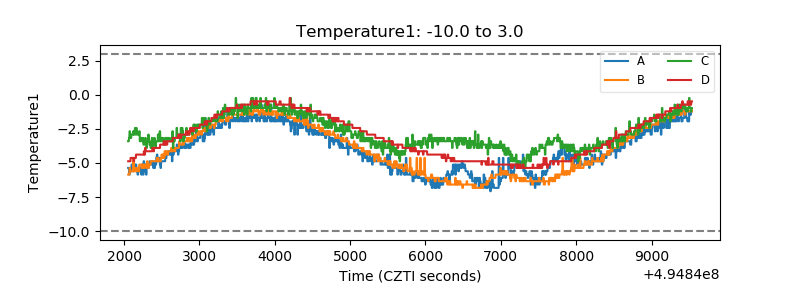 |
| Veto HV Monitor | 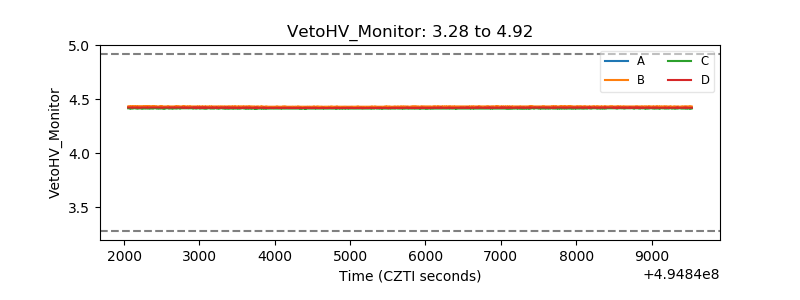 |
| Veto LLD | 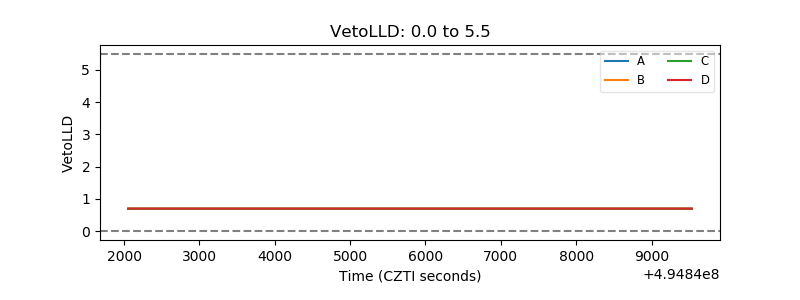 |
| Alpha Counter | 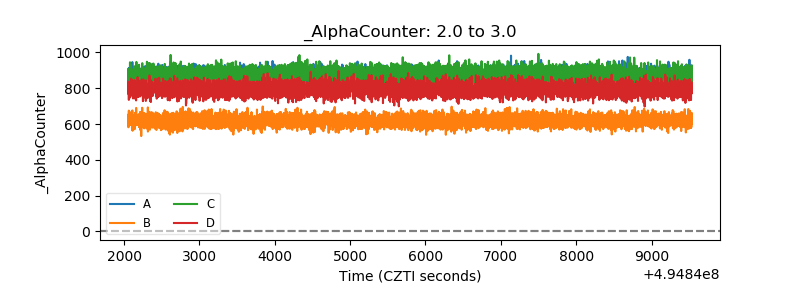 |
| _CPM_Rate | 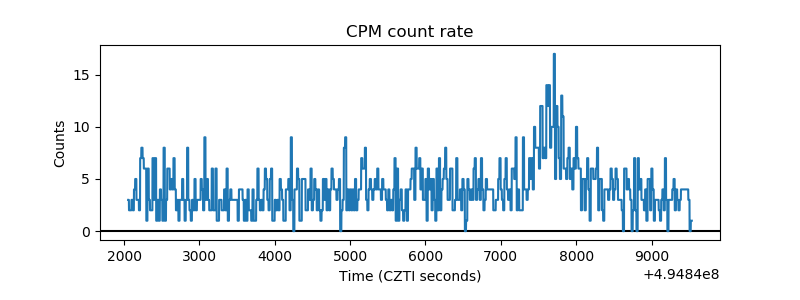 |
| CZT Counter | 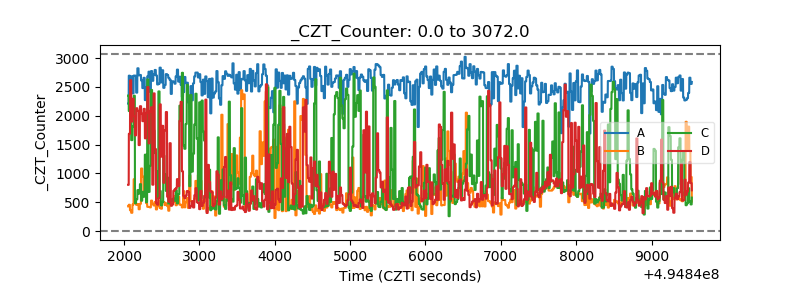 |
| +2.5 Volts monitor |  |
| +5 Volts monitor | 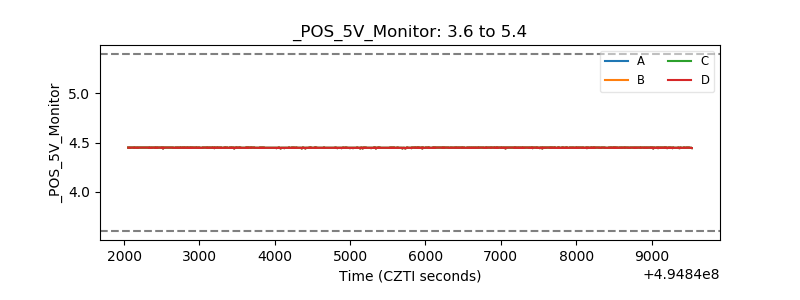 |
| _ROLL_ROT | 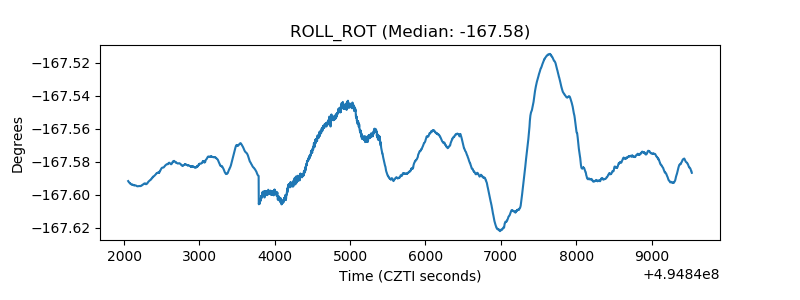 |
| _Roll_DEC | 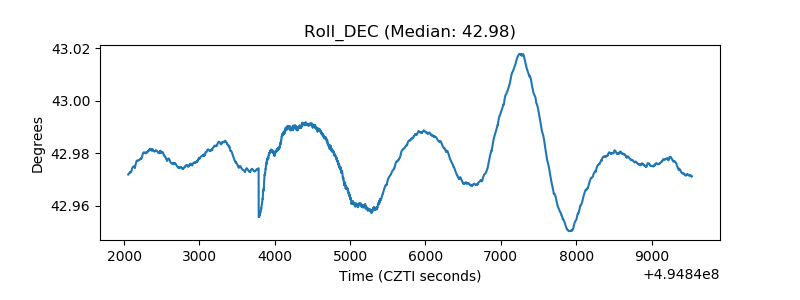 |
| _Roll_RA | 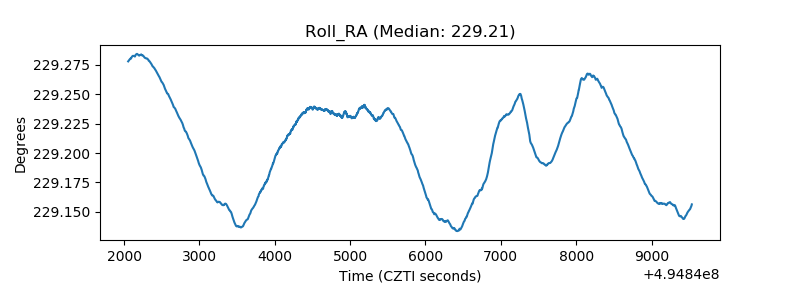 |
| Veto Counter | 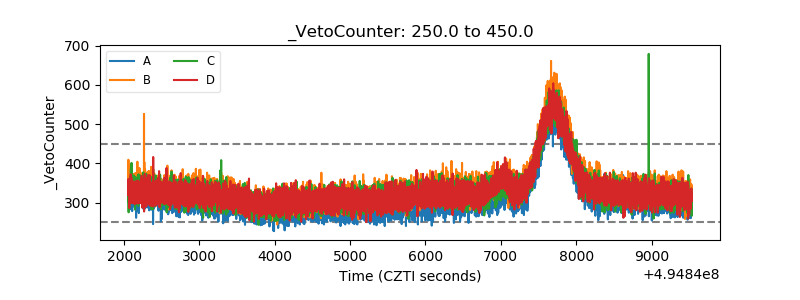 |