| Param | Original file | Final file |
|---|---|---|
| Filename | modeM0/AS1A14_022T04_9000006506_53780cztM0_level2.fits | modeM0/AS1A14_022T04_9000006506_53780cztM0_level2_quad_clean.evt |
| Size (bytes) | 1,049,014,080 | 79,295,040 |
| Size | 1000.4 MB | 75.6 MB |
| Events in quadrant A | 17,691,896 | 28,060 |
| Events in quadrant B | 4,457,061 | 742,034 |
| Events in quadrant C | 8,821,341 | 543,132 |
| Events in quadrant D | 7,286,691 | 570,965 |
| Mode M0 | |||
|---|---|---|---|
| Quadrant | BADHDUFLAG | Total packets | Discarded packets |
| A | 0 | 57747 | 85 |
| B | 0 | 18332 | 11 |
| C | 0 | 31403 | 33 |
| D | 0 | 26822 | 19 |
| Mode SS | |||
|---|---|---|---|
| Quadrant | BADHDUFLAG | Total packets | Discarded packets |
| A | 0 | 148 | 0 |
| B | 0 | 148 | 0 |
| C | 0 | 148 | 0 |
| D | 0 | 148 | 0 |
| Quadrant | Total seconds | Saturated seconds | Saturation percentage |
|---|---|---|---|
| A | 7418 | 7168 | 96.629819% |
| B | 7425 | 100 | 1.346801% |
| C | 7422 | 1585 | 21.355430% |
| D | 7422 | 854 | 11.506333% |
Noise dominated data is calculated using 1-second bins in cleaned event files. If a bin has >2000 counts, and if more than 50% of those come from <1% of pixels, then it is considered to be noise-dominated and hence unusable.
| Quadrant | # 1 sec bins | Bins with >0 counts | Bins with >2000 counts | High rate bins dominated by noise | Noise dominated (total time) | Noise dominated (detector-on time) | Marked lightcurve |
|---|---|---|---|---|---|---|---|
| A | 7429 | 7429 | 6337 | 6337 | 85.30% | 85.30% | 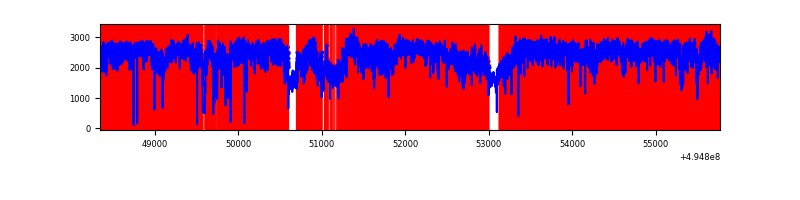 |
| B | 7430 | 7428 | 64 | 64 | 0.86% | 0.86% | 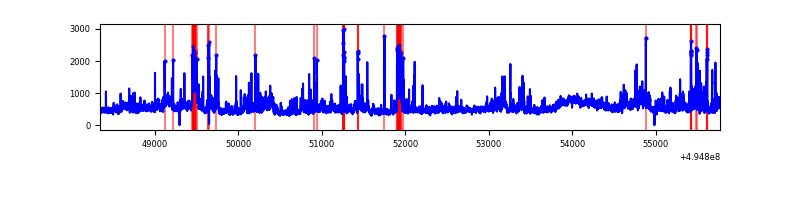 |
| C | 7430 | 7427 | 1277 | 1277 | 17.19% | 17.19% | 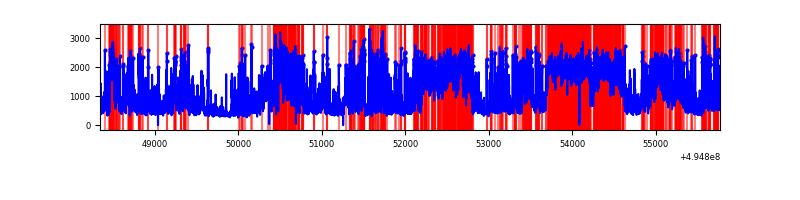 |
| D | 7430 | 7428 | 896 | 896 | 12.06% | 12.06% | 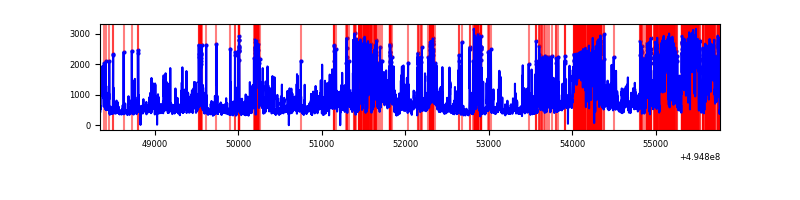 |
Top three noisy pixels from each quadrant. If the there are fewer than three noisy pixels in the level2.evt file, extra rows are filled as -1
| Pixel properties | Quadrant properties | ||||||
|---|---|---|---|---|---|---|---|
| Quadrant | DetID | PixID | Counts | Sigma | Mean | Median | Sigma |
| A | 3 | 63 | 16636685 | 341298.3 | 190 | 186 | 48.7 |
| A | 3 | 78 | 207370 | 4250.39 | 190 | 186 | 48.7 |
| A | 0 | 8 | 24835 | 505.68 | 190 | 186 | 48.7 |
| B | 7 | 0 | 661271 | 3937.78 | 777 | 750 | 167.7 |
| B | 4 | 171 | 191194 | 1135.36 | 777 | 750 | 167.7 |
| B | 5 | 185 | 154552 | 916.91 | 777 | 750 | 167.7 |
| C | 15 | 158 | 2780660 | 14266.86 | 703 | 696 | 194.9 |
| C | 15 | 224 | 2391989 | 12272.19 | 703 | 696 | 194.9 |
| C | 15 | 147 | 207925 | 1063.51 | 703 | 696 | 194.9 |
| D | 1 | 241 | 3582854 | 16934.23 | 736 | 700 | 211.5 |
| D | 2 | 249 | 119792 | 562.99 | 736 | 700 | 211.5 |
| D | 3 | 12 | 116067 | 545.38 | 736 | 700 | 211.5 |
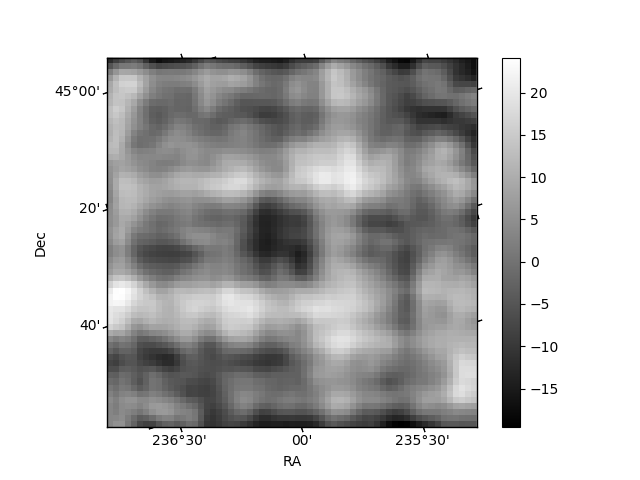
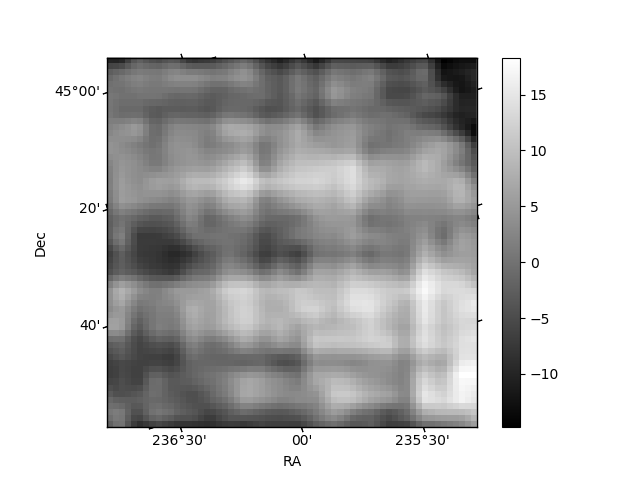
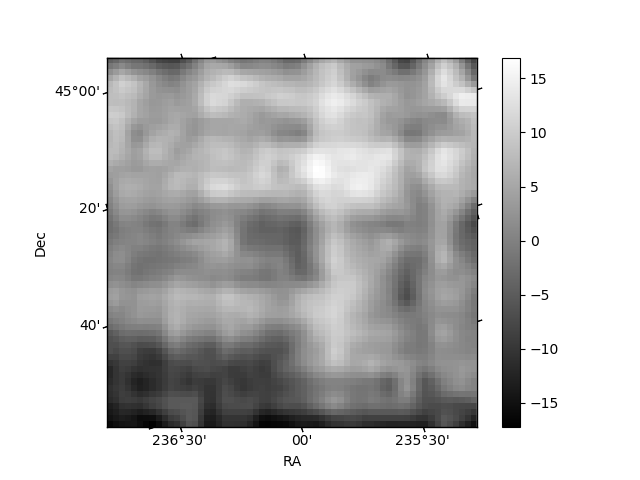
Histogram calculated using DETX and DETY for each event in the final _common_clean file
| Quadrant A | 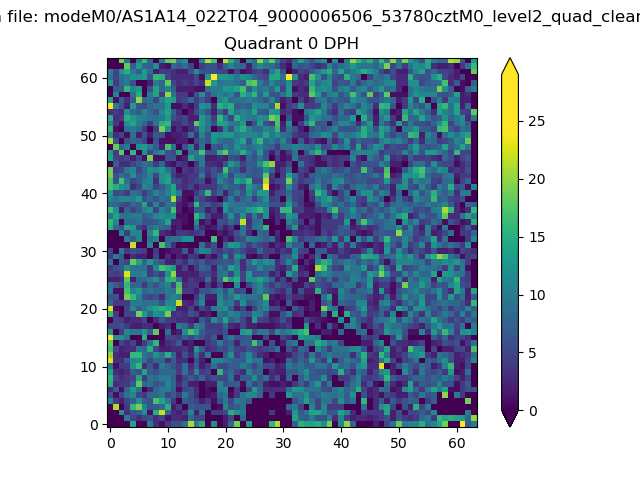 |
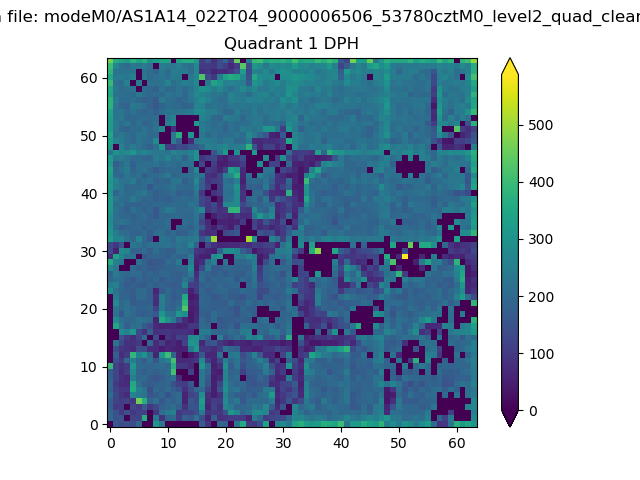 |
Quadrant B |
|---|---|---|---|
| Quadrant D | 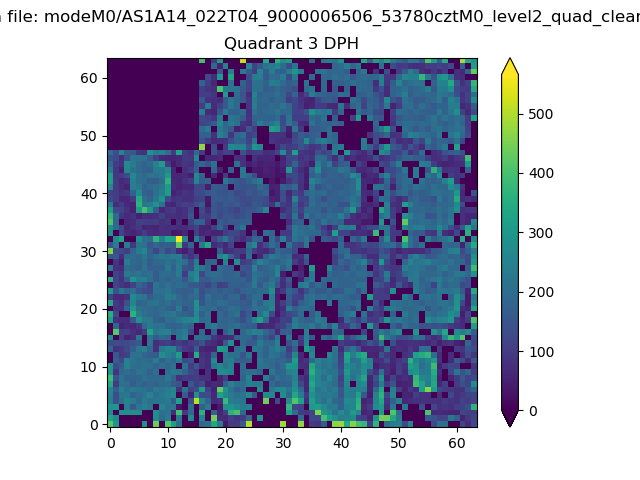 |
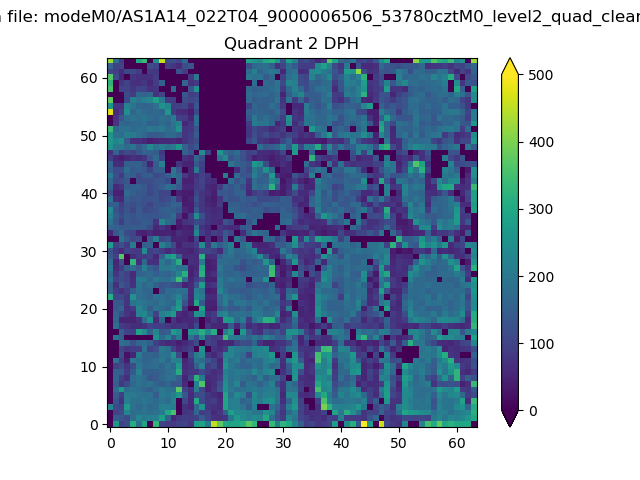 |
Quadrant C |
| Plot type | Count rate plots | Images |
|---|---|---|
| Comparison with Poisson distribution Blue bars denote a histogram of data divided into 1 sec bins. Red curve is a Poisson curve with rate = median count rate of data. |
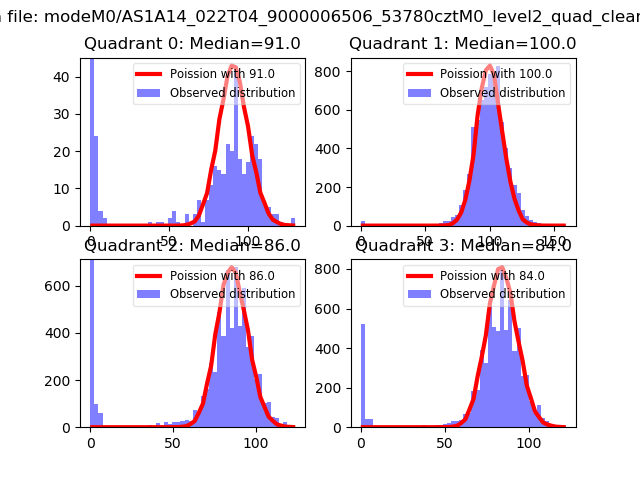 |
 |
| Quadrant-wise count rates Data is divided into 100 sec bins |
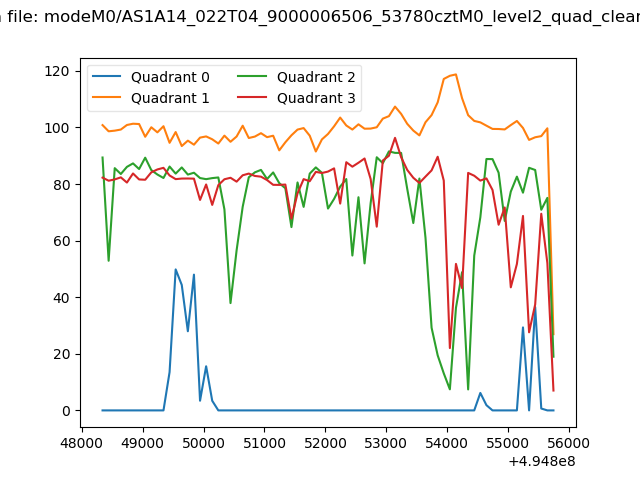 |
|
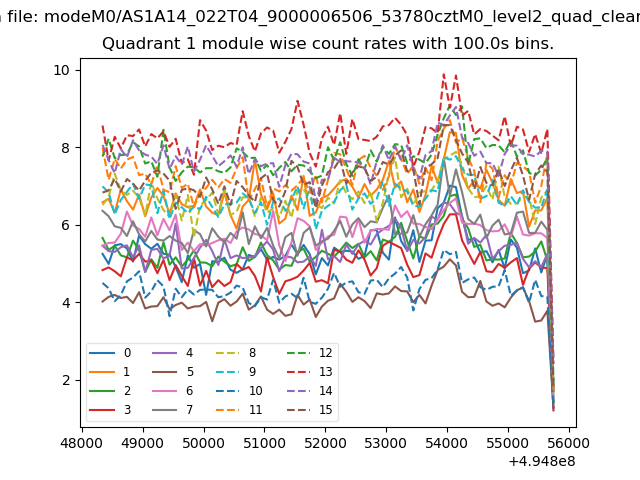
| Module-wise count rates for Quadrant A Data is divided into 100 sec bins |
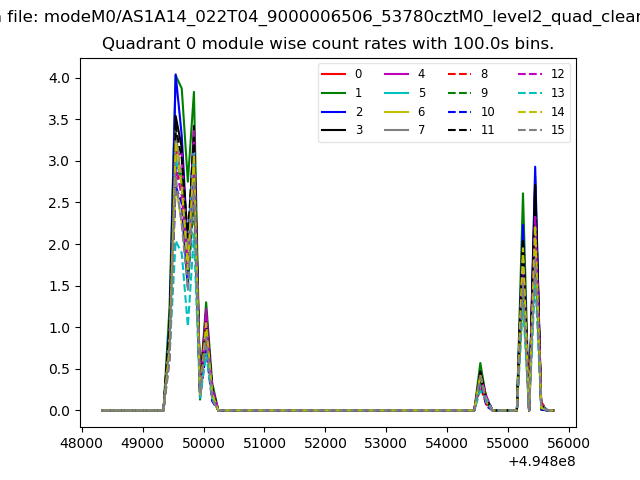 |
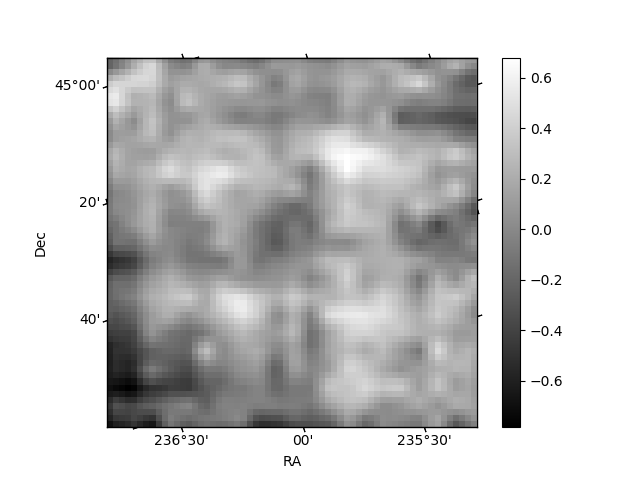 |
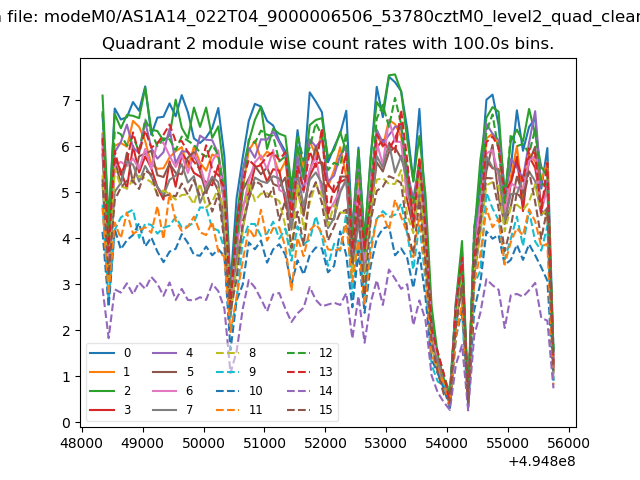
| Module-wise count rates for Quadrant B Data is divided into 100 sec bins |
 |
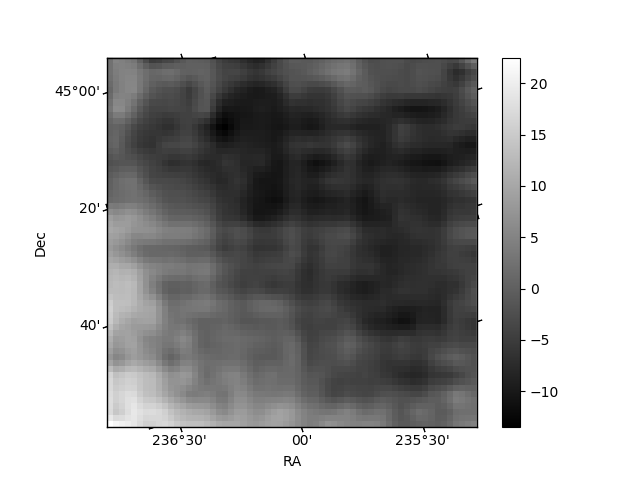 |
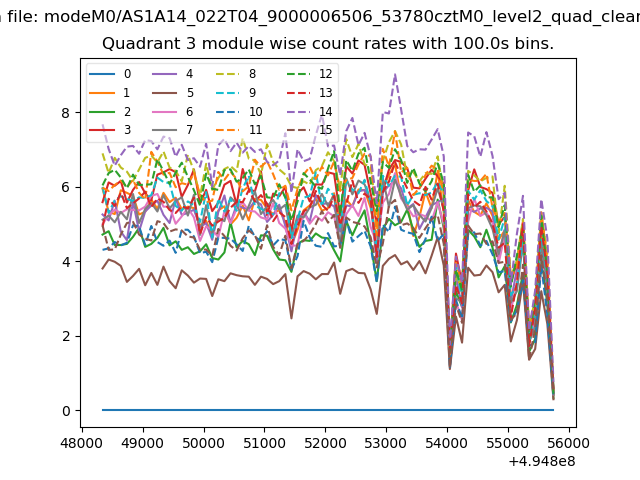
| Module-wise count rates for Quadrant C Data is divided into 100 sec bins |
 |
 |
| Module-wise count rates for Quadrant D Data is divided into 100 sec bins |
 |
 |
| Parameter | Plot |
|---|---|
| CZT HV Monitor | 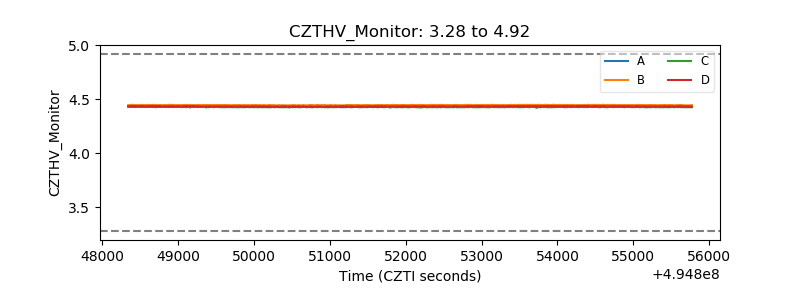 |
| D_VDD | 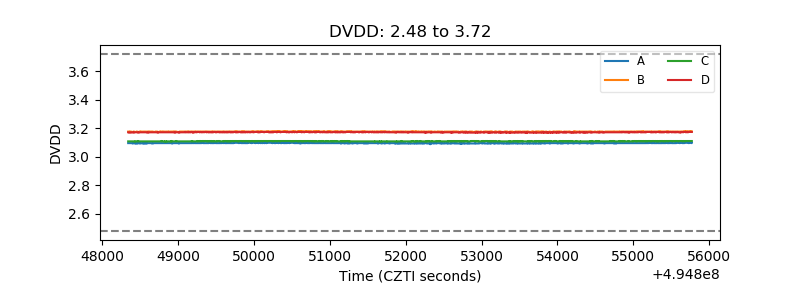 |
| Temperature 1 | 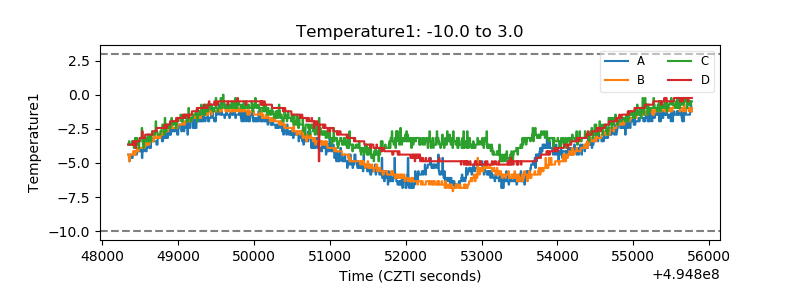 |
| Veto HV Monitor | 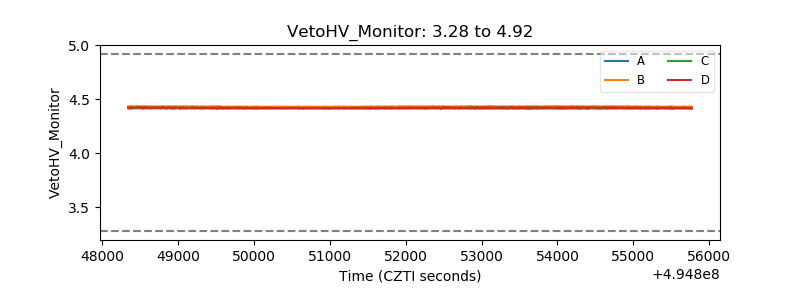 |
| Veto LLD | 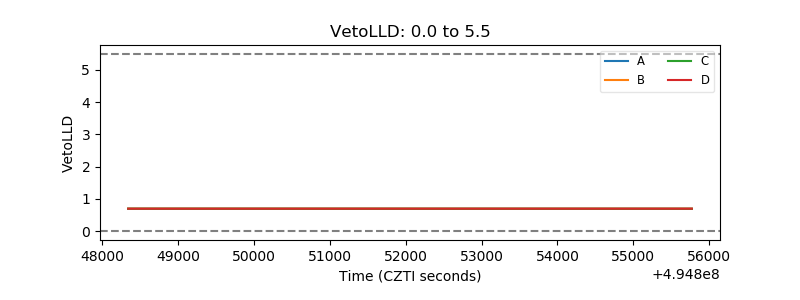 |
| Alpha Counter | 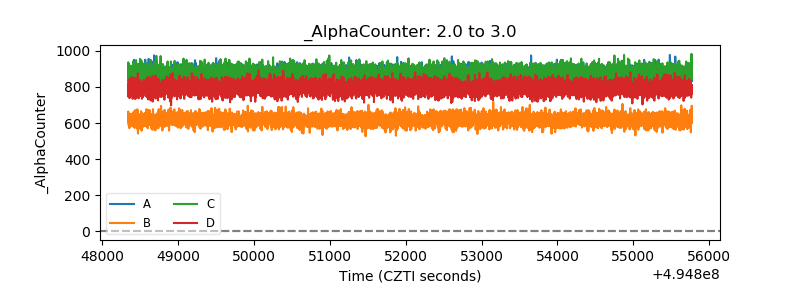 |
| _CPM_Rate | 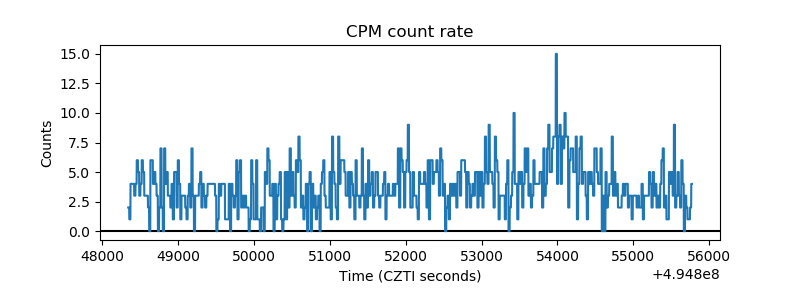 |
| CZT Counter | 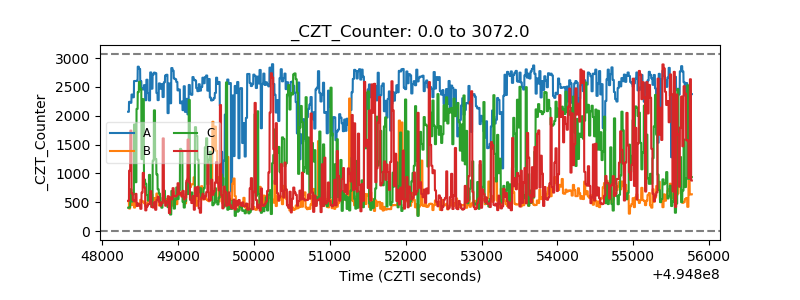 |
| +2.5 Volts monitor | 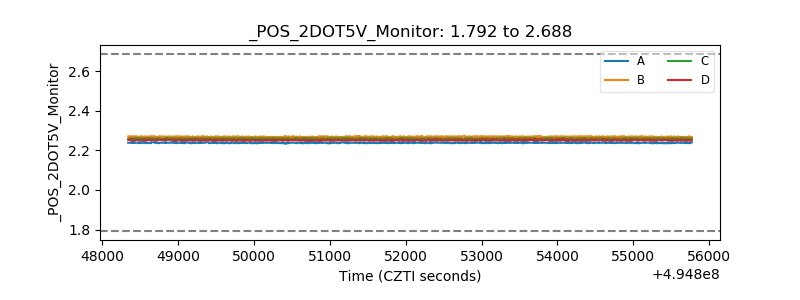 |
| +5 Volts monitor | 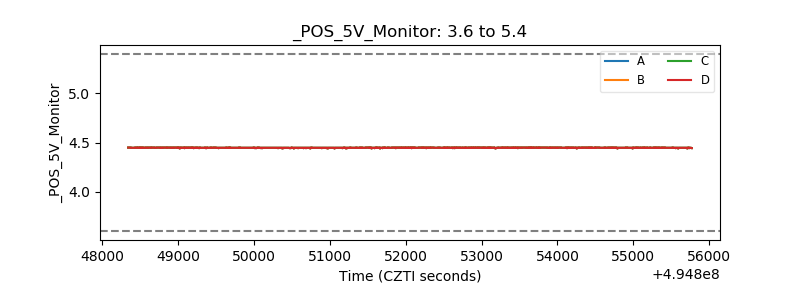 |
| _ROLL_ROT | 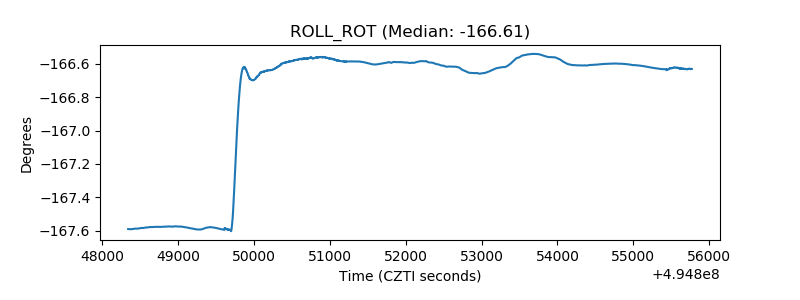 |
| _Roll_DEC | 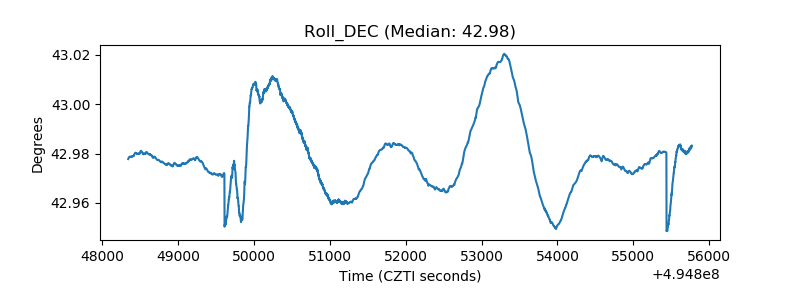 |
| _Roll_RA | 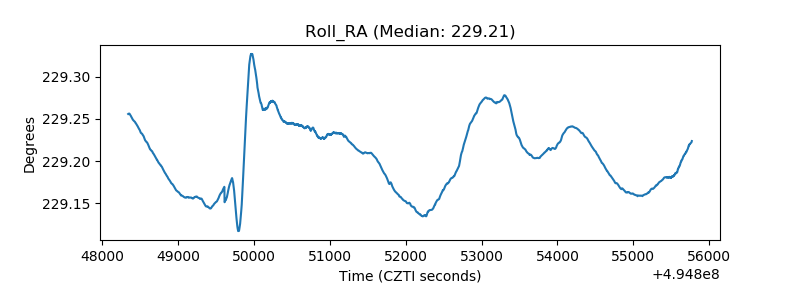 |
| Veto Counter | 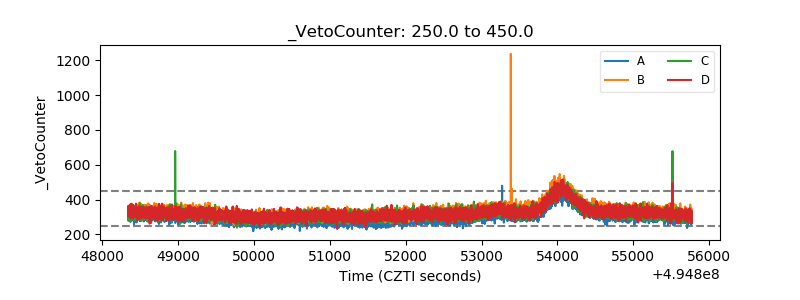 |